Development of a Low Aspect Ratio, Helicon Plasma Source using a Flat Spiral Antenna
Taisei MOTOMURA
*1, Kenji TANAKA
*1, Katsuhiko MURAKAMI
*1, Shunjiro SHINOHARA
*1, Takao TANIKAWA
*2and Ikkoh FUNAKI
*3Abstract
A low aspect ratio, high-density helicon plasma has been produced using a flat spiral antenna in the Large Helicon Plas- ma Device (LHPD) at Institute of Space and Astronautical Science / Japan Aerospace Exploration Agency (ISAS / JAXA).
The experimental method employed and some examples of the experimental results are presented. We describe in detail the behavior of the electron density as a function of the radio frequency (rf) input power. In particular, we focus on the behav- ior of the threshold power, which strongly depends on the magnetic field strength near the antenna, for the discharge mode transition from Inductively Coupled Plasma (ICP) to Helicon Wave Plasma (HWP). The spatial profiles of the rf wave structures for ICP and HWP are also presented in detail.
Keywords: Helicon wave plasma, High-density plasma, Low aspect ratio plasma, Flat spiral antenna, Inductively cou- pled plasma.
1. Introduction
A plasma produced by using a helicon wave, helicon plasma [1-4], is widely used in various applications, such as in basic science fields including space plasmas, the development of magnetoplasma rockets and a plasma processing. Using a helicon plasma for plasma pro- duction has some advantages of an easy operation and a wide range of operational parameters. In order to fulfill a need for a large volume plasma with a large diameter, a very large volume (up to 2.1 m3), high-density helicon plasma with a large diameter (73.8 cm) has been produced using the Large Helicon Plasma Device (LHPD) at Institute of Space and Astronautical Science / Japan Aerospace Exploration Agency (ISAS / JAXA) [5-10].
In some of the applications mentioned above, e.g., magnetoplasma rockets and a plasma processing, it is desirable to reduce the axial length of the plasma keeping a large diameter, or equivalently, to reduce the aspect ratio A, defined as the ratio between the device diame- ter and the device axial length. Note that this definition of Ais different from that based on the plasma diameter and the axial length: we have employed the former definition for convenience. Using the LHPD at ISAS / JAXA, we have attempted to effectively shorten the plas- ma column length from 486 cm to as short as 5.5 cm by installing a termination plate inside the chamber [Fig. 1 (a)], reducing Afrom 6.6 (axial length 486 cm / inner diameter 73.8 cm) to as small as 0.075 (5.5 cm / 73.8 cm). Note that the smallest Aattained in the previous experiment other than ours is so far 0.5 [11], which is much larger than our value (A= 0.075). The experimental results presented in this paper are taken for 0.4 ≤A≤6.6. The data for the smaller Aare presented in Ref. [12].
In this paper, after describing the experimental device and techniques, we present the experimental results of our low aspect ratio (A>~ 0.5), high-density helicon plasma. We focus on describing the behaviors of the electron density as a function of the input rf power, the
*1 Interdisciplinary Graduate School of Engineering Sciences, Kyusyu University
*2 Research Institute of Science and Technology, Tokai University
*3 ISAS/JAXA
dependence of the threshold power from Inductively Coupled Plasma (ICP) to Helicon Wave Plasma (HWP) on the magnetic field strength near the antenna, and the spatial profiles of the excited rf wave structures for both of ICP and HWP.
2. Experimental Setup
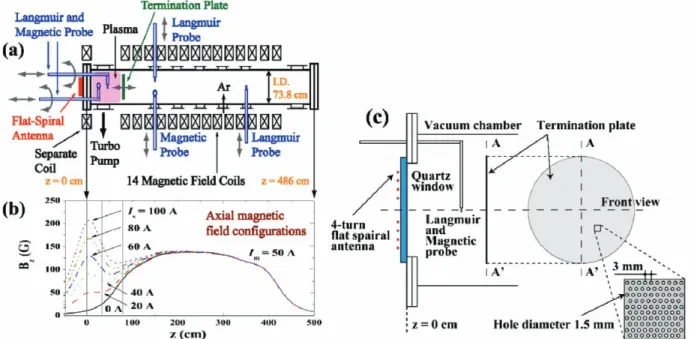
In this section, we describe the experimental apparatus and the measuring techniques for a low aspect ratio, high-density helicon plas- ma. In the LHPD at ISAS / JAXA as shown in Fig. 1(a) [5-10], the dimensions of the vacuum chamber are 73.8 cm and 75 cm in inner diam- eter and in outer diameter, respectively, and 486 cm in axial length. The number of access ports for various probes is 14 on the side walls of the chamber. There are 8 more access ports on the end flanges at both ends. A rotary pump and a turbo molecular pump are connected in series near the antenna region. The base vacuum pressure is < 5 ×10⁻⁶Torr. The axial magnetic field is produced by the 14 main coils and a separate coil which is located at the axial position of z= 0 cm. The values of the main coil current, Im, and the separate coil current, Is, are typically 50 A and 20 A, respectively. This combination of coil currents produces a uniform axial field of 140 G between z= 150 and 300 cm and a non-uniform axial field with a peak value of ~ 50 G in the plasma generation region. We note that it is possible to change the magnetic field configuration near the antenna, BA(r), by changing Is, as shown in Fig. 1(b). For the rest of the paper, the main coil current Imis fixed at 50 A unless stated otherwise.
A 4-turn flat spiral antenna [5]of 43 cm in diameter is connected to the rf power supply (maximum power of 5 kW at 7 MHz excitation frequency) through a matching circuit. The antenna is placed outside the vacuum chamber in atmosphere through a quartz window. The rf radiation pattern can be varied by changing the number of spiral turns used for the rf radiation by every 0.5 turns [5]. Note that the antenna excites waves with the m= 0 azimuthal mode.
A termination plate, which is movable between zE= 5.5 and 125 cm by using a dc servomotor, is placed in the vacuum chamber, and is electrically floating, where zEis the axial position of the termination plate. This plate is made of a 0.5-mm thickness stainless steel punch- ing plate. The diameter of each small hole is 1.5 mm, and the center-to-center separation of neighboring holes is 3 mm [see Fig. 1(c)]. A geometrical transparency of the plate is ~ 35 %. The working gas is argon (Ar) with a fill pressure pArof 0.75 ~ 15 mTorr. The gas is fed into the chamber using a needle valve at z~ 300 cm. The electron temperature Teis typically 3 eV.
Four Langmuir probes are used to measure the spatial profiles of the ion saturation current. Two magnetic probes are used to measure the axial component of the excited rf magnetic field B˜
z.
Fig. 1 (a) Schematic drawing of the LHPD. (b) Axial magnetic field configurations for various values of the separate coil current Isat a radial position of x= 0 cm. (c) Schematic drawing of the experi- mental setup near the flat spiral antenna.
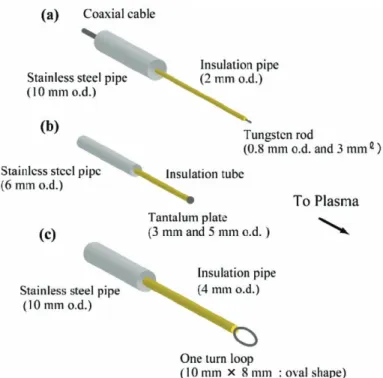
Two cylindrical Langmuir probes [Fig. 2(a)] and two magnetic probes [Fig. 2(c)] are inserted into the plasma from the end flange (antenna side). Their probe shafts are bent into an L-shape [see Fig. 1(a)] so that by rotating the probe shafts the probes can radially scan the plasma [the scannable horizontal (or radial) range is xp= -35 ~ 35 cm]. They are also axially movable (axial position zp= 0.5 ~ 80 cm).
One-sided plane probes with 3-mm and 5-mm diameter [Fig. 2(b)] are installed at zp= 45 cm and 336 cm, respectively.
In order to study the spatial profiles of B˜
z, the rf antenna current I˜
Ais used as a reference signal: the relative amplitude and phase of B˜
z
with respect to I˜Aare measured. For the measurement of the antenna current, we use a current probe (Pearson 6600) in the matching box, which utilizes a split tank circuit. The forward and reflected rf powers, Pforand Pref, respectively, are monitored using a directional cou- pler. The rf input power Pinpto the plasma is defined as Pfor- Pref. The ratio of the reflected rf power to the forward rf power, Pref/ Pfor, is typically much less than 0.2.
For a cylindrical plasma of uniform density immersed in a uniform dc magnetic field, the axial component of the rf magnetic field, B˜z, associated with the m= 0 helicon wave can be expressed by [13]
B
˜
z= Ak⊥j J0(k⊥jr)sin(kz- ˙t), (1)where kis the parallel wavenumber, J0(k⊥jr) is the Bessel function of the first kind, and k⊥jis the jth perpendicular (or radial) wavenumber. The perpendicular and parallel wavenumbers depend on the strength of the background magnetic field, the electron density and the excitation frequency. In calculating the axial profile of B˜
z, various damping effects [13], such as electron-neutral particle collisions, electron-ion collisions and the Landau damping, are taken into account.
3. Experimental Results
3.1 Behavior of the electron density as a function of the input rf power for full-length plasma cases
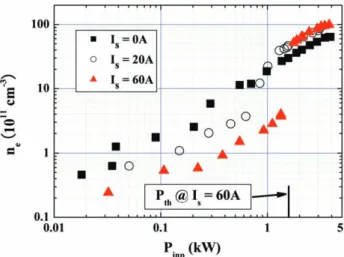
Figure 3 shows the electron density neof a plasma with 486 cm axial length, i.e., the case without the termination plate, as a function of the input rf powerPinpfor three different values of the separate coil current Is(= 0, 20 and 60 A) at pAr= 0.75 mTorr. Here, a Langmuir probe was placed at xp= 7.5 cm and zp= 31.5 cm. In the case of Is= 60 A, the vertical bar at Pinp~ 1.5 kW indicates the threshold power,
Fig. 2 Schematic drawings of (a) cylindrical and (b) plane Langmuir probes, and (c) a magnetic probe, respectively.
Pth, at which the discharge mode transition from a low density discharge (ICP) mode to a high density (HWP) one occurs.
From Fig. 3, it can be seen that the density jump at Pthis quite clear for the Is= 60 A case, while the density change from ICP to HWP for the Is<~ 20 A cases is rather gradual. With the increase in the rf power, the electron density increases almost continuously without a clear density jump for the cases of Is<~ 20 A. This feature can open up a useful operating regime for our plasma source.
In the high density discharge region, neslightly increases with increasing Is, i.e., the increase in the magnetic field strength near the antenna BA[see Fig. 1(b)]. The behavior of the threshold power Pthas a function of Iswill be described in Sec. 3.3.
3.2 Comparison between the plasma behaviors inside and outside the plasma generation region
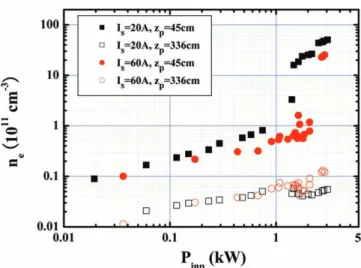
Figure 4 compares the rf input power Pinpdependences of the electron density neoutside the plasma generation region with those inside the plasma generation region, the region between the quartz window and the termination plate. Here, the aspect ratio of the plasma gener- ation region, A, is ~ 1.1, i.e., the position of the termination plate zEis 81 cm. In Fig. 4, the data for two different values of Is(= 20 A and 60 A) are shown with pAr= 0.75 mTorr. Two Langmuir probes were placed at two different axial positions, zp= 45 cm (inside the plasma generation region) and 336 cm (outside the plasma generation region), on the axis. We expect that the plasma in the plasma generation region leaks into the downstream side of the vacuum chamber through the small holes of the termination plate. As a result, neat zp= 336 cm is much lower than that of the antenna side at zp= 45 cm. In the downstream region, i.e., outside the plasma generation region, the rf noise is considered to be low, so that the plasma in this region can be useful for future space plasma simulation experiments, e.g., experiments to simulate nonlinear plasma waves observed in various space plasmas. While the density jump occurs at Pinp= 1 ~ 2 kW in the plasma generation region (see the data for the case of zp= 45 cm), the density jump is almost non-existent for the data at zp= 336 cm, whose inter- pretation is left for our future work.
When the helicon wave is excited in the high density discharge mode, the electron density is expected to be nearly proportional to the axial wavenumber of the helicon wave according to the dispersion relation [13]. The dispersion relation of the helicon wave with a uniform spatial density profile and magnetic field [13]is given by
k2(k2+ k⊥2
) =
( )
2, (2)where ˙pe, ˙ceand care the electron plasma angular frequency, the electron cyclotron angular frequency and the speed of light, respec- tively. According to eq. (2), the axial wavenumber kis expected to increase as neis increased with fixed k⊥. In Sec. 3.5, this tendency is discussed by using the results with A~ 0.5.
˙˙p2e
˙cec2
Fig. 3 Electron density neas a function of the input rf power Pinpwith 486 cm (full axial length) for three different values of Is(= 0, 20 and 60 A) at pAr= 0.75 mTorr. The Langmuir probe was placed at xp= 7.5 cm and zp= 31.5 cm.
3.3 Behavior of the threshold power Pthas a function of the separate coil current Is
In this subsection, we will explain how the threshold power Pthfrom the ICP to HWP modes behaves as a function of the separate coil current Is. In the cases of three different axial lengths, Pthincreases with the increase in Is, i.e., the increase in the magnetic field strength near the antenna, BA(see Fig. 5). In spite of the non-uniform magnetic field configuration [see Fig. 1(b)], the above observed behavior is very similar to the one observed in the previous work with the uniform magnetic field [14]. Here, the density jump at Pthcan be under- stood by the power balance between the power absorbed by plasma, which can be derived from the plasma loading, and the power lost out of plasma [15]. When Isis fixed, Pthis slightly dependent on zE. As zEis decreased, nein the high density region decreases, indicating the decrease in ne/ Pinpwith shortening the plasma length.
3.4 Comparison between the rf field structures in the high and low density regions
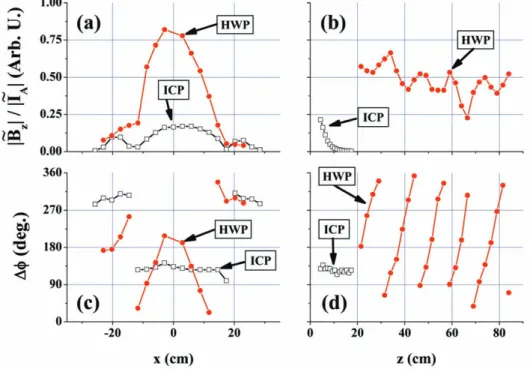
In this subsection, we will show that the high density plasma with the external magnetic field is an HWP and the low density plasma without the external magnetic field is an ICP by measuring rf field structures. In order to measure the rf field structures, we measure the excited rf magnetic field B˜z. Figure 6 shows the amplitude ratio of the excited rf magnetic field to the rf antenna current, |B˜z|/|I˜A|, and the phase difference ∆Í between B˜
zand I˜
Afor plasmas with zE= 486 cm at pAr= 0.75 mTorr. In the figure, the red circles are the data points for a high density HWP (Pinp~ 2.5 kW with Is= 60 A) and the square symbols indicate the data obtained for a low density ICP (Pinp~ 0.5 kW without magnetic field). The HWP measurements were performed in the high density region in Fig. 3 with Is= 60 A. For the radi-
Fig. 4 The rf input power Pinpdependence of the electron density neoutside and inside the plasma generation region with zE= 81 cm and pAr= 0.75 mTorr for Is= 20 A and 60 A.
Fig. 5 Threshold power Pthas a function of the separate coil current Iswith zE= 34.5, 81 and 486 cm.
al profile measurements of|B˜
z|/|I˜
A|and ∆Í [Figs. 6(a) and (c)], the magnetic probe location zpwas 21.5 cm for the HWP case and 5 cm for the ICP case.
First, we discuss the axial profiles of the rf wave structure in the low density region from Figs. 6(b) and 6(d). From Fig. 6(b), the e- folding length of|B˜z|/|I˜A|along the axial direction, Ld, is estimated to be ~ 2.8 cm in the low density region. The axial skin depth Ës
including the collision effect [16], although Ú/˙ has a small value of ~ 0.2 (Ú: total electron collision frequency, ˙: excitation angular fre- quency of 7 MHz), can be expressed as Ës= (c/ ˙pe) f(Ú), where c, ˙peand f(Ú) are the speed of light, the electron plasma angular fre- quency and a function of the total electron collision frequency, respectively. In our case, the difference between the decay lengths with and without the collision term is small, i.e., f(Ú) ~ 1.05. The axial skin depth in the ICP case is calculated to be ~ 3 cm, which is in agreement with the observed decay length of Ld~ 2.8 cm. In Fig. 6(d), the phase difference in the low density mode only slightly changes in the axial direction for z≤15 cm. The theoretical result of the axial wavelength, which includes a collision effect [16], is sufficiently long, i.e., the theoretical result of the axial phase change for the ICP case is negligible for z≤15 cm. Thus, the experimental results of the axial struc- ture of the measured rf wave in the low density mode are consistent with the axial wave structure of an ICP, which is theoretically pre- dicted by including the collisional effect.
Next, we discuss the radial profiles of the rf wave structure in the low density region from Figs. 6(a) and 6(c). From Fig. 6(a), the radial profile of the normalized amplitude,|B˜
z|/|I˜
A|, in the low density region is much smaller than the one in the high density region.
The large phase inversion (the polarity changes at x~ ±15 cm) of the low density discharge mode in Fig. 6(c) is very similar to the ana- lytical estimate of the rf magnetic field radiated by the flat spiral antenna in vacuum. Therefore, the experimental results of the radial pro- files of the rf wave structure in the low density region is not really associated with the plasma. We conclude that the both radial and axial profiles of the observed rf waves in the low density region are in good agreement with the wave structure of an ICP.
In the high density region, the radial profile of the normalized amplitude|B˜z|/|I˜A|is clearly different from that in the ICP. From Fig.
6(a), the maximum value of|B˜
z|/|I˜
A| in the high density region is about four times larger than that in the ICP. In Fig. 6(b), the decay length along the axial direction in the high density region is considerably longer than that of the ICP case. In Fig. 6(c), the radial profile of ∆Í has the propagating wave like structure, which must satisfy the fixed boundary conditions at the radial boundaries of the plasmas.
The phase in the high density region changes with the axial position [Fig. 6(d)], and the axial wavenumber is in agreement with the dis-
Fig. 6 Comparison between the rf field structures for an ICP (Pinp~ 0.5 kW without magnetic field) and an HWP (Pinp~ 2.5 kW with Is= 60 A). The radial and axial profiles of the nor- malized rf amplitude, |B˜z|/|I˜A|, are shown in (a) and (b), respectively. The radial and axial profiles of the phase difference between B˜
zand I˜
A, ∆Í, are shown in (c) and (d), respectively. Empty squares and filled circles indicate the data points for the ICP and the HWP, respectively.
persion relation of the helicon wave [13]. In Fig. 6(d), the measured wavenumber of HWP is ~ 0.3 cm-1, while the wavenumber predicted by Eq. (2) is ~ 0.6 cm-1. We believe that this difference mainly arises due to the fact that both electron density and dc magnetic field are non-uniform.
From the measurements, we have found that the radial profiles of our helicon waves can be expressed by a combination of at least two Bessel functions: J0(k⊥jr) with j= 1 and 2 [17-19]. Also the axial wavenumbers measured are derived from the dispersion relation with the smallest two radial wavenumbers. Additional experimental results of higher order radial profiles (j≥2) with a low aspect ratio (A~ 1.1), high density plasma are described in Ref. 9.
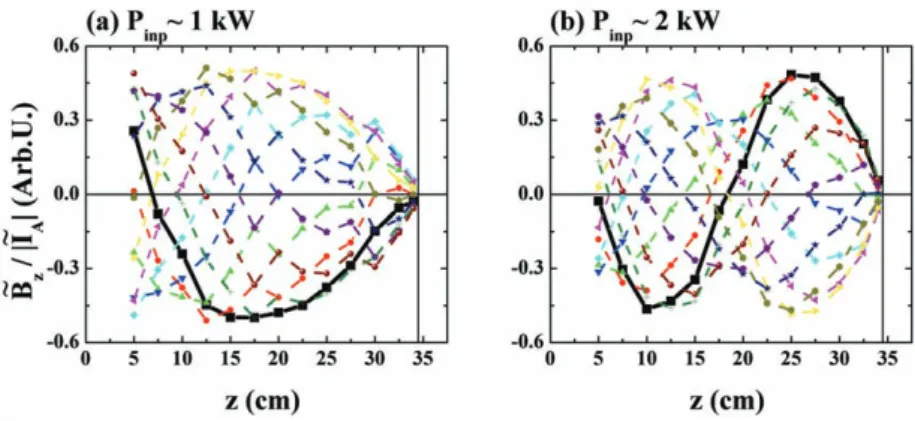
3.5 Wave structures of HWP: a low aspect-ratio case
Figures 7(a) and 7(b) compare the axial waveforms of the HWP in one rf period for two different values of the input rf power. The axial wave forms can be expressed by|B˜
z|/|I˜
A|sin(∆Í – ˙t) [see Eq. (1)]. Note that (|B˜
z|/|I˜
A|) and ∆Í are the functions of the position and each curve in Fig. 7 corresponds to a waveform at a different t. Also note that the B˜zmust be a node at the metal termination plate (z= zE) and an anti-node at the quartz glass window (z= 0) since the axial component of the rf conduction current, jz, and the rf electric field, Ez, must be zero at an insulator. Because of these boundary conditions, the following condition must be satisfied:
L= z+
(
z)
p, p= 0, 1, 2, … or n≡ = + p, p= 0, 1, 2, …(3)
where Lis the plasma column length, zis the axial wavelength, and nis the axial mode number. The axial mode numbers determined from Figs. 7(a) and 7(b) are 3/4 and 5/4, respectively. Apparently, the higher rf input power is (or the higher electron density is), the shorter wavelength becomes. This behavior is consistent with that of the helicon dispersion relation, Eq. (2).
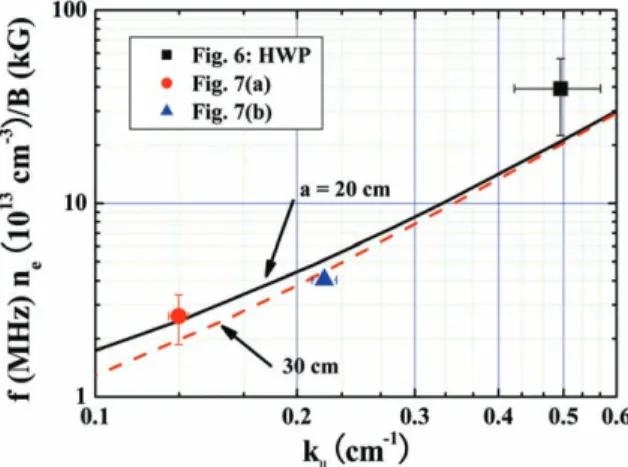
3.6 Comparison between the measured wave property and the helicon dispersion relation
In Fig. 8, we compare the measured axial wavenumber of the HWP with the theoretical one using Eq. (2) [13]. The black square, red cir- cle and blue triangle indicate the measured axial wavenumbers determined from Figs. 6, 7(a) and 7(b), respectively.
For the measurements shown in Figs. 7(a) and 7(b), the magnetic field configuration in the plasma generation region is nearly uniform with ~ 50 G [see Fig. 1(b)], while the magnetic field strength is axially non-uniform for the HWP measurement in Fig. 6. In our experi- ments, the effective plasma radius, a, is approximately 20 ~ 25 cm. The experimental results of Figs. 7(a) and (b) agree well with the dis- persion relation, Eq. (2), with a~ 20 cm. However, in order to recover the parallel wavenumber observed in Fig. 6 using Eq. (2), it is nec- essary to use a< 20 cm, which is too small compared with the experimentally observed plasma radius of ~ 20 cm. We infer from these results that the effects of the non-uniform magnetic field and the radial density profile play important roles in determining the real-world dispersion relation.
1 2 1 4 L
z
1 2 1 4
Fig. 7 Axial waveform, B˜
z/|I˜
A|, for the rf input power (a) Pinp~ 1 kW and (b) Pinp~ 2 kW with zE= 34.5 cm (or A~ 0.5), Is= 20 A and pAr= 0.75 mTorr.
4. Conclusions
We have described the characteristics of large-diameter (73.8 cm), high-density helicon plasmas with various aspect ratios (A= 0.47 ~ 6.6, corresponding to the axial length of 34.5 ~ 486 cm) produced using a flat spiral antenna. Typical electron density in the plasma gen- eration region is > 1012cm-3in the helicon discharge regardless of the plasma length. The threshold power for the density jump, Pth, tends to increase as the magnetic field strength near the antenna (z~ 0 cm) is increased. This tendency persists even if the plasma column length is varied. In the cases of the higher Is(≥60 A) and the longer axial length, Pthcan be defined more clearly than in the cases of the lower Is(<~ 20 A). When Is<~ 20 A with the full axial length of 486 cm, it is possible to smoothly vary the plasma density from 1010cm-3to >
1012cm-3by simply changing Pinp. This characteristic may open up a new application for our helicon device. In the case of 81 cm axial length, the plasma density outside the plasma generation region changes little even after the occurrence of the density jump inside the plas- ma generation region.
In the cases of full axial length, we have clearly observed the propagation of the helicon wave along the axial direction in the high den- sity discharge mode, i.e., the HWP discharge, whereas the evanescent wave structure along the axis is found in the low density discharge mode without the background dc magnetic field, i.e., the ICP discharge. The measurements of the wave structures of the HWP with A~ 0.5, i.e., the case of axial length with 34.5 cm, show that the discrete axial wavenumber increases with the increase in the electron density.
This trend is in agreement with the dispersion relation for an HWP with a uniform density profile and a uniform dc magnetic field [13].
Acknowledgements
Our experiments were performed at ISAS/JAXA under the research collaboration program. We are grateful to Dr. S. Sato, Dr. T. Take- da and Prof. K. Yamagiwa for their assistance in carrying out the experiments. The research was partially supported by the Grants-in-Aid for Scientific Research (A) 17206084, (B) 20340163 and (C) 19540524 from the Japan Society for the Promotion of Science.
References
[1] R. W. Boswell, Phys. Lett. 33A, 457 (1970).
[2] S. Shinohara, Jpn. J. Appl. Phys. 36, 4695 (1997).
[3] R. W. Boswell and F. F. Chen, IEEE Trans. Plasma Sci. 25, 1229 (1997).
[4] F. F. Chen and R. W. Boswell, IEEE Trans. Plasma Sci. 25, 1245 (1997).
[5] S. Shinohara and T. Tanikawa, Rev. Sci. Instrum. 75, 1941 (2004).
[6] S. Shinohara and T. Tanikawa, Phys. Plasmas 12, 044502 (2005).
Fig. 8 Comparison between the measured wave properties and the helicon disper- sion relation, Eq. (2). The solid and dashed curves show the dispersion rela- tion of the helicon wave determined from Eq. (2) [13]with the effective plas- ma radius of 20 cm and 30 cm, respectively. The black square, red circle and blue triangle indicate the wave properties determined from the experiments.
[7] T. Tanikawa and S. Shinohara, Thin Solid. Films 506–507, 559 (2006).
[8] T. Tanikawa and S. Shinohara, Proc. of the 12th Int. Cong. on Plasma Physics, (Nice, France, 2004), http://hal.archives-ouvertes.fr/hal-00002013/en/.
[9] T. Motomura, K. Tanaka, S. Shinohara, T. Tanikawa, K. P. Shamrai, J. Plasma Fusion Res. Ser. 8, 6 (2009).
[10] S. Shinohara, T. Hada, T. Motomura, K. Tanaka, Tanikawa, K. Toki, Y. Tanaka and K. P. Shamrai, Phys. Plasmas, 16, 057104 (2009).
[11] J. E. Stevens, M. J. Sowa and J. L. Cecchi, J. Vac. Sci. Technol. A 13, 2476 (1995).
[12] T. Motomura, S. Shinohara, T. Tanikawa and K. P. Shamrai, Proc. of XXIX International Conf. on Phenomena in Ionized Gases, Cancun Mexico (2009) PB 9-8.
[13] F. F. Chen, Plasma Phys. Control. Fusion 33, 339 (1991).
[14] S. Shinohara and K. Yonekura, Plasma Phys. Control. Fusion 42, 41 (2000).
[15] S. Shinohara and K. P. Shamrai, Plasma Phys. Control. Fusion 42, 865 (2000).
[16] S. Shinohara and Y. Kawai, Jpn. J. Appl. Phys. 35, L725 (1996).
[17] H. Takeno, Y. Yasaka, O. Sakai and R. Itatani, Nucl. Fusion 35, 75(1995).
[18] M. Light, Isaac D. Sudit, Francis F. Chen and Donald Arnush, Phys. Plasmas 2, 4094 (1995).
[19] Y. Sakawa, N. Koshikawa and T. Shoji, Plasma Sources Sci. Technol. 6, 96 (1997).