A Study on Classification of English Sentences by the Degree of Difficulty Using Data Mining
著者 島内 俊彦
著者別表示 Shimauchi Toshihiko journal or
publication title
博士論文要旨Abstract 学位授与番号 13301甲第5021号
学位名 博士(学術)
学位授与年月日 2019‑09‑26
URL http://hdl.handle.net/2297/00056495
Dissertation Abstract
A Study on Classification of English Sentences by the Degree of Difficulty Using Data Mining
データマイニングを⽤いた英語⽂書の難易度判定に関する研究
Graduate School of
Natural Science and Technology Kanazawa University
Division of Electrical Engineering and Computer Science
Student ID : 1724042009
Name: Toshihiko Shimauchi
This study is composed of following two approaches to enhance reading skills for English learners in Japan:
1. Classification of English sentences by the degree of difficulty using machine learning This study aims to develop a system to classify English sentences by the degree of difficulty by using English textbooks of Finland, Japan, and South Korea. First, the data sets are built by extracting features from English sentences included in 20 paragraphs from English textbooks used in Finland. The Random Forests algorithm is applied to the data set to build a classifier.
This method leads to a classifier which is able to classify sentences with higher accuracy.
Second, a two-tier classifier method is applied to wider datasets from textbooks of Finland.
The experiment shows the effectiveness of implementing multi-tier classifiers. These two new methods are applied to textbooks used in Japan and South Korea. The results of the experiments show that a model which classifies English sentences with higher accuracy can be developed by following the proposed methods.
2. Discriminant analysis on university students’ reading skills
Scores of English certificate exams have been drawing increasing attention as one of the indexes for English learning activities. If students’ proficiency based on certificate exams’
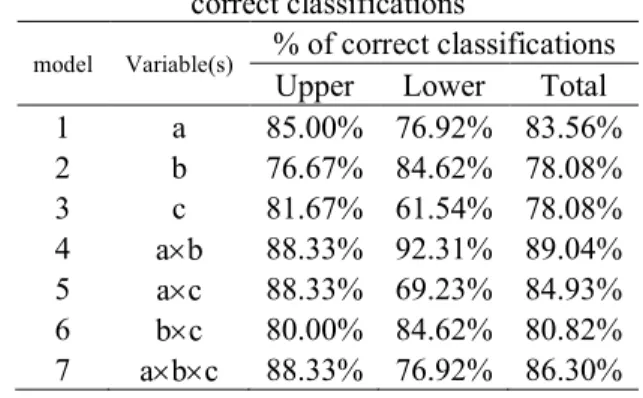
result can be estimated by using learning outcomes of English course, their objective proficiency can be assessed without additional cost. This study used learning outcomes of 73 students in a public university in Ishikawa. Their learning outcomes (weighted average scores of mid-term and final exams, assignment average scores, assignment average study hours, times of assignment submission) in an English reading course and reading scores of TOEIC Bridge were used for discriminant analysis. A model using weighted average sores of mid-term and final exams and assignments average scores yielded 89.04% accuracy to classify the students into upper and lower groups.
1. Introduction
Exponential growth of internet since 1990s allows many people in Japan to acquire the latest information and knowledge. These information and knowledge are mostly written in English. Hence, even those who do not have opportunities to communicate with inbound visitors from abroad or to work in foreign offices, reading English material is essential skills for them to stay productive and competitive in globalized economy. English instructions in secondary education system with strong emphasis on communicative skills do not fit with this overall situation. In order to nature reading skills, each student is advised to read many English material, in addition to English textbooks. However, it is difficult for the students to find appropriate reading materials which suit their reading skills. In order to find suitable materials, a system which estimates difficulty level automatically and recommend the material to a user is effective in encouraging out of classroom reading activities.
This study attempts to estimate difficulty level of English sentences by using school textbooks used in three countries. The school textbooks are designed so that the difficulty level increases according to grades.
The system developed in this study could be applied to reading materials such as magazines and journals.
2. Review of existing studies
There are several existing studies to estimate difficulty level of given English sentences using school textbook data. These various studies can be classified into two according to their approaches to the estimation. One group of studies uses readability formulas. The other group of studies uses machine learning method for estimating the difficulty level. The existing studies using readability formulas were simple to understand. However, they were not systematic enough to predict the difficulty level accurately. The studies using machine learning were more organized and produced an accuracy score upon which this study is going to develop.
3. Proposed Method to build datasets and feature extraction 3.1 Outline of Proposed System
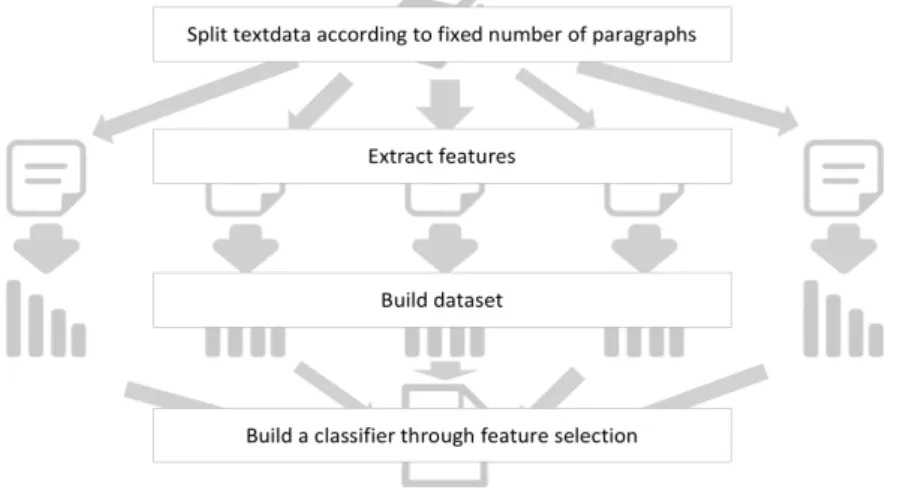
In this study, classifiers are built by using features extracted from English text and then develop a system to classify difficulty level of given English textbooks. Figure 1 shows the process of building classifiers. First,
features of English textbooks are extracted to develop training datasets. After building classifiers, the training datasets are used to validate the accuracy of the classifiers. Leave-one-out cross validation method is applied.
Figure 1 Process of building a classifier
3.2 Data Used
Text data from English school textbooks of Finland (from elementary 3rd to 6th and junior high 1st to 3rd), Japan and South Korea (both from junior high 1st to 3rd and high school 1st to 3rd ). For the textbook used in 3rd grade of South Korea high schools which include both reading and writing sections, only the reading section is used.
3.3 Features
Ten features (total letters, total letter types, total words, total word types, total sentences, average word length, words per sentence, sentences per paragraph, words per word types, comma per sentence) used in the existing studies and two features (average syllables, average syllables x 84.6) used in readability scores are used.
3.4 Process of Building Datasets
Figure 2 shows a process of building a dataset when 25 paragraphs are used for one instance. First, text data are preprocessed to fit one paragraph data into one line. 25 lines are used as a unit to extract features.
Extracted features are aggregated to make dataset. Figure 3 shows a sample of text data and extracted features. The dataset produced from the process are partially listed in Figure 4. Labels of dataset are manually adjusted for each grade.
Figure 2 Process of building dataset Figure 3 Feature extraction
Figure 4 Partial Dataset 3.5 Method
Training datasets are loaded to Weka to find feature subsets with the highest feature importance by using a feature selection method. As a feature selection method, brute force search is applied. Random Forest is used to build a model. The feature subsets located by the search are used as training data. To validate the accuracy of classifiers, leave-one-out cross validation is used, since the datasets do not contain sufficient number of instances. Accuracy and F-measure are used as validation indices.
3.6 Experiment and results
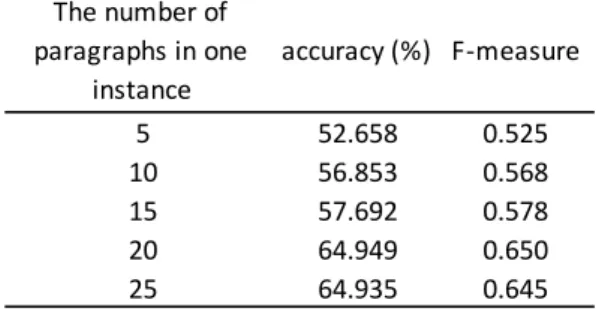
This experiment aims to find optimum amount of text data required to extract features for one instance used in training dataset. Text data used are from four English textbooks from E3 to E6 grade in Finland. Five datasets are generated according to the number of paragraphs: from 5, 10, 15, 20 and 25.
Table 5 Result of experiment to find optimum number of paragraphs The number of
paragraphs in one instance
accuracy (%) F-measure
5 52.658 0.525
10 56.853 0.568
15 57.692 0.578
20 64.949 0.650
25 64.935 0.645
Table 5 shows the results of the experiment. Both accuracy and F-measure show highest value at 20 paragraphs. 20 paragraphs are used as a unit for the analysis.
4. Development of two-tier classification model
Two-tier classification system is constructed with a first stage classifier performing general classification and second stage classifiers performing finer classification. One-tier classification used in the existing study and two-tier classification proposed in this chapter are applied to the experiments to compare the accuracy of each method. Dataset used in Chapter 3 are used in this Chapter.
4.1. Experiment and Results 4.1.1 Outline
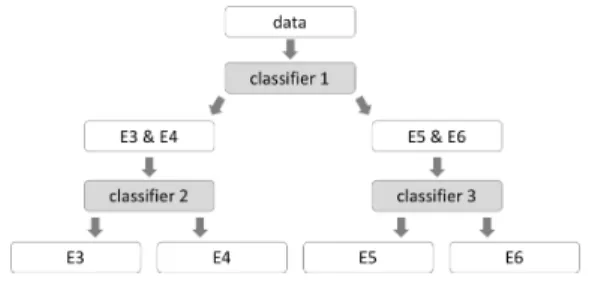
At the first stage, classifier 1 is placed to make binary classification between lower-grade group (E3 or E4) and higher-grade group (E5 or E6). At the second stage, two classifiers, classifier 2 and 3, respectively classify lower-grade group into E3 and E4 and higher-grade group into E5 and E6 to obtain 4 classes. Figure 4.1 shows the process of the two-tier classification.
Figure 6 Process of two-tier classification for textbooks of Finland
Table 7 Result comparison: one-tier versus two- tier models (Finland)
4.1.2 Results
Table 7 shows the comparison of the accuracy and the F-measures of one-tier and two-tier classifications.
Two-tier classification shows better result: 7.216 points higher accuracy and 0.072 higher F-measure.
5. Applying two-tier classifier model to wider grade textbooks
In this Chapter, the proposed system is applied to wider grade textbooks used in Finland. Specifically, classifier accuracy (%) F-measure
One-tier 64.949 0.650
1st / Two-tier 92.784 0.928 2nd / Two-tier 72.165 0.722
5.1.1 Outline
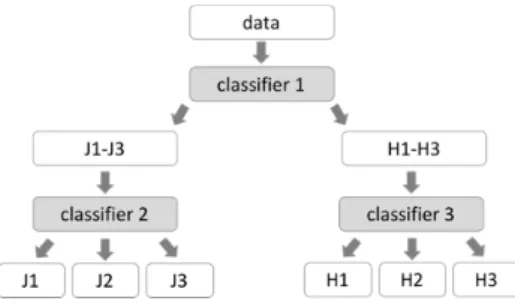
This experiment uses dataset for 7 years: from elementary E3 to Junior-High J3 in Finland to run one-tier and two-tier classifications. Figure 8 shows the process of two-tier classification. At the first stage, the data are classified into three classes: E3 and E4, E5 and E6 and J1 to J3. At the second stage, these three classes are further classified into each grade. Compared to the experiment in Chapter 4, an additional classifier is placed on second stage in order to cope with expansion of textbooks used.
Figure 8 Process of two-tier classification for textbooks of Finland (expanded to junior high)
Table 9 Result comparison: one-tier versus two- tier models (Finland expanded)
5.1.2 Results
Table 9 shows the comparison of the accuracy and the F-measures of one-tier and two-tier classifications.
Two-tier classification shows better result: 7.91 points higher accuracy and 0.078 higher F-measure.
6 Expanding Proposed Methods to textbooks used in Japan and South Korea
Two-tier classifier model is applied to English textbooks used in Japan and South Korea to investigate the robustness of the model for classifying textbooks used in cultural context different from Finland.
6.1 Experiments using textbooks of Japan and South Korea 6.1.1 Outline
One-tier and two-tier classifications are conducted. Figure 10 shows the process of two-tier classification.
classifier accuracy (%) F-measure
One-tier 53.107 0.531
1st / Two-tier 88.136 0.881 2nd / Two-tier 61.017 0.609
6.1.2 Results of textbooks of Japan
Table 11 shows the comparison of the accuracy and the F-measures of one-tier and two-tier classifications.
Two-tier classification shows higher result: 3.174 points higher accuracy and 0.028 higher F-measure.
6.2.3 Results of textbooks of South Korea
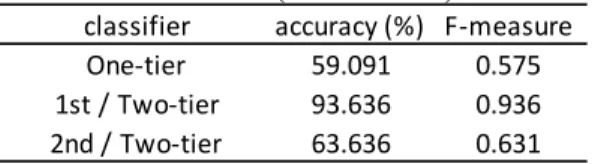
Table12 shows the comparison of the accuracy and the F-measures of one-tier and two-tier classifications.
Two-tier classification shows higher result: 4.545 points higher accuracy and 0.056 higher F-measure.
Table 11 Result comparison: one-tier versus two- tier models (Japan)
Table 12 Result comparison: one-tier versus two- tier models (South Korea)
7 Discriminant Analysis on University Students’ Reading Skills
TOEIC has been drawing attentions from business world, owing to the widening and acceleration of the economic globalization. Although the test has been attracting as an objective certificate to assess examinee’s proficiency, the cost is rather high. When a student can estimate the TOEIC score from own learning outcomes related to course activities, it is possible for him or her to decide when to take an official test based on the estimated scores. The estimation will also allow a teacher to give necessary instruction and advice to each student according to his or her proficiency. The discriminant analysis has been applied to classify students into upper and lower groups based on TOEIC Bridge reading scores by using learning outcomes in an English course conducted in a public school in Ishikawa.
7.1 Experiment 7.1.1 Participants
First year students in the Faculty of Intercultural Communication of Komatsu University participated in this project. In fall semester of 2018, they were required to take “English III” course. 76 students took TOEIC
6.5
classifier accuracy (%) F-measure
One-tier 73.016 0.721
1st / Two-tier 100.000 1.000 2nd / Two-tier 76.190 0.76
classifier accuracy (%) F-measure
One-tier 59.091 0.575
1st / Two-tier 93.636 0.936 2nd / Two-tier 63.636 0.631
“Skills for Better Reading, revised edition” published by Nanun-do was used for the course.
TOEIC Bridge is a simplified version of TOEIC. It consists of listening part (50 questions for 25 minutes) and reading part (50 questions for 35 minutes). The scores are 90 each (180 in total).
7.1.3 Learning outcomes Assignments
The course was conducted over 16 weeks. For 13 weeks, reading assignments were given to the students.
The assignments were adopted from written tests of EIKEN Grade P1. 10 questions in reading sub-section were printed and distributed to the students as an assignment at the end of class each week.
Mid-term and final exams
The mid-term exam was conducted in November 2018. The final exam was held in February 2019. A weighted average score of mid-term and final exams was calculated for each student.
7.1.4 Methods and Software
Google Apps were used for collecting and scoring the assignments. The students were required to register study hours in addition to the answers to the assignment. Bell Curve for Excel (version 2.15) from Social Survey Research Information was used for discriminant analysis. We used discriminant analysis instead of regression analysis because the distribution of TOEIC Bridge reading score was not normal.
7.2. Results 7.2.1 Correlation
The partial correlation coefficients in Table 13 shows that the number of submissions has a weak correlation with the reading score. This explanatory variable was excluded and the remaining three learning outcomes were used for discriminant analysis.
Table 13 Partial correlation matrix (n=73)
1 2 3 4 5
1 Reading
Score - .317 .332 -.276 -.056 2 WAS ** - .462 .001 -.027 3 AAS ** ** - -.073 .362
4 AHRS ** - .098
5 ATMS -
Table 14 Experiment results: percentage of correct classifications
model Variable(s) % of correct classifications Upper Lower Total
1 a 85.00% 76.92% 83.56%
2 b 76.67% 84.62% 78.08%
3 c 81.67% 61.54% 78.08%
4 a´b 88.33% 92.31% 89.04%
5 a´c 88.33% 69.23% 84.93%
6 b´c 80.00% 84.62% 80.82%
7.2.2 Overview of discriminant analysis
The students were divided into upper and lower groups based on TOEIC Bridge reading scores. The threshold between the group was set at 80% correct scores. The analysis overview is shown in Table 7.9.
8 Conclusions
One of the purposes of this study is to develop a system which estimates difficulty level of English sentences.
School textbooks used in three countries (Finland, Japan, South Korea) were used in the experiments to investigate the effectiveness of the proposed classification system which has two-tier classifiers.
The system has been developed by using textbook data from Finland. However, the results have showed the experiments using textbooks used in Japan yielded the highest F-value (0.750), followed by those used in South Korea (0.631). F-value for the experiment using textbooks for seven years in Finland showed the lowest result (0.609). These results can be interpreted that the textbooks used in Japan and South Korea have fewer overlap between grades compared to those used in Finland, especially for junior high school.
Despite these differences in F-value for the experiment results, the proposed system has shown overall high accuracy especially at the first stage. General classification by the first-stage classifier offers good starting point to many English learners to find a reading material which suits reading skills for each learner. Reading materials classified as equivalent to junior high textbooks can be recommended to most of the learner, since compulsory education continues until junior high and by definition, almost all the people in Japan are expected to understand English text at this level.
The other purpose is to use learning outcomes from regular course works to estimate students’ proficiency based on certificate exams’ result. This study used learning outcomes of 76 students in a public university in Ishikawa. Their learning outcomes (weighted average scores of mid-term and final exams, assignment average scores, assignment average study hours, times of assignment submission) in an English reading course in 2018 fall semester and reading scores of TOEIC Bridge in February of 2019 were used for discriminant analysis. A model using weighted average sores of mid-term and final exams and assignments average scores yielded 89.04% accuracy to classify the students into upper and lower groups. The threshold