7 2
=
9 15879310
1
横磁場下一軸異方性のある
S = 1一次元近藤格子模型 の基底状態
鈴木浩平
首都大学東京 理工学研究科物理学専攻
平成
29年
2月
17日
目 次
第
1章 研究背景
31.1
強磁性超伝導物質
. . . . 31.2
一次元近藤格子模型
. . . . 71.3
研究目的
. . . . 7第
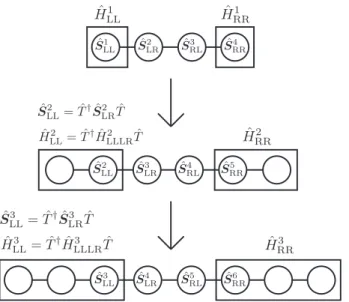
2章 実空間くりこみ群から密度行列くりこみ群へ
8 2.1ブロックくりこみ群
. . . . 92.2 Wilson
の数値くりこみ群
. . . . 102.3
密度行列くりこみ群
. . . . 122.3.1
無限系アルゴリズム
. . . . 122.3.2
有限系アルゴリズム
. . . . 16第
3章 一軸異方性のある
S = 1横磁場近藤格子模型
18 3.1基底の選び方
. . . . 193.2
期待値と相関関数
. . . . 213.3
計算精度
. . . . 22第
4章 結果
23 4.1 h−J相図
. . . . 234.2
磁化
. . . . 244.3
スピン分布
. . . . 274.4
スピン相関
. . . . 32第
5章 まとめと今後の展望
37付 録
A Lanczos法
38付 録
B逆反復法
40付 録
C共役勾配法
42付 録
D nc ̸= 1/2の結果
43 D.1 nc = 3/4 . . . . 43D.1.1 h−J
相図
. . . . 43D.1.2
磁化
. . . . 44D.1.3
スピン分布
. . . . 46D.1.4
スピン相関
. . . . 50D.1.5
電荷密度波
. . . . 55D.2 nc = 1 . . . . 57
D.2.1 h−J
相図
. . . . 57D.2.2
磁化
. . . . 57D.2.3
スピン分布
. . . . 59D.2.4
スピン相関
. . . . 63付 録
E伝導電子のフェルミ波数
68第 1 章 研究背景
1911
年、Kamerlingh Onnes により
Hgが温度
Tsc = 4.2 K以下で電気抵抗がほとんどゼロに なる超伝導現象が発見された。また、超伝導体に磁場をかけると、これを打ち消すように電流 が流れ、超伝導体内部では磁場がゼロになるマイスナー効果も発見された。これ以降、様々な 物質で超伝導現象が発見されていくが、理論的な理解にはしばらく時間がかかり、最初の発見 から
46年後の
1957年にこの現象を説明する理論として、John Bardeen、Leon Cooper、John
Schrieffer
らが
BCS理論を提案した
[1]。BCS理論から導かれる結論は、純粋金属の超伝導現
象に対する実験結果をよく説明し、超伝導の理論的な解釈は一応の解決を見た。しかし、その 後銅酸化物における高温超伝導など
[2]、BCS理論では説明できないとされる現象がいくつか 見つかっている。その中の一つに、強磁性と超伝導の共存がある。マイスナー効果の例もあり、
1900
年代までは強磁性と超伝導が共存することは難しいと考えられてきた。しかし、2000 年に 入ってから
UGe2、UCoGe、URhGe などのウラン化合物で、強磁性と超伝導が共存することが 分かってきており
[3]、盛んに研究がなされている。以下、1.1 節でこれらの実験結果についてまとめた後、1.2 節で一次元近藤格子模型について 説明し、1.3 節で本研究の目的を述べる。
1.1
強磁性超伝導物質
強磁性と超伝導が共存する強磁性超伝導は
2000年に
UGe2で初めて見つかった
[4]。この物質は図
1.1のような
Uのジグザグ鎖により構成されており
[5]、a軸方向に強い磁気異方性を持つ。
強磁性転移は
Tc = 52 Kで起こり
[6]、このときa軸方向に大きさ
M0 ∼1.5µBの磁気モーメン トが発生する。圧力をかけていくと
Tcが下がっていき、臨界圧力
Pc ∼1.5 GPaで常磁性
(PM)が基底状態になる
[7]。超伝導(SC)は圧力が
1.0 GPa付近から現れ始め、P
x ∼1.2 GPaのとき に最高の超伝導転移温度
Tsc = 0.7 Kとなる
[図1.2]。この圧力下ではTc∼35 Kであり、T
scよ り十分に高温で強磁性になっており、強磁性と超伝導が共存していることが分かっている
[8]。また、この系は
Px∼1.2 GPaを境界として、低圧力側の
M0 ∼1.5µB程度の大きな磁気モーメ ントを持つ強磁性相
(FM2)から、高圧力側の
M0 ∼1µB程度の小さな磁気モーメントを持つ強 磁性相
(FM1)へと一次転移する。P
xよりわずかに大きい圧力
P = 1.35 GPa下では、この系の
a軸方向に磁場を印加した場合、FM1 と
FM2の相境界で超伝導臨界磁場
Hc2が大きくなり
[図1.3]、超伝導と二つの相における一次転移の臨界終点との関係が注目されている [9, 10]。
UGe2
では、高圧下で強磁性と超伝導が共存したが、2001 年に
URhGeが常圧下で強磁性超 伝導を発現することが分かった
[11]。この物質も強い磁気異方性(∥c軸) を持ち、T
c = 9.5 Kで 強磁性転移し、c 軸方向に
M0 = 0.4µBの磁気モーメントを持つ。さらに低温の
Tsc = 0.26 Kで 超伝導になる。結晶構造は図
1.1のような
Uによるジグザグ鎖を持つ。また、図
1.4のように、
b
軸方向の磁場を大きくしていくと、H
= 2 Tまでは超伝導であるが、より高磁場では超伝導
が消える。しかし、H
≈ 11 Tで再び超伝導
(Reentrant SC: RSC)が現れ、H
R ≈12 Tで最も
高い超伝導転移温度
Tsc= 0.42 Kを持つ
[12]。注目すべき点は、このRSCは強磁性状態が横磁
場
(∥b軸) により安定化する臨界磁場
(図1.4)と相関しているように見える点である。図
1.5に 示したように、磁化は
H ≈12 T付近でメタ磁性的に急激に増大している
[13]。何らかの“ゆらぎ”が磁場下で超伝導を誘起している可能性がある、という点において、UGe
2、URhGe は共通 していると言える。このような観点から、いくつかの理論提案がなされている
[?, 14, 16]。さらに、2007 年には
URhGeと同じ結晶構造を持つ
UCoGeでも強磁性超伝導が発見され た
[17]。この物質はTc= 3 Kで強磁性転移するが、磁気モーメントの大きさが、M
0 ∼0.05µBと極めて小さい。図
1.6に
UCoGeの温度
(T)-圧力(P)相図を示す
[18]。URhGeと同様に常圧 でも強磁性超伝導となり、P
∼1.2 GPaで
Tscが最も高くなる。その圧力はやはり強磁性の量
子臨界点
(絶対零度の臨界点)に近い。また、スピン格子緩和時間の測定から、スピンのゆらぎ
も強い一軸磁気異方性を持つことが示されている
[19]。図1.7にスピン格子緩和時間
T1の角度 依存性を示す。b 軸方向の緩和が非常に速いことから、同じ結晶構造を持つ
URhGeも
b軸方向 に磁気異方性を持つことが期待される。また、図
1.8に示すように
UCoGeにおいても
b軸方向 に磁場を印加すると、超伝導の
Hc2が非単調な振る舞いを示すことから
[20]、URhGeと共通の 機構が働いている可能性がある。
ambient pressure.14)Recently UCoGe with identical crystal structure of URhGe was found to be a ferromagnetic superconductor, as well.15) In all of these compounds, Tsc
is lower thanTCurie, indicating that SC phase exists in the FM phase, which is contrary to the previous case such as ErRh4B4 or Chevrel phase compounds whereTsc is higher than TCurie. Furthermore, the ordered moments of uranium ferromagnetic superconductors are much lower than those expected from the free uranium ion. Therefore5f electrons are naively believed to be itinerant. To date, all the ferromagnetic superconductors are uranium compounds.
The well-known weak ferromagnet ZrZn2was first reported to reveal SC,16) however after careful sample preparations and characterizations, SC was found to be extrinsic most likely due to the Zr alloys on the surface.17)SC is observed in the ferromagnet UIr with non-inversion symmetry of the crystal structure in FM3 phase in narrow pressure range (2:6.P .2:8GPa) with the maximum Tsc!0:15K. The bulk SC has not been established yet. The upper critical field of SC is quite small (!0:026T) compared to those for above mentioned three ferromagnetic superconductors.
In this paper, first we review experimental results of three ferromagnetic superconductors UGe2, URhGe, and UCoGe.
Next we describe some theoretical views for FM and SC.
Finally the conclusion and remarks are given. A very recent complementary our review of ferromagnetic superconduc- tors can be found in ref.18.
2. UGe2— The First Ferromagnetic Superconductor:
Superconductivity and Phase Diagram
UGe2crystallizes in the orthorhombic structure, as shown in Fig. 1.19) The U zig-zag chain with the distance of the next nearest neighbordU{U¼3:85A! is formed alonga-axis, which is similar to!-U with CDW. The FM transition had been observed at TCurie¼52K20) and the ordered moment is relatively large, M0!1:5"B. The properties of UGe2, together with URhGe and UCoGe are summarized in Table I. The magnetic moment is directed along a-axis.
With increasing pressure T collapses and finally PM
ground state is realized above the critical pressure Pc!1:5GPa.21) Surprisingly, SC appears around 1.2 GPa withTsc!0:7K as a maximum. As shown in Fig. 2, at this pressure TCurie!35K is much higher than Tsc and M0 is also large (!1"B).
Both TCurie and M0 collapse at Pc. Complementary measurements23,24) show later that the maxima of Tsc
corresponds to the pressure just atPx!1:2GPa where the system switches from large moment (M0!1:5"B) at low pressure phase (FM2) to small moment (M0!1"B) at high pressure phase (FM1), through a first order transition. The transition from FM1 to PM is also associated with the first order transition at Pc with an abrupt drop of sublattice magnetization ("M0!0:8"B).25) Evidences for homoge- neous coexistence of FM and SC atP!Px were given by the persistence of FM in the SC phase observed in neutron diffraction experiments,26) the temperature dependence of nuclear spin–lattice relaxation rate in NQR measurements b
U Ge
UGe2 URhGe, UCoGe
c a
c
U
Rh or Co Ge
b a
Fig. 1. Crystal structure of UGe2, URhGe, and UCoGe. The arrows on the U site denote the direction of the moment.
Table I. Characteristic properties of UGe2, URhGe and UCoGe.
dU{U: distance of the first nearest neighbor of U atom, M0: ordered moment, Hint: internal field associated with M0, Pc: critical pressure between FM and PM,Ha;b;cc2 : upper critical field forHka,b,c-axis.
UGe2 URhGe UCoGe
Structure Ortho. Ortho. Ortho.
Space group Cmmm Pnma Pnma
dU{U(A)! 3.85 3.50 3.48
TCurie(K) 52 9.5 !3
M0("B) 1.48 0.4 !0:05
Mag. easy-axis a c c
Hint(T) 0.28 0.08 0.01
#(mJ/K2mol) 34 160 55
Pc(GPa) 1.5 <0 !1:2
Tsc(K) 0.8 0.26 0.7
"C=#Tsc !0:3 0.6 0.7
Hc2a (T) 1.4aÞ 2.5 >30
Hc2b (T) 2.4aÞ 2 !18
Hc2c (T) 4.8aÞ 0.7 0.6
a) The values ofHc2in UGe2are at!1:2GPa.
D. AOKIand J. FLOUQUET J. Phys. Soc. Jpn.81(2012) 011003 SPECIALTOPICS
図
1.1: UGe2,UCoGe,URhGeの結晶構造。U サイトの矢印は自発磁化の方向を表す。[3] より 転載。
4
!"#$%&"# '()"*+,-#(+&$.$&/0 1(!"*$+%2 %-%2/'"' '(33"'& &4%& &4"
'()"*+,-#(+&$-3 &*%-'$&$,- &"!)"*%&(*"!56#(" &, !%3-"&$+ $-&"*7
%+&$,-' $' -,*!%22/ !(+4 2,8"* 9,* &4" ')$-7&*$)2"& )%$*$-3 %))*,7 )*$%&" 9,* ,(* +%'" ,9 % -"%*2/ 9"**,!%3-"&$+ !"&%2: &4%- 9,* &4" ')$-7 '$-32"& "."-7)%*$&/ )%$*$-3 ";)"+&"#: 9,* ";%!)2": 9,* &4" !,*"
+,!)2"; +%'" ,9 % -"%*2/ %-&$9"**,!%3-"&$+ !"&%2 %& 2"%'& $- &8,
#$!"-'$,-'<=0 >?4$' %''(!"' &4%& &4" )%*%!"&"*' "-&"*$-3 &4" !,#"2
%*" ,&4"*8$'" &4" '%!"0@ A B"/ #$99"*"-+" C"&8""- &4"'" &8, +%'"'
$' &4%& %- $!),*&%-& 9%+&,* #"D-$-3 &4" !%3-"&$+ $-&"*%+&$,- ),&"-&$%2E-%!"2/: &4" ";)"+&%&$,- ,9 &4" $--"* )*,#(+& ,9 &4"
')$-' ,9 &4" $-&"*%+&$-3 F(%'$)%*&$+2"'E$' &4*"" &$!"' '&*,-3"* $-
!%3-$&(#" 9,* &4" ')$-7'$-32"& '&%&" &4%- 9,* &4" ')$-7&*$)2"& '&%&"0
?4$' )"+(2$%* F(%-&(! )*,)"*&/ 4,2#' ,-2/ 9,* )%*&$+2"': '(+4 %' &4"
9"*!$,-' ,9 $-&"*"'& 4"*": 8$&4 ')$- F(%-&(! -(!C"* ,9 ,-"74%29 $- -,*!%2 $',&*,)$+ ')%+"0
A2&4,(34 &4"*" $' 3*,8$-3 ".$#"-+" 9,* &4" ";$'&"-+" ,9 !%37 -"&$+%22/ !"#$%&"# '()"*+,-#(+&$.$&/ $- 3"-"*%2: !,'& ,9 &4" $-9,*7
!%&$,- 3%&4"*"# &4(' 9%* +,-+"*-' &4" !,*" +,!)2"; ";%!)2"' ,9 ')$-7'$-32"& )%$*$-3 -,*!%22/ %'',+$%&"# 8$&4 !"&%2' ,- &4" C,*#"*
,9 %-&$9"**,!%3-"&$'! %' ,)),'"# &, 9"**,!%3-"&$'!GHIJ0 K%3-"&$+
)%$*$-3 ,9 F(%'$)%*&$+2"' '$!$2%* &, &4" '$!)2"'& B$-# 8" +,-'$#"*
%C,." $' $-#""# &4,(34& &, C" *"2".%-& &, '()"*L($#$&/ $- 2$F($#IM"
>*"9' IHN@: C(& &4" +,**"'),-#$-3 )4"-,!"-% $- &4" -"%*2/ 9"**,7
!%3-"&$+ !"&%2' 4%' C""- !,*" "2('$."0 ?4" 2%+B ,9 '(++"'' $- !%-/
'"%*+4"' 9,* &4$' '$!)2"'& B$-# ,9 !%3-"&$+%22/ !"#$%&"# '()"*7 +,-#(+&$.$&/: '&%*&$-3 8$&4 "%*2/ 8,*B ,- &4" -"%*2/ 9"**,!%3-"&$+
!"&%2 O#: 4%' +%'& #,(C& ,- &4" .%2$#$&/ ,9 &4" &4",*/ ,9 !%3-"&$+%22/
!"#$%&"# '()"*+,-#(+&$.$&/ %' $& $' )*"'"-&2/ 9,*!(2%&"#P "."- &4"
),''$C$2$&/ ,9 % )(*"2/ "2"+&*,-$+ !"+4%-$'! 9,* '()"*+,-#(+&$.$&/
$- 3"-"*%2 4%' C""- #,(C&"#0
Q- +2,'"* ";%!$-%&$,-: 4,8"."*: 8" D-# &4%& ."*/ 9"8 $&$-"*%-&7
"2"+&*,- 9"**,!%3-"&' '&(#$"# &, #%&" 4%." C""- )*")%*"# $- % '(9D+$"-&2/ )(*" '&%&": ,* 4%." C""- R&(-"#S >9,* ";%!)2": C/
4/#*,'&%&$+ )*"''(*"@ &, C" '(9D+$"-&2/ +2,'" &, &4" C,*#"* ,9 9"**,!%3-"&$'!: ,* +,,2"# &, '(9D+$"-&2/ 2,8 &"!)"*%&(*"': &, )*,.$#" % #"D-$&$." +4"+B ,9 &4" )*"#$+&$,-' ,9 &4",*/ >9,* %
*"+"-& *".$"8: '"" *"90 II@0 T"+"-& %-%2/'"' '(33"'& &4%& O#: 2,-3 +,-'$#"*"# &4" %*+4"&/)%2 $-+$)$"-& 9"**,!%3-"&: $' $- 9%+& &,, 9%*
*"!,."# 9*,! &4" C,*#"* ,9 9"**,!%3-"&$'! &, C" % )*$!" +%-#$7
#%&" 9,* !%3-"&$+%22/ !"#$%&"# '()"*+,-#(+&$.$&/ >O0K0 %-# U0U0V0:
(-)(C2$'4"# *"'(2&'@0 V,87&"!)"*%&(*" 9"**,!%3-"&' '(+4 %' W*W-J 4%." -,& /"& C""- )*")%*"# $- '(9D+$"-&2/ )(*" 9,*! &, C" ";)"+&"#
&, ";4$C$& &4$' B$-# ,9 '()"*+,-#(+&$.$&/: "."- -"%* &4" +*$&$+%2
)*"''(*" 84"*" &4" 6(*$" &"!)"*%&(*"!6.%-$'4"'IX0 Y- ,-" )*,!$'7
$-3 '/'&"!: K-5$: $- 84$+4 &4" &4*"" +,-#$&$,-' !"-&$,-"# %C,."
4%." %))%*"-&2/ C""- !"&: &4" %-&$+$)%&"# ,##7)%*$&/ ')$-7&*$)2"&
'()"*+,-#(+&$.$&/ $' -,& $- 9%+& ,C'"*."#IZ:I[0 M,8"."*: &4$' !%&"*$%2
!%/ 9%$2 &, !""& %-,&4"* %-# !,*" '(C&2" +*$&"*$,- -""#"# 9,* ')$-7
&*$)2"& )%$*$-30 Y- )%*&$+(2%*: $&' \J] +*/'&%2 '&*(+&(*" 2%+B' &4"
$-."*'$,- '/!!"&*/ *"F($*"# &, 3(%*%-&"" &4%& "F(%27')$- '&%&"' ,9 ,)),'$&" !,!"-&(! %*" #"3"-"*%&" %-# 4"-+" "99"+&$."2/
+,()2"# C/ !%3-"&$+ $-&"*%+&$,-'0 Y- &4" -"%*2/ !%3-"&$+ !"&%2 5*JT(QX: ".$#"-+" 9,* ')$-7&*$)2"& '()"*+,-#(+&$.$&/ $' !,(-&$-3:
C(& $&' +,--"+&$,- 8$&4 9"**,!%3-"&$+ ')$- '('+")&$C$2$&/ %-# &4"
"."- '&*,-3"* %-&$9"**,!%3-"&$+ ')$- '('+")&$C$2$&/ $-9"**"# 9*,!
-"(&*,-7'+%&&"*$-3 ";)"*$!"-&' 4%' -,& /"& C""- +2%*$D"#INHIG0 Y- T(5*JU#6(JQ='()"*+,-#(+&$.$&/ %-# !%3-"&$'! 8$&4 % 9"**,!%37 -"&$+ +,!),-"-& %))"%* &, +,";$'& %& 2"%'& $- #$99"*"-& 2%/"*' ,9 &4"
2%/"*"# )"*,.'B$&" '&*(+&(*"X]:X<0 M,8"."*: '()"*+,-#(+&$.$&/ $'
&4,(34& &, %*$'" 9*,! ')$-7'$-32"&"78%." )%$*$-3 $- &4" -"%*2/
%-&$9"**,!%3-"&$+ 6(QJ2%/"*': %-# -,& 9*,! ')$-7&*$)2"& )%$*$-3
%'',+$%&"# 8$&4 &4" 9"**,!%3-"&$'! ,9 &4" T(QJ2%/"*'0 ^$-%22/: $-
&4" '/'&"! ,9 -,!$-%2 +,!),'$&$,- _G6,N."*/ 8"%B 9"**,!%3-"&7
$'! %-# ',!" 9,*! ,9 '()"*+,-#(+&$.$&/ !%/ +,";$'&XJ:XI: C(&
+,!)2"; !"&%22(*3$+%2 )*,)"*&$"': '&*,-3 $!)(*$&/ '+%&&"*$-3 %-#
%!C$3($&$"' +,-+"*-$-3 &4" +4%*%+&"* ,9 &4" !%3-"&$+ "2"+&*,-' %-#
&4" '()"*+,-#(+&$-3 +%**$"*' 4%." 4%!)"*"# )*,3*"'' $- (-#"*7 '&%-#$-30 `" -,&" &4%& !"%'(*"!"-&' ,9 &4" 4"%& +%)%+$&/: *"'$#(%2
*"'$'&$.$&/ %-# ())"* +*$&$+%2 D"2# '(33"'& &4%& &4" +%**$"* !"%- 9*""
)%&4 $- _G6,N $' +,-'$#"*%C2/ '!%22"* &4%- &4" '()"*+,-#(+&$-3 +,4"*"-+" 2"-3&40 ?4$' 8,(2# '""! &, )*"+2(#" $- &4$' +%'" &4"
),''$C$2$&/ ,9 ')$-7&*$)2"& !%3-"&$+%22/ !"#$%&"# '()"*+,-#(+&$.$&/0
`" +,-+2(#" &4%& %- (-"F($.,+%2 ";%!)2" ,9 !%3-"&$+%22/
!"#$%&"# '()"*+,-#(+&$.$&/ +,--"+&"# 8$&4 &4" '$!)2"'& +%'" ,9 9"**,!%3-"&$'!: %' ,)),'"# &, &4" !,*" +,!)2"; +%'" ,9 %-&$9"**,7
!%3-"&$'!: $' '&$22 2%+B$-30 M"*" 8" *"),*& &4" *"'(2&' ,9 % '"%*+4 9,*
&4$' B$-# ,9 '()"*+,-#(+&$.$&/ $- &4" 2,87&"!)"*%&(*" !"&%22$+7 9"**,!%3-"& aU"J: 84$+4 %))"%*' &, '%&$'9/ &4" .%*$,(' *"F($*"7
!"-&' !"-&$,-"# %C,." %-# 84$+4 !%/ -,& 4%." &4" #$'%#.%-&%3"' ,9 &4" '/'&"!' #"'+*$C"# &4(' 9%*0 Q(* '&(#/ !%/ %2', &"'& &4"
%2&"*-%&$." !,#"2' ,9 9"**,!%3-"&$'! %-# '()"*+,-#(+&$.$&/ ,9 *"9' XX %-# XZ0
!"#$ %"&#'()*% )# +,'-
aU"J+*/'&%22$b"' +,-3*("-&2/ 9*,! &4" !"2& $-&, %- ,*&4,*4,!C$+
'&*(+&(*" 8$&4 9(22 $-."*'$,- '/!!"&*/X[:XN0 5$-32" +*/'&%2' 3*,8
*"%#$2/ $- &4" '&,$+4$,!"&*$+ '&%&": %-# ')"+$!"-' 8$&4 (-('(%22/
4$34 )(*$&/ +%- C" )*")%*"#0 Y- &4" C"'& +%'"' *"'$#(%2 *"'$'&$.$&$"' %'
!"#$%&'(
)** 1A?aTcdeQV X][d<] AaUa5? J]]]d8880-%&(*"0+,!
0.0 0.1 0.2
0 20 40 60 80 100
µ0M (T) µ0M (T)
Temperature (K)
H/M
300
200
100
0 –0.2
0 0.2
–0.1 0 0.1
B0 (T) 4.5K
U
Ge
.)&/0' 1!"# $%&'#()*%()+' %', )'-#./# $%&'#()0 /1/0#2()3)4)(5 +6 78#9: ;#/14(/ <)' =>
1')(/? %.# /"+@' 6+. % /)'&4# 0.5/(%4 %( %$3)#'( 2.#//1.# %4+'& ("# #%/5 %A)/ )' %' %224)#, B#4, +6 C:D !: E#6( )'/#(F ("# +.("+."+$3)0 1')( 0#44 <("# #%/5 %A)/F +.!G%A)/F )/ %4+'& ("#
"+.)*+'(%4 )' ("# 2%&#?H .)&"( )'/#(F ("# (52)0%4 6+.$ +6 ("# "5/(#.#/)/ 4++2 %( I:J K %4+'& ("#
#%/5 %A)/: !"# /2#0)$#'/ 1/#, 6+. $%&'#()*%()+' %', %:0: /1/0#2()3)4)(5 $#%/1.#$#'(/
<L)&: M? "%-# ,#$%&'#()*)'& 6%0(+./ %4+'& ("# #%/5 %A)/ +6 4#// ("%' C:9:"F $%&'#()*%()+'H
#F $%&'#()0 B#4,H$CF %224)#, $%&'#()0 )',10()+':
0 20 40 60
Pressure (GPa)
Temperature (K)
TC UGe2
10 TSC Ferromagnetism
Superconductivity
0 1 2
.)&/0' -!"# (#$2#.%(1.#N2.#//1.# 2"%/# ,)%&.%$ +6 78#9:%O,#'+(#/ ("# O1.)#
(#$2#.%(1.# %',%=O("# /12#.0+',10()'& (.%'/)()+' (#$2#.%(1.#H ("# 4%((#. )/ ,#(#.$)'#, 6.+$ ("# JCP ,.+2 )' .#/)/()-)(5F %', ("# 6+.$#. 6.+$ ("# 01/2 )' ("# .#/)/()-)(5 +. ("# 2#%Q )' ("# %:0: /1/0#2()3)4)(5 </## 6+. #A%$24#F .#6/ JC %', JM?: <R# '+(# ("%( ("#%=O-%41#/ %.#
/0%4#, 35 % 6%0(+. +6 DC: L+.%O-#./1/ 2.#//1.#F /## %4/+ .#6: IS: !"# ,%/"#, %', /+4), 4)'#/ /#.-# +'45 (+ 0+''#0( ("# ,%(%:?
© 2000 Macmillan Magazines Ltd
図
1.2: UGe2の温度-圧力相図。T
cは強磁 性転移温度、T
scは超伝導転移温度を表す。
1 GPa
以下の低圧力側では強磁性だが、よ
り圧力をかけると超伝導相が出現する。
[4]より転載。
through the positive metamagnetic feedback, leading to an increase ofTscðPÞjust right at the maximum atPx.
The de Haas–van Alphen (dHvA) experiments under pressure reveal that Fermi surfaces between FM2, FM1, and PM are quite different each other. ForHkb-axis, where FM2, FM1 and PM phases are not affected by the magnetic fields, dHvA branches of FM2 phase disappears in FM1 and new branches exhibit in FM2.35,36)In PM phase, completely new branches are observed again. The cyclotron effective mass gradually increases with increasing pressure up toPx and in PM phase quite large effective masses ranging from 20m0to 60m0are detected, in agreement with the pressure dependence of the !-value.28) ForHka-axis, the field re- entrant FM1 and FM2 phases occurs, as shown in Fig. 5, thus the results are more complicated.37,38)Nevertheless, the
drastic change of Fermi surfaces is detected by crossing FM1, FM2 and PM phase boundary. The cyclotron effective mass increases, approaching to Hx. The change of Fermi surface is also found forHkc-axis, as well.39)
An interesting theoretical scenario proposed for the weak itinerant ferromagnet ZrZn2 is the quantum metamagnetic transition associated with the topological change of Fermi surfaces, as proposed for a Lifshitz transition.40)The Fermi surface study under pressure can be found in ref.41. In UGe2, there is an evidence by the combined resistivity and Hall effect measurements32) that the topological change of Fermi surface from PM to FM1 can be tuned by the pressure and field, following the wing-shaped (T ; P; H) phase diagram predicted in ‘‘conventional’’ spin fluctuation approaches of FM-QCEP.
3. URhGe: A Ferromagnetic Superconductor at Ambient Pressure and Field-Reentrant SC
Although the discovery of pressure induced SC in UGe2
can be a major breakthrough, the ambient pressure case provides much variety of experimental methods which goes deep inside the understanding of unconventional SC. The discovery of SC at ambient pressure in the weak ferromagnet URhGe withTsc¼0:26K,TCurie¼9:5K, andM0¼0:4"B opened the new opportunities.14)
The properties of URhGe is summarized in Table I. The crystal structure is orthorhombic TiNiSi-type, as shown in Fig. 1. The U atom forms the zig-zag chain along a-axis with the distance ofdU{U¼3:50A, which is close to the so-! called Hill limit associated with the direct overlap of 5f-wave function.42) Figure 7 shows the !-value and the magnetic ordered temperature as a function of the distance of the next nearest neighbor on U atomdU{Uin UTGe (T:
transition element) family.43) The systematic variation can be seen. The PM ground state is realized for the smalldU{U,
Fig. 5. (Color online) Temperature–pressure–field phase diagram of UGe2forHkM0(a-axis).30,32)
5 4 3 2 1 0 Hc2 (T)
0.5 0.4 0.3 0.2 0.1 0
T (K) UGe2
H // a-axis 1.35 GPa
SC FM1
FM2
Fig. 6. (Color online) Temperature dependence ofHc2forHka-axis in UGe2at 1.35 GPa, which is just abovePx. The metamagnetic transition is detected atHxbetween FM1 and FM2.34)
D. AOKIand J. FLOUQUET
J. Phys. Soc. Jpn.81(2012) 011003 SPECIALTOPICS
011003-4 #2012 The Physical Society of Japan
図
1.3: UGe2の
P = 1.35 GPaにおける、
超伝導臨界磁場
Hc2の温度依存性。磁場は
a軸方向にかかっている。FM1 と
FM2の 境界で
Hc2が大きくなっているのが確認で きる。[3] より転載。
resistivity measurements by using two single crystals. The sample (#1) with two pairs of voltage contacts (#1a and #1b) and the other sample with one pair of voltage contact (#2) are employed. This allows us to compare two sets of data (#1a and #1b) with different residual resistivity in the same crystal without misalignment between sample #1a and sample #1b. The residual resistivity ratios (RRR¼!RT=!0) are 40, 16, and 12, respectively, for sample #1a, #1b, and #2, indicating the high quality single crystals.
3. Results and Discussion
Figure 1 represents the field dependence of the resistivity
!for #1a, #1b, and #2 at 72, 200, and 400 mK. For sample
#1a withRRR¼40, the RSC was clearly observed between H1¼10:7andH2¼14:2T at 72 mK, whereH1andH2are defined as mid points of the drop of resistivity. At high temperature of 400 mK, the resistivity shows the peak at HR¼13:7T, corresponding to the reorientation of the moment. The crystal seems to misalign slightly from the field direction respect to theb-axis, becauseH1,H2, andHR are larger than those in the previous reports.8,9) The purer sample, i.e. higher value of RRR, shows the wider super- conducting windows and the higher transition temperatures.
It is interesting to note that for sample #2, only track of SC is suspected at low field, while rather deeper drop on the resistivity is observed in a very narrow field window. The same trend is observed in sample #1b, where the resistivity shows rather sharp drop due to the RSC, although the step- like behavior is observed near Hc2 for the low field SC.
These observation indicates the strict condition for RSC.
That suggests a strong increase of the coherence length in the RSC phase. On the other hand, the reorientation fieldHR are not sensitive to the sample quality. The insensitivity is also a FM property at zero field.4)It is noted thatH1is more sensitive to the sample quality compared toH2, indicating that the RSC strongly stick toHR.
Figure 2 shows the superconducting phase diagram and reorientation fieldHR. In sample #1a, the upper critical field
Hp¼0:46T estimated fromTscð0Þ ¼0:25K, indicating that Hc2 is determined by the orbital limit depending on the effective mass. The RSC is observed betweenH1¼10:7and H2¼14:2T at 72 mK for sample #1a. It is interesting that TscðHÞfor RSC reaches a temperature of 330 mK at 13.3 T, which is larger than the value of Tscð0Þ ¼250mK at zero field. This peculiar behavior is consistent with the analysis of Tsc by the enhancement of effective mass m$ in Fig. 6 as discussed later. At high temperatures, the reorientation field HR starts to decrease with increasing temperature. Finally, HR seems to be connected to the Curie temperature TCurie¼9:5K at zero field.
Figure 3 represents the variations ofHc2,H1,H2, andHR at 72 mK as a function of!0, which is inversely proportional to the mean free path, i.e., !0/1=l. For unconventional superconductivity like URhGe, theTscmust depend on the variation of the parameter"=lbetween the superconducting coherence length " and l according to the Abrikosov–
Gor’kov pair breaking mechanism,14)wherelmust be larger than the coherence length ". The so-called clean limit condition must be satisfied. Such a dependence has been actually observed in previous studies on polycrystalline samples15) and single crystals.7) The striking point is that the RSC also collapses when the low field SC collapses, moreover, the RSC width!HRSC strongly depends on !0. The suppression of RSC with lower quality samples indicates that RSC as well as low field SC are unconven- tional.
Here we simply estimateTscfor RSC from strength of the parameter "=l. Since the coherence length " is given by the relation,"%h"vF=kBTsc, wherevFis Fermi velocity,"is inversely proportional to m$Tsc. If the "=l is assumed to be invariant against the magnetic field,"=l/1=ðm$lTscÞ/
!0=ðm$TscÞ/!0=ð ffiffiffi
pA
TscÞ must be a constant, we can estimate the extrapolated value at zero field of the critical temperature Tsc0ðm$H
RÞ for fictitious quasiparticles of mass
Fig. 1. (Color online) Field dependences of the resistivity at constant temperatures in sample #1a, #1b, and #2 for the current alonga-axis and the field alongb-axis. The solid, dashed, and dotted lines show the data at 72, 200, and 400 mK, respectively. For sample #2, the data at 830 mK and 1.48 K are displayed as well. The arrows indicate the reorientation field HR.
Fig. 2. (Color online) Temperature–field phase diagram of the low field superconductivity (SC), the re-entrant SC (RSC), and reorientation field HRforHkbin URhGe. The circles display the critical field (temper- ature) of the superconductivities defined as a midpoint of the resistivity drop. The triangles correspond to the reorientation fieldHRdefined as a peak of the!ðHÞcurves. The solid squares are ferromagnetic transition temperatureTCuriecited from ref.16. The dark blue (filled symbol), green (open), and red (half filled) correspond to the results for sample #1a, #1b, and #2, respectively. The lines are guides for eyes.
J. Phys. Soc. Jpn., Vol. 77, No. 9 A. MIYAKEet al.
図
1.4: b軸方向に磁場をかけた場合の
URhGeの温度
(T)-磁場(H)相図。H を大 きくしていくと、H
= 2 Tで一旦超伝導
(SC)が消えた後、11 T から
14 Tの範囲で 再び超伝導が現れる
(RSC)。[12]より転載。
図
1.5: URhGeの絶対零度における磁化曲 線。
b軸方向に磁場をかけた場合、
H = 12 Tでスピンの再配向が起こり、メタ磁性的振 る舞いが見られる。[13] より転載。
5
transition width goes through a clear sharp minimum at≈1.1 GPa. The onset temperature of the superconducting transition does not change with pressure, only T(ρ= 0) changes. Below P = 1.2 GPa T(ρ = 0) corresponds exactly to the TSCdefined as above from susceptibility.
Above this pressure,T(ρ= 0) is slightly lower. Interestingly, above this pressure also a double step behavior develops, which is not seen at low pressures.
Figure 2 shows the pressure-temperature phase diagram established from these and previous measurements. The qualitative behavior of the phase transitions is the same as in reference [7]. The Curie-temperature TCurie decreases linearly with pressure, but the slope is steeper than the one of the previous phase diagram. The superconducting phase is dome-like with the maximum at the pressure where the ferromagnetic transistion line meets the superconducting phase boundary. It extends up to the highest measured pressure.
Figure 2. Pressure-temperature phase diagram of a polycrystalline sample of UCoGe by susceptibility (upward triangles: piston cylinder cell, downward triangles: diamond anvil cell) and resistivity (circles) measurements. The grey circles are from reference [7].
The phase diagram presented here is different to all theoretical predictions, and to the phase diagrams of other ferromagnetic superconductors, namely UGe2, where the superconducting phase lies entirely within the ferromagnetic region and no superconducting phase appears in the paramagnetic (PM) regime. But in UGe2, SC is directly linked to the duality between its two competing ferromagnetic states (FM1 and FM2) [9]. From the presented data however, it is clear that in UCoGe SC appears also in the PM state. An extrapolation ofTCurieto 0 K would give a quantum critical point (QCP) close to 1.6 GPa. Up to now, the real behaviour in the pressure region fromP(TCurie=TSC) up toP(TCurie= 0) is not clear.
Figure 3a represents in the filled area the hypothetical variation of FM in a first order quantum transition (FOQT) [10] neglecting any feedback of SC; the dashed line the hypothetical extrapolation of a second order quantum critical point (QCP). For clarity, the difference between the FOQT and the QCP has been exagerated. In figure 3b is shown the superconducting dome centered near the FOQT (filled area) assuming that the first order nature of FM wipes out the SC minimum at the QCP (dashed line [3; 4]) as experimentally observed. Figure 3c represents what may be the result of the interplay between FM and SC including a feedback between the two phases: In a narrow regime one may go from the PM to the simple SC phase and then to the FM+SC coexisting phase. The situation will be rather similar to the one found in the antiferromagnetic (1,1,5) Ce compound CeRhIn5 under pressure [11; 12]. However, neither resistivity nor susceptibility are sensitive to this transition within the SC phase.
3
図
1.6: UCoGeの温度
(T)-圧力(P)相図。
超伝導相
(SC)はドーム型をしており、
P = 1.2 GPaで最も
Tscが高くなる。[18] より 転載。
Hc2c (Hac2=Hc2c >20) cannot be explained by the anisotropy of the conduction-electron mass.
Low-energy magnetic fluctuations are sensitively probed by 1=T1 measurements. The single crystal was aligned such that external fields were applied within the bcplane, and !is defined as the angle between the applied field and the b axis. We used a split-coil superconducting magnet with a single-axis rotator. NMR spectra for fields along three crystal axes and the locus of NMR peaks when the field is rotated in the ab and bc plane were already shown in the literature [11]. When a nucleus with a spin larger than unity sits at a position where the electric field gradient (EFG) is finite, the nuclear quadrupole interaction splits the NMR spectrum. Since the EFG parameters for the Co site have been determined from the previous 59Co nuclear quadrupole resonance ðNQRÞ=NMR experiments [7,10] (the quadrupole interaction of 2.85 MHz #0:28 T and the direction of the maximum EFG principal axis of 10$ from the a axis in the acplane), we can check! from the quadrupole-split NMR spectrum. The angle-dependent NMR spectra are well-simulated by these EFG parameters [11].
When 1=T1 is measured in an external magnetic field far exceeding the electric quadrupole interaction ("0H % 0:28 T), the direction of the field is regarded as the quantization axis for nuclear spins. In these conditions, the nuclear spins are relaxed by transverse components of local hyperfine-field fluctuations at the nuclear site, which are produced by electron spins. Thus, 1=T1 measured in a field along the#direction is written in terms of fluctuating hyperfine fields along the $ and % directions as
1
T1# / hð&H$Þ2iþhð&H%Þ2i; (1) where the #, $, and % directions are mutually orthogonal.
The angle dependence of 1=T1 is measured at the central peak in each spectrum. The recovery curves RðtÞ ¼ 1(mðtÞ=mð1Þ of the nuclear magnetization mðtÞ, which is the nuclear magnetization at a time t after a saturation pulse, can be fitted by the theoretical function for I ¼ 7=2 with a single component throughout the mea- sured field and temperature range. Thus, the electronic state is considered to be homogeneous in the whole region, and reliable 1=T1 values were obtained.
As shown in Fig. 2(a), 1=T1 along the a and b axes, which is much larger than1=T1 along the c axis due to the Ising-type anisotropy, shows a broad peak around 4 K due to the FM critical fluctuations. That the peak temperature is slightly higher than TCurie is conceivably due to a slight misalignment, since the peak is suppressed and shifts to higher temperatures when the external field is inclined by 3$ away from the baxis. The anisotropy of 1=T1 is largest around the peak temperature and extremely sensitive to the field angle. Figure 2(b) shows the angle dependence of 1=T1 [1=T1ð!Þ] measured at 20, 4.2, and 1.7 K. For mag- netic fields in the bc plane, 1=T1ð!Þ is expressed as
1
T1ð!Þ ¼ 1
T1bcos2!þ 1
T1csin2!: (2) This equation can fully explain the smooth variation at 20 K but not the sharp angle dependence observed at 4.2 and 1.7 K, which shows a cusp centered at ! ¼ 0$. The steep angle dependence of 1=T1 is a characteristic feature of the FM fluctuations at low temperatures.
To further examine this behavior, the angle dependence of 1=T1 was measured at 1.7 K under three different applied fields ("0H % 0:28 T). Although the cusp in 1=T1 versus angle becomes sharper with increasing H, as
-80 -60 -40 -20 0 20 40 60 80 0
2 4 6
1 10 100
100 101 102 103
H // c H // c H // b
(b) 20 K
4.2 K 1.7 K
1/T1 (102 s-1 )
θ (degree) UCoGe
µ0H ∼ 2 T UCoGe 59Co-NMR
µ0H∼ 2 T H // a H // b tilted 3°
from the b axis H // c 1/T1 (s-1 )
T (K)
~TCurie
(a)
FIG. 2 (color online). (a) Temperature dependence of 1=T1 measured in fields along the three crystal axes under #2 T and tilted by 3 degrees from the b axis. The broad peak in 1=T1, ascribed to the FM anomaly, is strongly suppressed when the magnetic field is tilted by 3 degrees. (b) Angle dependence of 1=T1 in thebc plane at 20, 4.2, and 1.7 K under#2 T. The angle dependence at 20 K can be consistently explained by Eq. (2), while these at 4.2 and 1.7 K cannot, indicative of the strong suppression of 1=T1 by Hc.
1 10 100
0 100 200 300 400 500
0 1 2 3 4
0 50
b axis
c axis a axis
TSc TCurie UCoGe
ρ (µΩ cm)
T ( K )
c axis
b axis a axis
T2 ( K2 )
FIG. 1 (color online). Temperature dependence of resistivity along each axis in the single-crystal UCoGe. The inset shows the plot of the resistivity against T2 below 2 K.
PRL 108, 066403 (2012) P H Y S I C A L R E V I E W L E T T E R S week ending 10 FEBRUARY 2012
066403-2
図
1.7: 2 Tにおける
UCoGeにおけるスピ ン緩和時間
T1の角度存性。磁場は
bc平面 内に印加されている。b 軸方向への緩和が 速いことが分かる。[19] より転載。
T (K) 20
15
10
5
0
H (T)
3 2
1 0
T (K)
UCoGe H // b-axis
TCurie
SC Hc2
(b)