2019年度
博士学位論文
Kokusai Kekkon - A Qualitative Research Study on Intercultural Marriages between Chinese and Japanese
日中間国際結婚に関する質的研究
指導教員:宮原 哲 教授
文学研究科英文学専攻コミュニケーション学専修 12DC005 Hongyan Lan (蘭 紅艶)
Table of Contents
Chapter 1. Introduction………....1
Chapter 2. Background Information………...3
1. Kokousai Kekkon in Japan………...15
2. Political, Socioeconomic Backgrounds in Japan……….16
2.1 Economic Backgrounds 2.2 Social Backgrounds 2.2.1 Gender Equality 2.2.2 Increase of Aging Population and Life Span, and Decline of Birth Rate and Marriage Rate 2.3. Political Backgrounds and Governmental Policies 2.3.1 Asian Brides (Hanayome) Filipina Hanayome Chinese Hanayome 2.3.2 Policies of Attracting Skilled Labor and Foreign Students Revised Immigration Control and Refugee Recognition New Amended Immigration Control Act Plan for 100,000 Exchange Students Plan for 300,000 Exchange Students 3. Political, Socioeconomic Backgrounds, and Gender Roles in China……….29
3.1 Economic Backgrounds
3.2 Attitudes towards Studying Abroad 3.3 Gender Roles
Chapter 3. Research Method………..33
1. Research Participants………..33
1.1 Prerequisites of Participants 1.2 Recruiting Procedure 1.3 Interviewing 2. Research Method……….36
2.1 Qualitative Interview & Reasons 2.2 Interview Procedures & Special Consideration 2.3 Coding 3. Why Interviews before Literature Review?...41
Chapter 4. Results ………...44
Initial Coding………44
1. Basic Information………46
2. First Encounters and Impressions………..….48
3. Reasons for Getting Married………...48
4. Attitudes towards Intercultural Marriage………....57
5. Gender Roles………...60
Housework Child raising Child education 6. Work………....67
7. Relationship with in-laws………69
8. Money……….72
9. Naturalization………..75
10. Self-understanding and Identity………..76
11. Other Perceived Differences………...………77
12. Perceptions of Marriage and Future Plans……….…80
Focused Coding………..82
Chapter 5. Marriage………..106
1. Literature Review on Marital Relationship in the West……….106
2. Marital Satisfaction………...…....108
3. Marital Happiness and Marital Well-Being………..109
4. Marital Quality………...114
5. Marital Adjustment………..….116
6. Theories……….117
7. Interethnic/Interracial Marriage in the West………..118
Chapter 6. Cross-cultural Comparisons and Intercultural Marriage in Asia…………..122
1. Cross-cultural Comparisons and Intercultural Marriages in Asia………..122
2. Chinese Culture……….128
3. Japanese Culture………....135
Chapter 7. Conflict, Face and Western Bias ………142
1. Conflict, Conflict Management in Marital Relationship…...……….142
2. Face Negotiation Theory………...152
3. Western Bias………..…159
Chapter 8. Discussion ………..166
Chapter 9. Conclusion………..174
1. Main Findings………..….174
2. Limitations………....175
3. Personal Reflection………...176
4. Future Prospects………....179
References………..180
Acknowledgements………207
Appendix:Quoted Segments in Chinese and English ………...210
1
Chapter 1. Introduction
Marriage is a major stage of life journey to many people. Finding a life partner in the form of marriage can also be seen as an important life goal. Getting married seems to be one of the most beautiful incidents that can happen; however, behind the happy scenes, there are also numerous challenges, some unpredictable, which will later on become the causes of breaking the partners apart. There are many forms of getting bond legally nowadays, some marry those whose cultural background and value system are the same or similar, others marry people who don’t share the same/similar culture at all. Kelly (2012) called marital communication “a labor of love”, a life-long negotiation process that couples have to face trying to balance their expectations and enactment (Bochner et al.,1982).
Globalization and technology development have generated many more opportunities for people of different cultures to meet and brought people much closer than ever before. “As a result of increased interaction among people from different countries, romantic relationships and marriages between culturally diverse individuals are becoming more common (Frame, 2004; Waldman & Rubalcava, 2005).” Marrying someone, especially of a different culture, is no longer a rare phenomenon; rather, it has become more common. Finding a soulmate and walking into marriage “’til death do us apart” can sound very romantic and exciting; however, it is not always “living happily ever after” for the married couples particularly those of intercultural marriages.
This study aims to explore intercultural marriages (Kokusai Kekkon) between Japanese and Chinese residing in Japan and China. Chapter 1 introduces the rationale of the study, why it focused on intercultural marriage, followed by a brief introduction of each chapter. The following chapters in turn provides some background information where intercultural marriage between Japanese and Chinese took place. The research method section explains what criteria were taken into consideration with regard to research participants and research procedure, it
2
also explains why a qualitative research method was employed and the Grounded Theory was utilized. Major findings are summarized and reported in the following chapter.
Based on the findings of the qualitative research study, existing literature on marriage and intercultural marriage are reviewed in chapters 5 and 6; some key concepts such as conflict, face that are common in intercultural marriage and the Western bias are discussed in chapter 7.
Combining the literature review, chapter 8 discusses the major results of the study in comparison to the literature review, similarities and differences with the literature reviewed are examined. In chapter 9 conclusions are made, limitations of the study are discussed, and future prospects are announced.
Quoted segments of interviews in both Mandarin Chinese and English translation are attached in Appendix.
3
Chapter 2. Background Information
Globalization and technology advancement have created numerous opportunities for people of various cultural backgrounds to come into close contact nowadays. As a result, romantic and marital relationships between culturally diverse individuals are becoming more common (Frame, 2004; Waldman & Rubalcava, 2005).
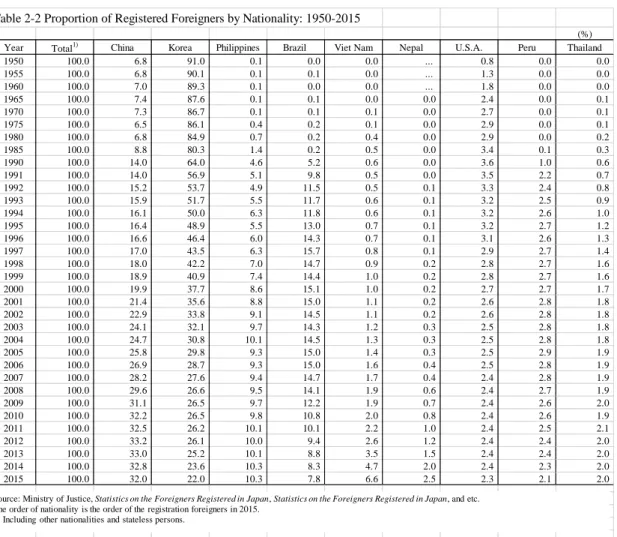
In Japan, for example, the number of foreign residents has been increasing. As the following statistics (Table 2-1, 2-2 & 2-3, Ministry of Justice, Japan, 2017) indicate, in comparison to 1990, the number of foreigners living in Japan in 2015 doubled, among which the majority are from Asian countries with China at the top, followed by Korea and the Philippines. A drastic change can be observed in Table 2-3 on the population of Chinese residents in Japan. 2007 was the turning point in that Chinese residents for the first time became the largest population among all foreign residents, surpassing Koreans who had been dominating over the past few decades. By the year 2015, 714,570 Chinese residents were living in Japan, constituting 32% of all foreign population in Japan.
Table 2-1 Registered Foreigners by Resident Status and Nationality: 1990, 2015
Proportion Proportion
Total Permanent
residents Others (%) Total Permanent
residents Others (%)
1,075,317 643,286 432,031 100.0 2,232,189 1,049,126 1,183,063 100.0
924,560 637,165 287,395 86.0 1,835,811 849,195 986,616 82.2
China 150,339 25,052 125,287 14.0 714,570 248,118 466,452 32.0
India 3,107 460 2,647 0.3 26,244 4,921 21,323 1.2
Indonesia 3,623 135 3,488 0.3 35,910 5,649 30,261 1.6
Korea 687,940 608,799 79,141 64.0 491,711 411,547 80,164 22.0
Malaysia 4,683 113 4,570 0.4 8,738 2,518 6,220 0.4
Philippines 49,092 1,083 48,009 4.6 229,595 120,438 109,157 10.3
Thailand 6,724 157 6,567 0.6 45,379 18,843 26,536 2.0
Viet Nam 6,233 501 5,732 0.6 146,956 13,541 133,415 6.6
25,563 2,353 23,210 2.4 68,179 19,752 48,427 3.1
France 3,166 314 2,852 0.3 10,672 2,212 8,460 0.5
Germany 3,606 472 3,134 0.3 6,336 1,506 4,830 0.3
United Kingdom 10,206 688 9,518 0.9 15,826 5,286 10,540 0.7
44,643 2,579 42,064 4.2 66,064 21,497 44,567 3.0
Canada 4,909 204 4,705 0.5 9,538 3,243 6,295 0.4
U.S.A. 38,364 2,313 36,051 3.6 52,271 16,752 35,519 2.3
71,495 305 71,190 6.6 234,633 150,217 84,416 10.5
Brazil 56,429 164 56,265 5.2 173,437 109,388 64,049 7.8
Peru 10,279 33 10,246 1.0 47,721 33,598 14,123 2.1
9,056 884 8,172 0.8 27,502 8,465 19,037 1.2
Australia 3,975 77 3,898 0.4 9,843 2,589 7,254 0.4
Others Total Asia
North America
South America Nationality
1990 2015
Number Number
Europe
Source: Ministry of Justice, Statistics on the Foreigners Registered in Japan, and etc.
As of the end of December.
4
Table 2-2 Proportion of Registered Foreigners by Nationality: 1950-2015
(%)
Year Total1) China Korea Philippines Brazil Viet Nam Nepal U.S.A. Peru Thailand
1950 100.0 6.8 91.0 0.1 0.0 0.0 ... 0.8 0.0 0.0
1955 100.0 6.8 90.1 0.1 0.1 0.0 ... 1.3 0.0 0.0
1960 100.0 7.0 89.3 0.1 0.0 0.0 ... 1.8 0.0 0.0
1965 100.0 7.4 87.6 0.1 0.1 0.0 0.0 2.4 0.0 0.1
1970 100.0 7.3 86.7 0.1 0.1 0.1 0.0 2.7 0.0 0.1
1975 100.0 6.5 86.1 0.4 0.2 0.1 0.0 2.9 0.0 0.1
1980 100.0 6.8 84.9 0.7 0.2 0.4 0.0 2.9 0.0 0.2
1985 100.0 8.8 80.3 1.4 0.2 0.5 0.0 3.4 0.1 0.3
1990 100.0 14.0 64.0 4.6 5.2 0.6 0.0 3.6 1.0 0.6
1991 100.0 14.0 56.9 5.1 9.8 0.5 0.0 3.5 2.2 0.7
1992 100.0 15.2 53.7 4.9 11.5 0.5 0.1 3.3 2.4 0.8
1993 100.0 15.9 51.7 5.5 11.7 0.6 0.1 3.2 2.5 0.9
1994 100.0 16.1 50.0 6.3 11.8 0.6 0.1 3.2 2.6 1.0
1995 100.0 16.4 48.9 5.5 13.0 0.7 0.1 3.2 2.7 1.2
1996 100.0 16.6 46.4 6.0 14.3 0.7 0.1 3.1 2.6 1.3
1997 100.0 17.0 43.5 6.3 15.7 0.8 0.1 2.9 2.7 1.4
1998 100.0 18.0 42.2 7.0 14.7 0.9 0.2 2.8 2.7 1.6
1999 100.0 18.9 40.9 7.4 14.4 1.0 0.2 2.8 2.7 1.6
2000 100.0 19.9 37.7 8.6 15.1 1.0 0.2 2.7 2.7 1.7
2001 100.0 21.4 35.6 8.8 15.0 1.1 0.2 2.6 2.8 1.8
2002 100.0 22.9 33.8 9.1 14.5 1.1 0.2 2.6 2.8 1.8
2003 100.0 24.1 32.1 9.7 14.3 1.2 0.3 2.5 2.8 1.8
2004 100.0 24.7 30.8 10.1 14.5 1.3 0.3 2.5 2.8 1.8
2005 100.0 25.8 29.8 9.3 15.0 1.4 0.3 2.5 2.9 1.9
2006 100.0 26.9 28.7 9.3 15.0 1.6 0.4 2.5 2.8 1.9
2007 100.0 28.2 27.6 9.4 14.7 1.7 0.4 2.4 2.8 1.9
2008 100.0 29.6 26.6 9.5 14.1 1.9 0.6 2.4 2.7 1.9
2009 100.0 31.1 26.5 9.7 12.2 1.9 0.7 2.4 2.6 2.0
2010 100.0 32.2 26.5 9.8 10.8 2.0 0.8 2.4 2.6 1.9
2011 100.0 32.5 26.2 10.1 10.1 2.2 1.0 2.4 2.5 2.1
2012 100.0 33.2 26.1 10.0 9.4 2.6 1.2 2.4 2.4 2.0
2013 100.0 33.0 25.2 10.1 8.8 3.5 1.5 2.4 2.4 2.0
2014 100.0 32.8 23.6 10.3 8.3 4.7 2.0 2.4 2.3 2.0
2015 100.0 32.0 22.0 10.3 7.8 6.6 2.5 2.3 2.1 2.0
Source: Ministry of Justice, Statistics on the Foreigners Registered in Japan, Statistics on the Foreigners Registered in Japan, and etc.
The order of nationality is the order of the registration foreigners in 2015.
1) Including other nationalities and stateless persons.
5 Table 2-3 Registered Foreigners by Nationality: 1950-2015
Year Total1) China Korea Philippines Brazil Viet Nam Nepal U.S.A. Peru Thailand
1950 598,696 40,481 544,903 367 169 25 ... 4,962 178 73
1955 641,482 43,865 577,682 435 361 48 ... 8,566 53 150
1960 650,566 45,535 581,257 390 240 57 ... 11,594 40 266
1961 640,395 46,326 567,452 444 222 67 5 13,154 46 317
1962 645,043 47,096 569,360 495 231 89 2 13,943 61 433
1963 651,574 47,827 573,284 494 263 100 2 15,226 70 512
1964 659,789 49,174 578,545 497 306 129 12 15,626 71 600
1965 665,989 49,418 583,537 539 366 169 12 15,915 88 704
1966 668,318 49,387 585,278 520 388 192 16 16,217 93 707
1967 676,144 49,592 591,345 539 498 243 12 17,090 108 709
1968 685,075 50,445 598,076 632 646 330 20 17,286 124 674
1969 697,504 50,816 607,315 758 748 381 26 18,198 117 723
1970 708,458 51,481 614,202 932 891 557 42 19,045 134 721
1971 718,795 52,333 622,690 863 1,075 773 39 19,199 143 769
1972 735,371 48,089 629,809 2,250 1,255 1,015 34 21,285 219 798
1973 738,410 46,642 636,346 2,424 1,279 1,073 35 21,614 228 930
1974 745,565 47,677 643,096 2,758 1,395 1,073 42 21,441 292 967
1975 751,842 48,728 647,156 3,035 1,418 1,041 51 21,976 308 1,046
1976 753,924 47,174 651,348 3,083 1,319 1,039 64 21,222 308 1,022
1977 762,050 47,862 656,233 3,600 1,279 1,425 66 21,390 308 1,087
1978 766,894 48,528 659,025 4,281 1,279 1,516 81 21,396 306 1,136
1979 774,505 50,353 662,561 4,757 1,393 2,126 99 21,651 331 1,195
1980 782,910 52,896 664,536 5,547 1,492 2,742 108 22,401 348 1,276
1981 792,946 55,616 667,325 6,729 1,652 2,842 128 23,266 376 1,671
1982 802,477 59,122 669,854 6,563 1,643 3,132 138 24,825 399 1,974
1983 817,129 63,164 674,581 7,516 1,796 3,472 157 26,434 432 2,233
1984 841,831 69,608 680,706 11,183 1,986 3,993 202 29,037 466 2,758
1985 850,612 74,924 683,313 12,261 1,955 4,126 208 29,044 480 2,642
1986 867,237 84,397 677,959 18,897 2,135 4,388 248 30,695 553 2,981
1987 884,025 95,477 673,787 25,017 2,250 4,381 300 30,836 615 3,817
1988 941,005 129,269 677,140 32,185 4,159 4,763 380 32,766 864 5,277
1989 984,455 137,499 681,838 38,925 14,528 6,316 399 34,900 4,121 5,542
1990 1,075,317 150,339 687,940 49,092 56,429 6,233 447 38,364 10,279 6,724
1991 1,218,891 171,071 693,050 61,837 119,333 6,410 565 42,498 26,281 8,912
1992 1,281,644 195,334 688,144 62,218 147,803 6,883 676 42,482 31,051 10,460
1993 1,320,748 210,138 682,276 73,057 154,650 7,609 825 42,639 33,169 11,765
1994 1,354,011 218,585 676,793 85,968 159,619 8,229 1,056 43,320 35,382 13,997
1995 1,362,371 222,991 666,376 74,297 176,440 9,099 1,314 43,198 36,269 16,035
1996 1,415,136 234,264 657,159 84,509 201,795 10,228 1,671 44,168 37,099 18,187
1997 1,482,707 252,164 645,373 93,265 233,254 11,897 2,173 43,690 40,394 20,669
1998 1,512,116 272,230 638,828 105,308 222,217 13,505 2,836 42,774 41,317 23,562
1999 1,556,113 294,201 636,548 115,685 224,299 14,898 3,212 42,802 42,773 25,253
2000 1,686,444 335,575 635,269 144,871 254,394 16,908 3,649 44,856 46,171 29,289
2001 1,778,462 381,225 632,405 156,667 265,962 19,140 4,081 46,244 50,052 31,685
2002 1,851,758 424,282 625,422 169,359 268,332 21,050 4,593 47,970 51,772 33,736
2003 1,915,030 462,396 613,791 185,237 274,700 23,853 5,181 47,836 53,649 34,825
2004 1,973,747 487,570 607,419 199,394 286,557 26,018 5,929 48,844 55,750 36,347
2005 2,011,555 519,561 598,687 187,261 302,080 28,932 6,953 49,390 57,728 37,703
2006 2,084,919 560,741 598,219 193,488 312,979 32,485 7,844 51,321 58,721 39,618
2007 2,152,973 606,889 593,489 202,592 316,967 36,860 9,384 51,851 59,696 41,384
2008 2,217,426 655,377 589,239 210,617 312,582 41,136 12,286 52,683 59,723 42,609 2009 2,186,121 680,518 578,495 211,716 267,456 41,000 15,255 52,149 57,464 42,686 2010 2,134,151 687,156 565,989 210,181 230,552 41,781 17,525 50,667 54,636 41,279 2011 2,078,508 674,879 545,401 209,376 210,032 44,690 20,383 49,815 52,843 42,750 2012 2,033,656 675,370 530,048 202,985 190,609 52,367 24,071 48,361 49,255 40,133 2013 2,066,445 682,402 519,740 209,183 181,317 72,256 31,537 49,981 48,598 41,208 2014 2,121,831 694,974 501,230 217,585 175,410 99,865 42,346 51,256 47,978 43,081 2015 2,232,189 714,570 491,711 229,595 173,437 146,956 54,775 52,271 47,721 45,379 Source: Ministry of Justice, Statistics on the Foreigners Registered in Japan, Statistics on the Foreigners Registered in Japan, and etc.
The order of nationality is the order of the registration foreigners in 2015.
1) Including other nationalities and stateless persons.
6
Similarly, the number of intercultural marriages between Japanese and foreigners has also been increasing. As it can be observed from Figure 2-4, since 1990 the number of intercultural marriages between Japanese nationals and foreign wives had been steadily increasing until the beginning of the twenty-first century. As a clear contrast, the number of foreign brides and Japanese grooms is much more than the number of foreign grooms and Japanese brides. A sharp decline can be observed in 2005 between Japanese husbands and foreign wives. This result was possibly affected by the Japanese Government’s Amendment to the Immigration Control Act in 2005 (Nippon.com, 2018), which aimed to reduce and prevent fake intercultural marriage for the purpose of entering Japan. The impact of this policy was reflected in the decrease of number of intercultural marriages between Japanese husbands and foreign wives in the following years, particularly Filipina and Chinese wives who were called hanayome (Figure 2-7).
Figure 2-5 by the Ministry of Health, Labor, and Welfare, Japan (2018) indicates the changes of marriages between Japanese grooms and foreign brides by nationalities of brides in 1995 and 2015, with the number of Chinese wives increasing the most among all. The 2016 Vital Statistics on nationality of foreign wives and foreign husbands by the Ministry of health, Labor, and Welfare, Japan revealed a similar result that Chinese wives constituted the majority, followed by wives from the Philippines, and Korea (Figure 2-6, Figure 2-7). As it shows in Table 2-7, the number of Japanese husbands married foreign wives is much more than the number of Japanese wives and foreign husbands. For example, in the year 2005, there were 33,116 marriages between Japanese husbands and foreign wives, which was about four times of the number of Japanese wives and foreign husbands. Among the marriage of Japanese husbands and foreign wives, Chinese wives have obviously been the majority since 2000.
7
Figure 2-4 Annual trend of marriages between Japanese and foreign citizens between 1965 and 2015 ( Ministry of Health, Labor and Welfare, Japan, 2018 )
Figure 2-5 Percentages of marriages between Japanese grooms and foreign brides by nationalities of brides in 1995 and 2015
Figure 2-6 Nationality of Foreign Wives and Husbands
8
9
Showa 60
(1985)
Heisei 7
(1995)
Heisei 12
(2000)
Heisei 17
(2005)
Heisei 22
(2010)
Heisei 27
(2015)
Heisei 28
(2016)
735 850 791 888 798 138 714 265 700 214 635 156 620 531 723 669 764 161 761 875 672 784 670 007 614 180 599 351 12 181 27 727 36 263 41 481 30 207 20 976 21 180 7 738 20 787 28 326 33 116 22 843 14 809 14 851
4 443 6 940 7 937 8 365 7 364 6 167 6 329
7 738 20 787 28 326 33 116 22 843 14 809 14 851
Korea 3 622 4 521 6 214 6 066 3 664 2 268 2 031
China 1 766 5 174 9 884 11 644 10 162 5 730 5 526
Philippines … 7 188 7 519 10 242 5 212 3 070 3 371
Thailand … 1 915 2 137 1 637 1 096 938 970
USA 254 198 202 177 223 199 246
United
Kingdom … 82 76 59 51 44 55
Brazil … 579 357 311 247 277 216
Peru … 140 145 121 90 83 87
Other countries 2 096 990 1 792 2 859 2 098 2 200 2 349
4 443 6 940 7 937 8 365 7 364 6 167 6 329
Korea 2 525 2 842 2 509 2 087 1 982 1 566 1 627
China 380 769 878 1 015 910 748 790
Philippines … 52 109 187 138 167 151
Thailand … 19 67 60 38 36 32
USA 876 1 303 1 483 1 551 1 329 1 127 1 059
United
Kingdom … 213 249 343 316 235 248
Brazil … 162 279 261 270 344 315
Peru … 66 124 123 100 115 95
Other countries 662 1 514 2 239 2 738 2 281 1 829 2 012
Director-General for Statistics and Information Policy, MHLW "Vital Statistics 2016"
Table 2-7 Number of marriages by nationality of husband and wife , by year
People with the nationality of the Philippines, Thailand, the United Kingdom, Brazil and Peru has been counted separately since 1992, therefore, they are included in the "other countries" until 1991.
Note:
Source:
Nationality of husband Husband: Japan/
wife: not Japan
Wife: Japan/
husband: not Japan Nationality of wife Nationality
Total
Husband and wife:
Japan
Either of husband and wife: not Japan
Husband: Japan/
wife: not Japan Wife: Japan/
husband: not Japan
10 Heisei 7
(1995)
Heisei 12
(2000)
Heisei 17
(2005)
Heisei 22
(2010)
Heisei 25
(2013)
Heisei 26
(2014)
Heisei 27
(2015)
Heisei 28
(2016)
199 016 264 246 261 917 251 378 231 383 222 107 226 215 216 798 191 024 251 879 246 228 232 410 216 187 207 972 212 540 203 853 7 992 12 367 15 689 18 968 15 196 14 135 13 675 12 945 6 153 9 607 12 430 15 258 11 887 10 930 10 440 9 782 1 839 2 760 3 259 3 710 3 309 3 205 3 235 3 163
6 153 9 607 12 430 15 258 11 887 10 930 10 440 9 782
Korea 2 582 2 555 2 555 2 560 1 724 1 619 1 450 1 313
China 1 486 2 918 4 363 5 762 4 573 4 093 3 884 3 602
Philippines 1 456 2 816 3 485 4 630 3 547 3 245 3 200 2 989
Thailand 315 612 782 743 649 603 563 525
USA 53 68 76 74 63 73 67 58
United Kingdom 25 41 28 23 21 22 19 17
Brazil 47 92 116 103 93 101 79 89
Peru 15 40 59 59 38 29 37 39
Other countries 174 465 966 1 304 1 179 1 145 1 141 1 150
1 839 2 760 3 259 3 710 3 309 3 205 3 235 3 163
Korea 939 1 113 971 977 747 791 791 747
China 198 369 492 632 568 582 488 471
Philippines 43 66 86 119 109 106 127 143
Thailand 8 19 30 45 32 37 36 39
USA 299 385 398 397 384 356 390 382
United Kingdom 40 58 86 77 71 60 84 80
Brazil 20 59 81 140 133 130 142 107
Peru 7 41 68 70 73 62 55 47
Other countries 285 650 1 047 1 253 1 192 1 081 1 122 1 147
Source: Director-General for Statistics and Information Policy, MHLW "Vital Statistics 2016"
Nationality of husband Nationality
Husband: Japan/
wife: not Japan Wife: Japan/
husband: not Japan
Husband: Japan/
wife: not Japan
Wife: Japan/
husband: not Japan Nationality of wife Either of husband and wife: not Japan Total
Husband and wife:
Japan
Table 2-8 Number of divorces by nationality of husband and wife, by year
11
However, in clear contrast to the increase of intercultural marriages in Japan, the statistics showed that the divorce rate was surprisingly high. From Table 2-7 number of marriages by nationality of husband and wife and Table 2-8 number of divorces by nationality of husband and wife by the Japanese Ministry of Health, Labor, and Welfare (2016), it is clear that the divorce rate has risen, particularly the number of divorces between foreign wives and Japanese husbands. For example, in 2000 in comparison to 28,326 couples of Japanese husbands and foreign wives who got married, there were 9,607 couples of Japanese husbands and foreign wives divorced. The number of divorce continued to increase in 2010 although the number of intercultural marriages between Japanese husbands and foreign wives dropped. In 2010, there were 22,843 intercultural marriages between Japanese husbands and foreign wives; however, there were 15,258 divorces reported. Although the number of marriages between Japanese husbands and foreign wives didn’t reveal a significant change, the number of divorce was much higher than 2000. This situation lasted, take 2015 and 2016 for example, approximately 14,800 Japanese husbands and foreign wives married; however, the divorce rate was very high in comparison to the total number of intercultural marriages with either foreign husband or wife.
All of the above indicated an extremely high divorce rate of intercultural couples. While the intercultural marriages between Japanese and foreigners had gone up and down, the divorce rate had remained high; this is especially true between Chinese wives and Japanese husbands.
What caused the high percentage of divorce? What happened between the couples that made them decide to terminate their marital relationship by divorce? And why did they marry?
What does divorce mean to them? These questions remain unanswered. It is true that getting married to someone of a different culture poses numerous challenges which may be unpredictable; however, deciding to end a marital relationship requires the couple to have much more courage and face much more serious and real challenges. If they knew that they would end up with divorce, would they even have wanted to get married in the first place? Although
12
both Chinese and Japanese cultures are perceived by the West as collectivistic and high-context cultures, trivial but subtle similarities and differences which shape people’s perspectives and behaviors have not been thoroughly and systematically examined.
This study sets its focus on intercultural marriages between Chinese wives and Japanese husbands. The first and foremost reason for this lies in the researcher’s personal experience. As a Chinese who has lived in Japan for more than seventeen years and been married to a Japanese for more than fourteen years, my marital life has not always been a happy- ever-after one. There were countless times that new unpredictable challenges had to be faced and managed, sometimes with struggles between maintaining self-identity and coping with the Japanese culture. It has been a process accompanied with feelings of helplessness, frustration, confusion and desperation. In Japanese culture there is this saying of “go ni itte ha go ni shitagae” which was originally borrowed from the Chinese idiom “rù xiāng suí sú”, literally meaning the same as in English “when in Rome, do as the Romans do.” Comparing to the Chinese ideology, this way of thinking is more solidly rooted in Japanese culture, and foreigners are expected to assimilate to Japanese culture without many other options. A foreigner needs not only to learn the language but also adapt to the social norms. This assimilation to the host culture may reduce much more unpredictable problems than resisting; however, it takes a great deal of energy and effort, especially for those whose cultures and cultural norms are very different. As a person from a commonly viewed collectivistic culture by the West, moving from one collectivistic culture (China) to another (Japan), I was neither supposed to nor ready to go through too many differences but enjoy the similarities and find life a lot easier in Japan. However, it didn’t happen like that. I found myself very often lost in trying to interpret new situations and constantly struggle to manage the unpredictable and hard-to-understand situations and human relationships, all of which required energy and great effort, but ended with very little reward.
In the first few years in Japan, I had tried really hard to adapt myself to my perceived Japanese
13
culture, doing what I thought was expected, and forcing myself to behave in similar ways to Japanese people around me. After a few years I came to realize that however hard I tried, I could never reach the standard and get well recognized. The norms and expectations are simply too different from the ones I know in China. Although I had tried so hard and did my best, I was never appreciated and acknowledged by people around me, especially my husband’s family members such as his parents. I remember once my father-in-law asked me to clean up the house and I said I couldn’t because it was already too much: my study, my part-time job, not to mention I had a baby son to take care of. Guess what he said, “the monk’s wife has three, and she never complains!” Since I live in the countryside and there is a temple nearby where the monk’s wife lives with her three children. Most of the time her husband was away because he is a monk and spends most of his time taking training somewhere else. So this wife does everything including taking care of all the children. Wow! What a supermom! I thought, though I couldn’t help saluting her, I also wondered what is the meaning of a family? What is the role of the father? So many questions just popped in my head and I told myself, “you are not a slave, this is not the kind of family you are looking for.” Not to mention that before I came to Japan I was a career woman and I hardly did any housework. Even if I got married in China and had a child, my parents would try their best to help me instead of asking me to do housework for them.
So after a few years’ of trying, when I finally got confused, completely exhausted, and even started to question myself who and what I was, I quit making any effort of trying for the sake of rescuing myself and my preferred identity.
All these years the confusion has been there, and although I quit making effort to conform, the question mark still remains. Hence by focusing on intercultural marriages between Chinese wives and Japanese husbands I am personally hoping to clarify my doubt and find answers to my questions. Being one of the thousands of Chinese women who married Japanese, I am very curious and interested to find out the answers to the questions such as, how do other Chinese
14
wives manage their intercultural marriage? Am I one of them? What challenges have they faced? How did they manage them? I would like to go beyond my personal experience, and get into other Chinese wives’ lives, explore their reality of intercultural marriage to their Japanese husbands. I am especially interested in finding out how the Chinese wives view their marriage and handle the challenges and conflicts that may be caused/influenced by their cultural differences in their marriage. So the above personal experiences and backgrounds serve as my motive and starting point of this study.
Another reason that Chinese wives are the focus of this study lies in the fact that Chinese wives have been the majority of intercultural marriages in Japan since 2000, as Figure 2-5, 2- 6, 2-7 indicated. There were many more Chinese women married Japanese men than the opposite in the past twenty years. Meanwhile, it was also Chinese who are the majority of divorces, as it can be observed in Figure 2-8. This will no doubt trigger us to wonder why this happened, what caused this high ratio of divorce, are China and Japan very similar or different?
What made the couples decide to marry? And again what caused them to divorce? Are there more similarities or differences? Do they hold the same or similar expectations toward marriage and gender roles? These questions have not yet been thoroughly and sufficiently discussed and examined in the field of communication. Exploring similarities and differences of both cultures in the context of intercultural marriage will also provide more insights in better understanding Japanese and Chinese cultures. Therefore, this study will mainly focus on Chinese wives who have gone through dramatic political, socioeconomic changes during the past few decades and who may hold varied expectations and perspectives regarding marriage and gender roles, which in turn may connect to some explanations of the high divorce rate in intercultural marriages between Japanese and Chinese.
To get a more complete and thorough understanding the method of interview will be used in this study. Interviews are the most effective way of obtaining data for certain researcher
15
questions, and the research questions drive the method(s) of collecting data (Charmaz, 2014, p.
79). Therefore, the following semi-structured open-questions serve as the guidelines of the interviews; however, they were discussed in varied sequence in corresponding the natural flow of the dialogues between the interviewer and the interviewees. Although conversational, the interviewer did keep these questions in mind, and sometimes asked the interviewees to clarify, to explain further, how they felt and thought, and how they coped with situations. Just as Charmaz concluded, in intensive interviews the interviewer has the privilege of learning about the research participant’s life.
1. What is the current state of intercultural marriage between Chinese wives and their Japanese husbands, as perceived by the Chinese wives?
2. What are the challenges or conflicts perceived by the Chinese wives?
3. How do the couples manage the challenges, and what are the effects, as perceived by the Chinese wives?
Given the above situation of intercultural marriage in Japan, the political, social and economic backgrounds should be examined.
1. Kokusai Kekkon in Japan
Intercultural marriage, in Japanese, kokusai kekkon is used to describe marriages between Japanese nationals and foreigners of other nationalities. As Nitta (1988) explained, “kokusai kekkon (literally, international marriage) is the Japanese cultural category commonly used to designate any marriage pairing Japanese and non-Japanese nationals.” He classified marriages into three categories: the first is between Japanese and Americans as international; second to be
“interethnic” (or “interracial”) marriages in which the technically non-Japanese partner is a Korean or Chinese born and raised in Japan but without Japanese nationality (or citizenship);
the last refers to marriages with non-Japanese partner that are gaikokujin (foreign) wife or
16
husband even if he or she is a Korean or Chinese resident who has lived in Japan. Nitta argued that kokusai kekkon “overemphasizes the international nature” possibly linked to the “common perception that Japan is the most homogeneous society comprising one race which speaks one language”, whereas in heterogeneous cultures such as the United States or China the term
“intercultural marriage” is generally used in the intermarriage literature when referring to marriage between spouses of different cultural backgrounds (Maretzki, 1977). In this study
“intercultural marriage” will be used as it “emphasizes the cultural backgrounds instead of nationalities” (Nitta, 1988).
2. Political, and Socioeconomic Backgrounds of Kokusai Kekkon in Japan 2.1 Economic Backgrounds
The postwar Japanese economy had experienced rapid economic growth between the late 1950s and early 1970s. Since 1960, when trade was liberalized, Japan’s major exports have been manufactured goods such as automobiles, and electronic goods. By 1968, the Japanese gross national product was ranked number two after the U.S. According to Chiavacci and Lechevalier (2017), this period was characterized by common perceptions of stability and security as the top priorities: high educational attainments were directly related to stable employment and internal careers in the cooperative and protective community of the employer.
Strongly differentiated gender roles were also observed with men being the breadwinner and lifetime employed salaryman (salariman), and women as education mothers (kyoiku mama).
During the mid-1980s to 1990s, the Japanese economy experienced the bubble economy which was characterized by inflation. However, after 2000, deflation has been a problem that Japanese economy faced. The Japanese Prime Minister Shinzo Abe at that time proposed a set of policies, namely “Abenomics”, in the hope of stimulating economic growth and improving the long deflation. It is widely believed that with these policies the Japanese economy has been gradually
17
recovering, and as the Japanese yen depreciates, which was another goal, foreign people can purchase Japanese products at lower prices, so demand for Japanese products increases (Takayama, 2017).
2.2 Social Backgrounds 2.2.1 Gender Equality
In accordance with the economic development after World War II, the Japanese government has been integrating a few policies to improve the gender equality in Japan. In 1947 the Fundamental Law of Education enacted for Japanese women the equality of educational opportunities at all levels. In the same year, the Labor Standards Law came into effect, ensuring equal treatments for women in the workplace and equal pay for equal work. The new Japanese Constitution, based on democratic ideals of equality and respect for individual human rights, finally granted political rights to women, freeing women from the ie system which required women to be filial and obedient to her husband’s family, a system that prevented them from enjoying their equality within marriage and in the home, and guaranteed equality of educational opportunity for women in Japan (Hara, 1995; Kaneko, 1995).
The Japanese government continued to promote gender equality in Japan. In 1986, the passage of the Equal Employment Opportunity Law (EEOL), called for equal pay and other improvements in hiring and working conditions. More gender equity plans were issued in the following years, for example, the Gender Equality Bureau, a Cabinet level council created in 1994, produced a Basic Plan for Gender Equality in 1999. All these promotions have served as a better platform for Japanese women’s equality. As Fujimura-Fanselow (1995) observed, today it is both a common and socially accepted practice for women to work following college graduation. However, there are a few categories with regard to the purposes of receiving college education. Some view a job as a temporary activity in which they can gain some social
18
experience and meanwhile earn their own money before they marry; some see themselves as independent individuals financially who do not like being supported by their husbands or family; another type of women is called the “self-actualization” type, women who see work as a path to their self-fulfillment.
Although more and more women wish to work despite their various purposes, getting married and having children have still remained as the norm in Japanese society. Despite the enactment of the Child Care Leave Law in 1991 which aimed to encourage both parents to take child care leave, it is usually the mother who takes it. For many of the women who work, they have to constantly juggle between their work and family as well as child care. Lindsey (2011) pointed out that married women know that their roles as wife and mother will limit employment opportunities, but the issue is almost always resolved in favor of home over workplace.
Motherhood remains the essence of a woman’s social and personal identity. A woman’s role is ranked as mother first and wife second. Though women represent half the workforce, employed women in Japan are constrained by restrictive, stereotyped gender roles. Even if they re-enter the labor force after bringing up the children, they are more like to be concentrated in part-time or temporary employment and take lower-level jobs not commensurate with their education (p.
155). Lindsey further argued that as part of a common global pattern in which a lower fertility rate, especially for highly educated women, is associated with higher labor force participation, Japan has also faced the challenges of low birth rate and declining number of children.
Meanwhile, the traditional salarymen are fast disappearing, replaced by men eager to live a fuller life outside the confines of conventional jobs and conventional marriages (p. 156). This may explain the decrease in number of marriages in Japan, which can be observed in Table 2-7 that marriages of Japanese husband and wife has kept decreasing, whereas intercultural marriages between Japanese nationals and foreigners had been increasing until it reached the peak in year 2005.