Influence of outliers on analogy based software development effort estimation
7
0
0
全文
(2) Influence of Outliers on Analogy Based Software Development Effort Estimation Kenichi Ono. Masateru Tsunoda. Graduate School of Information Science Nara Institute of Science and Technology Nara, Japan [email protected]. Department of Informatics Kindai University Osaka, Japan [email protected]. Akito Monden. Kenichi Matsumoto. Graduate School of Natural Science and Technology Okayama University Okayama, Japan [email protected]. Graduate School of Information Science Nara Institute of Science and Technology Nara, Japan [email protected]. Abstract—In a software development project, project management is indispensable, and effort estimation is one of the important factors on the management. To improve estimation accuracy, outliers are often removed from dataset used for estimation. However, the influence of the outliers to the estimation accuracy is not clear. In this study, we added outliers to dataset experimentally, to analyze the influence. In the analysis, we changed the percentage of outliers, the extent of outliers, variable including outliers, and location of outliers on the dataset. After that, effort was estimated using the dataset. In the experiment, the influence of outliers was not very large, when they were included in the software size metric, the percentage of outliers was 10%, and the extent of outliers was 100%. Keywords—case based reasoning; effort prediction; abnormal value. I. INTRODUCTION To achieve success of software development project, it is important to estimate development effort accurately, and therefore many quantitative estimation methods have been proposed [1][11][16]. Recently, analogy based estimation [15] gets attention, and many proposals and case studies have been reported [4][5][8][18][19]. Analogy based estimation selects projects (neighborhood projects) which are similar to the estimated project from past project dataset, and estimates effort based on similar projects’ effort. One of the advantages of analogy based estimation is that estimation results are comprehensible for estimators such as project managers [19], because they can confirm neighborhood projects used for estimation. Although ordinary estimation models like linear regression model estimate various target projects’ effort by one model, analogy based estimation does not make such a model, and estimates effort by neighborhood projects’ effort. So analogy based estimation can reflect individuality of each target project in estimation.. In past project datasets, there are some data points whose data such as effort and software size (i.e., function point) are very different from other data point. They are called as outliers. Outliers occurred for some reasons. For instance, when, exceptional amount of reworks occurred in a project, it has larger effort than other projects. Also, when effort was inaccurately collected or recorded, recorded effort is different from actual effort. Function point (FP) is often measured on early phase of a project. If many functions are added after the measurement, recorded FP is different from actual FP. The outliers may affect estimation accuracy. To avoid the influence of the outliers, mathematical outlier elimination method is sometimes applied. Outlier deletion methods identify projects as outliers when specific variables’ values are extremely large or combination of variants’ values (effort, system size, or duration) is fairly different from other projects’ one, and remove them from dataset. Cook’s distance is widely used as outlier deletion method when applying linear regression analysis. In addition to Cook’s distance, some outlier deletion methods for effort estimation [13] have been proposed. Also, outliers are sometimes eliminated manually. In this study, we focus on the influence of the outliers. Although there are many studies which evaluate outlier elimination methods [12][13], it is not clear the influence of outliers. That is, the relationship between estimation accuracy and amount and extent of outliers is not clear. That will be helpful to consider how careful to collect projects’ data. To analyze the relationship, we experimentally add outliers to the dataset. Concretely speaking, we change values of dependent variable, i.e., effort, and values of the most important independent variable, i.e., function point. In the experiment, we change the following parameters to analyze the influence to estimation accuracy. The percentage of outliers The extent of outliers.
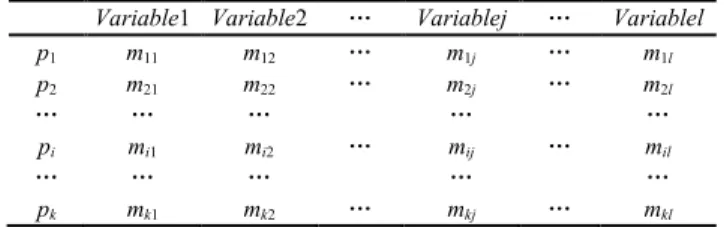
(3) The percentage of outliers means that when it is set as 10%, we make 10 of 100 data points outliers, for instance. The extent of outliers means that when it is set as 100%, we change 100 person-hours of effort to 200 person-hours in a data point. Additionally, we consider where outliers are included in a dataset. We assumed that outliers are included in the following pattern, when effort is estimated. Past project data: including outliers, estimation target data: no outliers Past project data: including outliers, estimation target data: including outliers Past project data: no outliers, estimation target data: including outliers Outliers may be included in estimation target data (test data), not only past project data (learning data). Generally, it is not easy to eliminate outliers in estimation target data, and therefore the influence of them are not evaluated in past studies. However, when an estimation model is used in the field, they should be considered. Since evaluation of estimation accuracy without considering them may be overvaluing. Our analysis also helps considering estimation accuracy of models in the field. II. ANALOGY BASED ESTIMATION The origin of analogy based estimation is CBR (case based reasoning), which is studied in artificial intelligence field. Shepperd et al. [15] applied CBR to software development effort estimation. CBR selects a case similar to current issue from accumulated past cases, and applies solution of the case to the issue. CBR assumes similar issues can be solved by similar solution. Analogy based estimation assumes neighborhood (similar) projects (For example, development size and used programming language is similar) have similar effort, and estimates effort based on neighborhood projects’ effort. Although ready-made estimation models such as COCOMO [1] can make estimation without stored software project dataset, analogy based estimation cannot estimate without it. It is a weak point of analogy based estimation, but it can be overcome by using public dataset. Analogy based estimation uses k × l matrix shown in Table I. In the matrix, pi is i-th project, mij is j-th variable. That is, each row denotes a data point (i.e., a project), and each columns denotes a metric. We presume pa is estimation target project, and m ˆ ab is the estimated value of mab. Procedures of analogy based estimation consist of the three steps described below. Step 1: Since each variable has different range of value, this step makes the ranges [0, 1]. The value m´ij, normalized the value of mij is calculated by: m' ij . mij min m j . maxm j min m j . (1). In the equation, max(mj) and min(mj) denote the maximum and minimum value of mj respectively. The equation is one of. TABLE I. p1 p2 … pi … pk. DATASET USED ON ANALOGY BASED EFFORT ESTIMATION. Variable1 Variable2 m11 m12 m21 m22 … … mi1 mi2 … … mk1 mk2. Variablej m1j m2j … mij … mkj. … … … … …. Variablel m1l m2l … mil … mkl. … … … … …. the commonly used methods to normalize the range of a value [17]. Step 2: To find projects which are similar to estimated project pa (i.e., identifying neighborhood projects), similarity between pa and other projects pi is calculated. Variables of pa and pi are used as elements of vectors, and cosine of the vectors are regarded as similarity. Similarity sim(pa, pi) between pa and pi is calculated by: sim pa , pi . (2) m' avg m' m' avg m' m' avg m' m' avg m' j M a M i. j M a M i. aj. aj. j. j. ij. j M a M i. j. ij. j. In the equation, Ma and Mi are set of variables measured in project pa and pi respectively. avg(m´, j) is average of i-th variable. The range of sim(pa, pi) is [-1, 1]. Step 3: The estimated effort of project pa is calculated by actual effort of k neighborhood projects. While average of neighborhood projects’ effort is generally used, we adopt size adjustment method, which showed high estimation accuracy in some researches [5][8][19]. Estimated value m ˆ ab is calculated by: mˆ ab . m. ib ik nearestPro jects. amp p a , p i sim p a , p i . sim p. ik nearestPro jects. amp ( p a , pi ) . a. , pi . fp a fp i. (3). (4). In the equation, fpa and fpi are software size of project pa and pi respectively. Size adjustment method assumes effort is s times (s is real number greater than 0) larger when software size is s times larger. The method adjusts effort of pi based on ratio of target project’s size fpa and neighborhood project’s size fpi. III. OUTLIER DELETION METHOD Outlier deletion method examines whether a case (project) in dataset is an outlier or not, and eliminates it from dataset when it is identified as an outlier. When software development effort is estimated, Cook’s distance based deletion is widely applied before building a linear regression model to eliminate outliers (e.g., [7]). Cook’s distance based deletion is used with multiple linear regression analysis, and identifies an outlier when the case greatly varies coefficient of the regression model. Cook’s distance indicates how much residual of all cases varies when a certain case is omitted from model building. Large Cook’s distance means the case greatly affects the model. A.
(4) case is eliminated from dataset when Cook’s distance is larger than 4 / n (n is the number of cases in the dataset). Keung et al. [4] proposed Mantel’s correlation based deletion. It can be applied to analogy based estimation. It identifies an outlier when a set of independent variables’ values is similar, but dependent variable’s value is not similar to other cases. The method is originally proposed in Analogy-X method [4] designed for analogy based estimation. The method consists of (1) delivering a statistical basis, (2) detecting a statistically significant relationship and reject non-significant relationships, (3) providing simple mechanism for variable selection, (4) identifying abnormal data point (project) within a dataset, and (5) supporting sensitivity analysis that can detect spurious correlations in a dataset. We applied function (3) as outlier deletion method. While ordinary correlation coefficient like Pearson’s correlation denotes strength of relationship between two variables, Mantel’s correlation does between two set of variables (i.e., a set of independent variables and a dependent variable). Mantel’s correlation clarifies whether development effort (dependent variable) is similar or not, when project attributes like duration or development size (a set of independent variable) is similar. To settle Mantel’s correlation, Euclidean distance based on independent variables and Euclidean distance based on de-pendent variable is calculated, and then correlation coefficient of them is calculated.. projects), and the methods remove them from the dataset. However, it is probable that test dataset also includes outliers (i.e., an estimation target project itself is outlier). Locations of outliers are classified into the following types: Learning dataset: including outliers, test dataset: no outliers Learning dataset: including outliers, test dataset: including outliers Learning dataset: no outliers, test dataset: including outliers B. Experimental Procedure We analyzed influence of outliers to estimation methods as follows: 1.. 2.. We did not apply outlier deletion methods to estimate effort, because our goal is not to evaluate performance of the deletion methods, but to evaluate influence of outliers to estimation accuracy, when they are not removed. IV. EXPERIMENT A. Aspects of Outliers This study focus on four aspects of outliers. That is, (1) the percentage of outliers, (2) the extent of outliers, (3) variable including outliers, and (4) location of outliers. We assume the influence of outliers varies when one of the four aspects varies. In the experiment, we changed the aspects and analyzed estimation accuracy. (1) The percentage of outliers: This is the percentage of outliers in a dataset. For instance, when a dataset has 100 data points, and 10 data points are changed into outliers, the percentage is 10%. (2) The extent of outliers: This indicates the difference of the recorded value from the actual value on a variable. For example, actual effort of a project is recorded as 200 personhours, and it is changed to 400 person-hours experimentally. In this case, the extent is 100% (|400 - 200| / 200). (3) Variable including outliers: Outliers can be included both dependent variable and independent variables. So, in the experiment, we added outliers to effort and function point. Function point is considered to be most influential variable to effort. (4) Location of outliers: Outlier elimination methods presume that outliers are included in learning dataset (past. 3. 4.. Dataset is randomly divided into two equal set. One is treated as learning dataset, and the other is treated as test dataset. Learning dataset is used to compute estimated effort (regarded as past projects), and test dataset is used as estimation target (regarded as current projects). Outliers are experimentally added to the datasets. They are added based on the four aspects explained in section IV.A. On function point, the percentage of outliers was set as 10% and 20%, and the extent of outliers was set as 100%. On effort, the percentage of outliers was set as 10%, and the extent of outliers was set as 50% and 100%. We set the percentage, assuming it is rare case that the actual percentage exceeds them. Similarly, we set the extent based on the assumption. Additionally, in the preliminary analysis, the influence of outliers was smaller on function point than effort. So, we set the percentage and the extent of outliers larger on function point than effort, to clarify the influence. Effort is estimated, using the dataset including outliers. Then, evaluation criteria of estimation accuracy are calculated based on the results. We repeat the step from 1 to 3 ten times, and calculate the average and the median of the evaluation criteria. We also calculate the criteria of the estimation when outliers are not included. After that, we compare the former criteria with latter one, to analyze the influence of outliers.. C. Dataset We used Desharnais dataset [3] to evaluate effort estimation accuracy. The dataset was collected from Canadian software development companies by Desharnais in 1980s. The dataset is widely used in effort estimation studies [4][15], and it has relatively many data points and many independent variables, compared with other Open-access datasets. Although the dataset is not very new, it is also used in resent study [4]. We removed development year, adjusted function point, and duration from the dataset, and used unadjusted function point, years of experience of team, years of experience of manager, the number of transactions, the number of entities, adjusted factor, and programming language as independent.
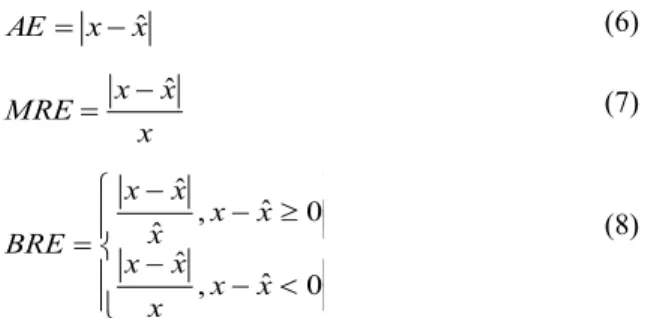
(5) variables. Programming language was transformed into dummy variable since it is categorical variable. D. Evaluation criteria To evaluate accuracy of effort estimation, we used average and median of AE (Absolute Error), MRE (Magnitude of Relative Error) [2], and BRE (Balanced Relative Error) [9]. When x denotes actual effort, and xˆ denotes estimated effort, each criterion is calculated by the following equations: (6). AE x xˆ MRE . x xˆ. (7). x. x xˆ , x xˆ 0 xˆ BRE ˆ x x , x xˆ 0 x . (8). Lower value of each criterion indicates higher estimation accuracy. Intuitively, MRE means relative error to actual effort. However, MRE have biases for evaluating under estimation [6]. Maximum MRE is 1 even if terrible underestimate is occurred (For instance, when actual effort is 1000 person-hour, and estimated effort is 0 person-hour, MRE is 1). So in addition to MRE, we adopted BRE whose evaluation is not biased [10]. To make a baseline, we used learning dataset and test dataset which did not include outliers, and calculated evaluation criteria. After that, we calculated the difference between the baseline and other cases which used dataset including outliers. When the difference is negative, estimation accuracy is degraded by outliers. Also, when it is large, the influence of outliers is large. Using the difference, influence of outliers can be shown explicitly. TABLE II. Learning dataset Have outliers No outlier Have outliers. Learning dataset Have outliers No outlier Have outliers. Test dataset No outlier Have outliers Have outliers. Test dataset No outlier Have outliers Have outliers TABLE V.. Learning dataset Have outliers No outlier Have outliers. Adding outliers to dependent variable: When the percentage of outliers was 10%, and the extent of outliers was 100% (see Table III), estimation accuracy got worse. The average and median of MRE and BRE got worse, and the degradation was more than 5%, except for the case that learning dataset had no outlier and test dataset had outliers. In contrast, when the percentage of outliers was 10%, and the extent of outliers was 50%(see Table II), the degradation was less than 5%, except for the case that learning dataset had outliers and test dataset had no outlier. So, the influence of outliers is not always ignorable when they are included in dependent variable. Adding outliers to independent variable: Overall, the evaluation criteria did not got worse very much, as shown in Table IV and V. Even when the percentage of outliers was 20% (see Table V), although the average and median of MRE and BRE got worse, the degradation was less than 5%. The result suggests that when analogy based estimation is applied to effort estimation, outliers in software size does not need to. Average AE -111.65 -106.61 -199.98. Median AE -25.49 26.30 -13.79. Average MRE -5.67% 2.80% -2.41%. Median MRE -2.07% 1.32% 0.20%. Average BRE -5.00% 0.91% -3.52%. Median BRE -2.16% 1.32% -0.39%. RELATIONSHIPS BETWEEN OUTLIERS AND ESTIMATION ACCURACY (EFFORT, 10%, 100%). TABLE IV. Learning dataset Have outliers No outlier Have outliers. A. Overview Table II to V show the difference of evaluation criteria between the baseline and other cases. On the title of the tables, we showed a variable including outliers, the percentage of outliers, and the extent of outliers. The evaluation criteria is average of ten estimation results (see section IV.B). When the difference of MRE and BRE is larger than 5%, we regarded it is not ignorable, and they are denoted in bold. We set the threshold 5%, considering profit of software development companies. That is, we assume that the profit is the difference of price and cost, and when the error of the cost (i.e., estimated effort) gets worse more than 5%, the error cannot be ignored for the companies.. RELATIONSHIPS BETWEEN OUTLIERS AND ESTIMATION ACCURACY (EFFORT, 10%, 50%). Test dataset No outlier Have outliers Have outliers. TABLE III.. V. RESULTS. Test dataset No outlier Have outliers Have outliers. Average AE -395.67 -410.08 -738.22. Median AE -342.97 -102.81 -393.27. Average MRE -14.26% 2.26% -10.59%. Median MRE -8.23% -1.11% -8.55%. Average BRE -12.93% -3.71% -13.95%. Median BRE -8.07% -1.99% -10.66%. RELATIONSHIPS BETWEEN OUTLIERS AND ESTIMATION ACCURACY (FP, 10%, 100%) Average AE 7.98 -38.52 -32.39. Median AE 10.59 -9.64 32.21. Average MRE 0.99% -1.18% -0.15%. Median MRE 0.49% -0.89% -0.91%. Average BRE 0.86% -0.78% 0.05%. Median BRE 0.43% 0.40% 0.64%. RELATIONSHIPS BETWEEN OUTLIERS AND ESTIMATION ACCURACY (FP, 20%, 100%) Average AE -16.57 -75.97 -69.30. Median AE 3.15 -55.83 -77.98. Average MRE 0.99% -4.10% -1.99%. Median MRE -1.02% -1.71% -2.24%. Average BRE 0.41% -3.20% -2.03%. Median BRE -0.88% -2.18% -3.13%.
(6) be cared very much. B. Discussion We discuss how to utilize the results in practical software development. When software development effort is estimated in practical use, there are two ways to avoid influence of outliers. Measure and collect data precisely, to suppress including outliers. Remove data points which are suspected as outliers. Removing outliers may not need cost very much, if a mathematical outlier elimination method is applied. On the contrary, precise data measurement needs some cost, and it might make people unwilling to measure data. The experimental result suggest that the influence of outliers is not always very large, and hence it is not necessary to spend excessive cost on removing outliers and precise measurement. Actually, on the dataset used in the experiment, estimation errors such as average BRE did not get extremely worse, even when a software size metric included outliers whose percentage and extent were 10% and 50% respectively. Note that we do not claim outlier elimination is not redundant. It is useful to improve estimation accuracy to some extent. Our suggestion is that in practical software development, collecting and analyzing data is important, but excessive avoiding of outliers is not highly required. On effort estimation studies, Desharnais dataset is widely used [4][15], and there is a study which uses Desharnais dataset only [4]. Although our result should not be generalized immoderately, it is not probable that the influence of outliers to estimation accuracy is extremely large on other datasets. On the contrary, it would be different on other datasets how the percentage and the extent of outliers affect the accuracy. So, using other datasets, we should analyze the relationships between the parameters of outliers and the accuracy. VI. RELATED WORK Seo et al. [13] proposed that LTS (least trimmed squares) based deletion and k-means based deletion are applied before effort estimation, and evaluated their effects by estimating development effort with linear regression model, neural network, and Bayesian network. Also, Seo et al. [12] evaluated five outlier elimination methods on two effort estimation methods (i.e., analogy based estimation and multiple linear regression). In their analysis, estimation accuracy was not statistically different between estimation with the elimination methods and without the methods. The result is consistent with our results. However, they did not add outliers to dataset experimentally, and therefore, they did not clarify the relationships between estimation accuracy and the percentage and the extent of outliers. Shepperd et al. [14] compared estimation accuracy of estimation methods such as analogy based estimation and multiple linear regression, considering characteristics of dataset. To prepare datasets which have different characteristics from others, they experimentally made datasets which had. multicollinearity, outliers, and other characteristics. Although they added outliers to independent variables, they did not evaluate the influence of outliers, considering various aspects of outliers like our study shown in section IV.A. For instance, they did not change the location of outliers. VII. CONCLUSIONS To clarify the influence of outliers on effort estimation, we added outliers to datasets experimentally, and evaluated the accuracy of estimation. In the analysis, we changed (1) the percentage of outliers, (2) the extent of outliers, (3) variable including outliers, and (4) location of outliers. Analogy based estimation was used in the analysis. The analysis result showed that the influence of outliers was not very large on a software size metric, when the percentage of outliers was 10%, and the extent of outliers was 100%. We did not persist that outlier elimination is not needed. Our suggestion is that estimation accuracy does not get worse very much, if a variable, especially software size, includes outliers. So, in practical software development, it would be better to focus on collecting data, rather than removing outliers and precise measurement. As future work, we will change the parameters of outliers such as the percentage and the extent on other datasets, and clarify the relationship between estimation accuracy and the parameters. Also, we will analyze the influence of outliers when other dependent variables such as project duration and the number of faults are used. ACKNOWLEDGMENT This research was partially supported by the Japan Ministry of Education, Science, Sports, and Culture [Grant-in-Aid for Scientific Research (C) (No. 25330090)] REFERENCES [1] [2] [3]. [4]. [5]. [6]. [7]. [8]. B. Boehm, Software Engineering Economics, Prentice Hall, 1981. S. Conte, H. Dunsmore, and V. Shen, Software Engineering, Metrics and Models, Benjamin/Cummings, 1986. J. Desharnais, Analyse Statistique de la Productivitie des Projets Informatique a Partie de la Technique des Point des Function, Master Thesis, University of Montreal, 1989. J. Keung, B. Kitchenham, and R. Jeffery, “Analogy-X: Providing Statistical Inference to Analogy-Based Software Cost Estimation,” IEEE Transactions on Software Engineeing,vol.34, no.4, pp.471-484, 2008. C. Kirsopp, E. Mendes, R. Premraj, and M. Shepperd, “An Empirical Analysis of Linear Adaptation Techniques for Case-Based Prediction,” In Proc. of International Conference on Case-Based Reasoning, pp.231245, 2003. C. Lokan, “What Should You Optimize When Building an Estimation Model?” In Proc. of International Software Metrics Symposium (METRICS), pp.34, 2005. E. Mendes, S. Martino, F. Ferrucci, and C. Gravino, “Cross-company vs. single-company web effort models using the Tukutuku database: An extended study,” The Journal of Systems and Software, vol.81, no.5, pp.673-690, 2008. E. Mendes, N. Mosley, and S. Counsell, “A Replicated Assessment of the Use of Adaptation Rules to Improve Web Cost Estimation,” In Proc. of the International Symposium on Empirical Software Engineering (ISESE), pp.100-109, 2003..
(7) [9]. [10]. [11]. [12]. [13]. Y. Miyazaki, M. Terakado, K. Ozaki, and H. Nozaki, “Robust Regression for Developing Software Estimation Models,” Journal of Systems and Software, vol.27, no.1, pp.3-16, 1994. K. Mølokken-Østvold, and M. Jørgensen, “A Comparison of Software Project Overruns-Flexible versus Sequential Development Models,” IEEE Transactions on Software Engineeing, vol.31, no.9, pp.754-766, 2005. R. Selby, and A. Porter, “Learning from examples: generation and evaluation of decision trees for software resource analysis,” IEEE Transactions on Software Engineeing, vol.14, no.12, pp.743-757, 1988. Y. Seo and D. Bae, “On the value of outlier elimination on software effort estimation research,” Empirical Software Engineering, vol.18, no.4, pp.659-698, 2013. Y. Seo, K. Yoon, and D. Bae, “An Empirical Analysis of Software Effort Estimation with Outlier Elimination,” In proc. of international workshop on Predictor models in software engineering (PROMISE), pp.25-32, 2008.. [14] M. Shepperd, and G. Kadoda, “Comparing Software Prediction Techniques Using Simulation,” IEEE Transactions on Software Engineeirng, vol.27, no.11, pp.1014-1022, 2001. [15] M. Shepperd, and C. Schofield, “Estimating software project effort using analogies,” IEEE Transactions on Software Engineeiring, vol.23, no.12, pp.736-743, 1997. [16] K. Srinivasan, and D. Fisher, “Machine Learning Approaches to Estimating Software Development Effort,” IEEE Transactions on Software Engineering, vol.21, no.2, pp.126-137, 1995. [17] K. Strike, K. Eman, and N. Madhavji, “Software Cost Estimation with Incomplete Data,” IEEE Transactions on Software Engineering, vol.27, no.10, pp.890-908, 2001. [18] A. Tosun, B. Turhan, and A. Bener, “Feature weighting heuristics for analogy-based effort estimation models,” Expert Systems with Applications, vol.36, no.7, pp.10325-10333, 2009. [19] F. Walkerden, and R. Jeffery, “An Empirical Study of Analogy-based Software Effort Estimation,” Empirical Software Engineering, vol.4, no.2, pp.135-158, 1999..
(8)
図
関連したドキュメント
The denoising results for pixels near singularities are obtained by nonlocal means in spatial domain to preserve singularities while the denoising results for pixels in smooth
By constructing a suitable Lyapunov functional and using almost periodic functional hull theory, we study the almost periodic dynamic behavior of a discrete Leslie-Gower
We are going to use similar ideas to prove a version of Talagrand’s convex distance inequality based on Theorem 3.1 and, hence, applicable to dependent random variables satisfying
Based on the stability theory of fractional-order differential equations, Routh-Hurwitz stability condition, and by using linear control, simpler controllers are designed to
By an inverse problem we mean the problem of parameter identification, that means we try to determine some of the unknown values of the model parameters according to measurements in
These authors make the following objection to the classical Cahn-Hilliard theory: it does not seem to arise from an exact macroscopic description of microscopic models of
These authors make the following objection to the classical Cahn-Hilliard theory: it does not seem to arise from an exact macroscopic description of microscopic models of
Since the data measurement work in the Lamb wave-based damage detection is not time consuming, it is reasonable that the density function should be estimated by using robust
