Sustainability, inclusive wealth, and energy:
Local and global analysis
著者
ROBI KURNIAWAN
学位授与機関
Tohoku University
学位授与番号
11301甲第18962号
Sustainability, inclusive wealth, and energy:
Local and global analysis
A Thesis Summary Submitted
In Partial Fulfillment of the Requirements
For the Doctoral Degree
By Robi Kurniawan
To the
GRADUATE SCHOOL OF ENVIRONMENTAL STUDIES
TOHOKU UNIVERSITY
Sendai, Japan
July 2019
2 Abstract
To understand the trajectory of sustainability, it is important to measure historical and future projections of productive capital that contribute to well-being for the local and global scope. Compared to other alternatives, Inclusive Wealth (IW) offers a better approach for assessing sustainability, since it provides a comprehensive measurement of stock variables which are related to the potential intergenerational well-being. The IW framework, which includes human, produced, and natural capital, is also able to portray the whole capacity of a country’s assets that serve the provision toward human well-being.
Extending the IW concept for local and global scope, this thesis is divided into five chapters. Chapter 1 presents the background and objectives of the study. Methodology and datasets of the study are explained in Chapter 2. Focusing on Indonesia, chapter 3 explores sustainability, economic growth, and energy-related issue. Extending the framework utilized in Indonesia scope, chapter 4 analyzes the global scope of sustainability. Chapter 5 consist of conclusions, implications and future research.
In the Indonesia scope, sustainability, economic growth, and energy-related issue in the country were explored. The first part of the Indonesia study uses IW framework to explore the nexus between sustainability and economic growth in the country. It is found that Indonesia’s inclusive wealth per capita has been negative, the GDP per capita growth in Indonesia does not necessarily indicate sustainability. The depreciation of both renewable and non-renewable natural capital is driving the decline in wealth per capita. The second part of the Indonesia scope analyzes the effects of economic growth, urbanization, industry, and trade openness on coal consumption in Indonesia using the autoregressive distributed lag. The empirical evidence showed that economic growth, urbanization and trade openness increase coal consumption while decreasing share of secondary industry reduce it. The third part of the Indonesia study examines the characteristics of the Indonesian energy matrix and its evolution in the household sector alongside the impact of kerosene to the Liquid Petroleum Gas conversion program to the Indonesian emissions change. Conducting the decomposition analysis, it is found that the energy mix and carbon intensity effect, which reflects the conversion of kerosene to LPG, contributes to reducing direct emissions with limited effect. High share growth of coal in electricity generation led to increasing indirect emissions for the study period.
3
Shifting to the global scope, a study for 140 countries is performed by extending the framework utilized in Indonesia scope. The first feature of this global scope analyzes the linkage between economic development and environmental quality from the sustainability framework. Utilizing a pooled mean group estimator analysis, it is found that the beneficial impact of the economy only occurs temporarily, since the strong link between environmental degradation and economic development reappear once the second turning point is achieved. Productivity and efficiency measure by using natural capital of inclusive wealth were studied as the second objectives. Applying a weighted Russel directional distance approach, it is found that natural capital remains significant burdens for many countries’ performance, especially for countries with resource-driven economies. The adjustment to a conventional productivity growth measure depends on GDP growth and an endowment growth shift of natural capital relative to other input factors. The third feature of the scope adapts the IW framework for understanding long-term global sustainability. It is found that poverty alleviation, demographic changes and human capital investments are effective instruments to attain greater wealth. Furthermore, the scenario that describes a sustainability pathway, which poses the least amount of climate change challenges and substantially reduced reliance on natural resources, is more conducive to increasing wellbeing than the fragmented pathways that result in inequality. This finding enhances our understanding of how particular countries can measure and manage their sustainability. For Indonesia case, to return to a sustainable growth path, the country must increase its investments to net positive gains at the rate of wealth growth, restrain excessive coal consumption, increasing the share renewable energy in the national energy mix, and intensifying energy efficiency in the household sector. Over the global scope, this finding highlights the importance of managing renewable resources, promoting efficient extraction, and improving education to enhance sustainability.
4 Content Abstract ... 2 Content ... 4 List of figure ... 4 List of table ... 4 1. Introduction ... 5
1.1 Sustainability, well-being, and inclusive wealth ... 5
1.3 Previous applications review ... 6
1.4 Objectives and contributions ... 7
2. Methodology and datasets ... 10
2.1 Sustainability and energy in Indonesia ... 10
2.2 Sustainability, inclusive wealth and its application ... 11
3. Energy and sustainability in Indonesia ... 15
3.1 Economic growth and sustainable development in Indonesia ... 15
3.2 Coal consumption, urbanization, and trade openness linkage ... 16
3.3 Cleaner energy conversion and household emission decomposition analysis ... 16
4. Sustainability, inclusive wealth and its application ... 18
4.1 Economic growth – environmental quality nexus ... 18
4.2 Efficiency and productivity of natural capital ... 18
4.3 Measuring long-term sustainability ... 19
5. Conclusions, implications and future research ... 21
5.1 Conclusions and implications ... 21
5.2 Future research ... 23
References ... 23
List of figure Figure 1. 1 Productive base, GDP, and wellbeing ... 5
Figure 1. 2 Framework of the thesis ... 9
List of table Table 1. 1 Summary of inclusive wealth approach implementation ... 6
Table 1. 2 Objectives and contributions ... 8
Table 2. 1 Methodology summary ... 10
Table 2. 1 Datasets ... 14
5
1. Introduction
1.1 Sustainability, well-being, and inclusive wealth
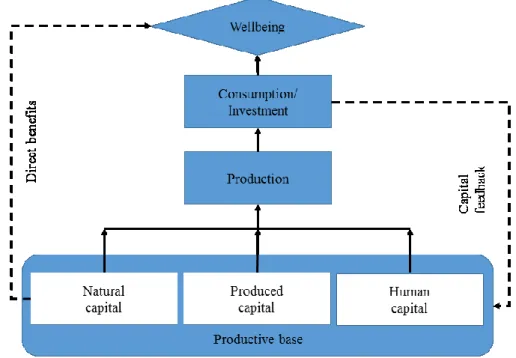
Countries need a tool that comprehensively records their wealth to measure the progress towards the Sustainable Development Goals (Dasgupta et al., 2015). To understand the trajectory of sustainability, it is important to measure historical and future projections of productive capital that contribute to well-being. According to Arrow et al. (2012) and Walker et al. (2009), sustainability is the capacity to provide wellbeing to future generations. Wellbeing as a measure of the quality of good life covers income, educational, as well as ecosystem services from nature (Western and Tomaszewski, 2016). To show the relationship between wellbeing, GDP, and inclusive wealth, I present the schematic in figure 1.1.
Figure 1. 1 Productive base, GDP, and wellbeing
Source: Adapted from Mumford (2016) and UNU-IHDP (2014).
Compared to other alternatives to GDP, Inclusive Wealth (IW) offers a better approach for assessing sustainability, since it provides a comprehensive measurement of stock variables, which are related to the potential intergenerational well-being (Arrow et al., 2012; Collins et al., 2017), and integrates biophysical with social aspects in its accounting system (Fenichel et al., 2016).
6 1.2 Previous applications review
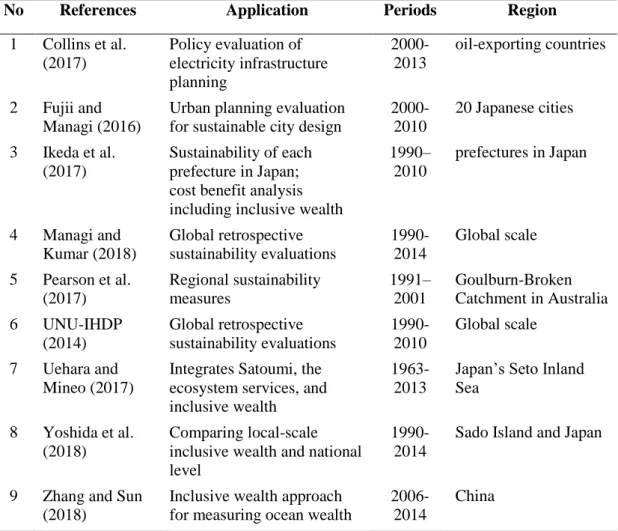
Having the advantages, the IW framework has been widely used for, among others, global sustainability trajectory assessment (Managi and Kumar, 2018). The summary of some previous literature concerning inclusive wealth framework applications is provided in Table 1.1.
Table 1. 1 Summary of inclusive wealth approach implementation
No References Application Periods Region
1 Collins et al. (2017) Policy evaluation of electricity infrastructure planning 2000-2013 oil-exporting countries 2 Fujii and Managi (2016)
Urban planning evaluation for sustainable city design
2000-2010 20 Japanese cities 3 Ikeda et al. (2017) Sustainability of each prefecture in Japan; cost benefit analysis including inclusive wealth
1990– 2010 prefectures in Japan 4 Managi and Kumar (2018) Global retrospective sustainability evaluations 1990-2014 Global scale 5 Pearson et al. (2017) Regional sustainability measures 1991– 2001 Goulburn-Broken Catchment in Australia 6 UNU-IHDP (2014) Global retrospective sustainability evaluations 1990-2010 Global scale 7 Uehara and Mineo (2017)
Integrates Satoumi, the ecosystem services, and inclusive wealth
1963-2013
Japan’s Seto Inland Sea
8 Yoshida et al. (2018)
Comparing local-scale inclusive wealth and national level
1990-2014
Sado Island and Japan
9 Zhang and Sun (2018)
Inclusive wealth approach for measuring ocean wealth
2006-2014
China
It is necessary to study specific country with highly diverse resources such as Indonesia. Supported by economy-boosting commodity prices, Indonesia has become one of the largest low–middle income countries in the world (Basri et al., 2016). In the energy sector of the country, despite its huge renewable-energy potential, the share of fossil fuels is currently approximately 96% of the total primary energy consumption (NEC, 2014). In addition, Indonesia had initiated the massive kerosene to Liquid Petroleum Gas (LPG) conversion program in 2007 which has been considered as the one of the world's largest efforts to promote cleaner cooking fuels (World-Bank, 2013).
7
However, studies concerning sustainability trajectories most rely on cross-country analysis, only generally inferring countries’ trajectories. These studies do not sufficiently assess countries such as Indonesia, which have highly diverse resources including forestry and coal. Considered as the fourth most populous country and major coal exporter, to the best of our knowledge, there have been a lacking of studies on the impacts of the socioeconomics variables to the coal consumption in Indonesia. Furthermore, there have been no comprehensive studies on the impacts of Indonesia’s kerosene to LPG conversion program on CO2 emission change in the household sector.
Over the global scope, it is necessary to measure historical wealth, their relationship with economic growth, and future projections of productive capital that contribute to well-being to understand the sustainability pathway. By-product of economic system such as pollutants returns back to the environmental system. It can degrade the environmental system that reduces its services provided which in turn form part of the natural capital. Numerous efforts for achieving sustainability have led to the relationship between environmental degradation and economic growth. However, from a sustainability perspective, previous studies didn’t cover a wide range of natural capital which has as a vital role for creating well-being. Moreover, in productivity measures, only a few studies have incorporated natural capital. These include Murillo-Zamorano (2005), and Brandt et al. (2017) that cover a limited natural capital such as sub-soil assets. In addition, previous studies also did not provide a future path for wellbeing and inclusive wealth.
1.3 Objectives and contributions
From the backdrop, this thesis analyzes sustainability in Indonesia and global scope. For Indonesia context, there are three main objectives of this thesis, to explore the nexus between sustainability and economic growth, to measure the effects of the socioeconomics variables to coal consumption, and to investigate the driving forces of households emissions change in the country. Over the global scope, there are three specific aims of this thesis by covering 140 countries which represent 99 percent of global GDP and 95 percent of the global population. This thesis investigates the linkage between economic development and environmental quality, efficiency and productivity of natural capital, and long-term sustainability measure. By doing the progressive measurement for Indonesia and global contexts, there are specific endowments of this thesis to current empirical research on energy and sustainability study. In summary, the contributions and objectives of this study are presented in table 1.2.
8
Table 1. 2 Objectives and contributions
No Objectives Contributions
Sustainability and energy in Indonesia
1 Assessing economic growth from a sustainability perspective
Covering Indonesia’s specifics natural capital account
2 Discovering the linkage between coal consumption and socioeconomic variables
Account for the presence of two unknown structural breaks in the datasets
3 Investigate the underlying determinant of emissions change alongside efforts to promote a cleaner cooking fuel program
Empirical side of cleaner cooking fuel program: underlying
determinant emissions Sustainability, inclusive wealth and its application (140 countries)
4 Analyze the linkage between economic development and environmental quality from the sustainability framework
New viewpoints to the debate on the relationship between economic development and the environment 5 To measure the contributions of natural
capital to countries’ productivity and productivity measure
Incorporated natural capital in productivity measures; decomposing natural capital inefficiency score 6 To simulate trajectories of future
wellbeing
Measuring long-term sustainability using inclusive wealth framework and shared socio-economic pathways
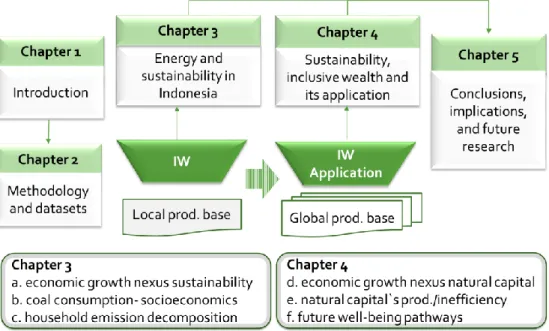
This thesis is divided into 5 chapters. Chapter 1 presents inclusive wealth framework, objectives, and contributions of the study for the sustainability-related field. Chapter 2 explains the methodology and datasets utilized in this thesis. It includes IW framework, Autoregressive Distributed Lag (ARDL), Pooled Mean Group Estimator (PMG), Generalized additive model (GAM), Log Mean Divisia Index (LMDI), Malmquist Productivity Index (MPI), and Weighted Russel Directional Distance Model (WRDDM). Focusing on Indonesia, chapter 3 explores the nexus between sustainability and economic growth in the country, coal consumption and socioeconomics cointegration, and investigate the underlying determinant of emissions change alongside efforts to promote a cleaner cooking fuel program in the country. Utilizing global datasets, 140 countries, chapter 4 analyze the linkage between economic development and environmental quality, capturing the efficient utilization of natural capital to a productivity and efficiency measure, and measuring long-term sustainability. Finally,
9
chapter 5 describes the thesis conclusions and implications. Moreover, further elaborations of inclusive wealth framework are also suggested. The framework of this thesis is provided in Figure 1.2.
10
2. Methodology and datasets
This thesis employs several quantitative approaches including the application of inclusive wealth and the statistical methods, such as ARDL, GAM, LMDI, MPI, and WRDDM. In summary, the methods of this thesis are presented in table 2.1.
Table 2. 2 Methodology summary
No Objectives Methodology Study
Period
Sustainability and energy in Indonesia
1 Assessing economic growth from a sustainability perspective
Inclusive wealth framework
1990-2014
2 Discovering the linkage between coal consumption and socioeconomic variables
ARDL 1970-2015
3 Investigate the underlying determinant of emissions change alongside efforts to promote a cleaner cooking fuel program
LMDI 2000-2015
Sustainability, inclusive wealth and its application (140 countries) 4 Analyze the linkage between economic
development and environmental quality from the sustainability framework
IW and PMG 1990-2014
5 To measure the contributions of natural capital to countries’ productivity and productivity measure
IW and WRDDM 1990-2014
6 To simulate trajectories of future wellbeing
IW and GAM 1990-2100
2.1 Sustainability and energy in Indonesia
Inclusive wealth accounting
Measured by inclusive wealth per capita, development can be considered sustainable if intergenerational wellbeing does not dwindle over time. It is stipulated as follows:
EQUATION 1
𝑉𝑡= ∫ 𝑈(𝐶𝜏)𝑒−𝛿(𝜏−𝑡)𝑑𝜏 ∞
𝑡
In equation 1, 𝑉𝑡 refers to wellbeing at time t, 𝑈 stands for current wellbeing, 𝐶𝜏 covers both market/non-market consumption, and 𝛿 represents the social discount rate.
11
Cointegration analysis
The study employs the ARDL bounds testing approach to examine the cointegration existence among the variables in the presence of structural breaks is calculated using the following equation:
EQUATION 2
𝑙𝑛𝐶𝑜𝑡 = 𝛽0 +∑𝑝𝑖=1𝛽1𝑖𝑙𝑛𝐶𝑜𝑡−1+∑𝑝𝑖=1𝛽2𝑖𝑙𝑛𝑌𝑡−1+∑𝑝𝑖=1𝛽3𝑖(𝑙𝑛𝑌𝑡−1)2
+∑𝑝𝑖=1𝛽4𝑖𝑙𝑛𝐼𝑛𝑡−1+∑𝑖=1𝑝 𝛽5𝑖𝛥𝑙𝑛𝑈𝑟𝑡−1+∑𝑝𝑖=1𝛽6𝑖𝑙𝑛𝑇𝑜𝑖𝑡−1+Ɛ𝑖𝑡
Accordingly, coal consumption per capita (𝐶𝑜𝑡) are explained by GDP per capita (𝑌𝑡), share of secondary industry (𝐼𝑛𝑡), trade openness(𝑇𝑂𝑡), and urban population (𝑈𝑟𝑡).
Emission decomposition
The aggregate household CO2 emissions can be decomposed into five factors as follows: EQUATION 3 𝐶𝑂2𝑡 = ∑ 𝐶𝑂2𝑗𝑡 𝑛 𝑗 = ∑𝐶𝑂2𝑗 𝑡 𝐸𝑁𝑗𝑡 𝑛 𝑗 𝐸𝑁𝑗𝑡 𝐸𝑁𝑡 𝐸𝑁𝑡 𝐺𝐷𝑃𝑡 𝐺𝐷𝑃𝑡 𝑃𝑂𝑃𝑡𝑃𝑂𝑃𝑡
𝐶𝑂2𝑡 refers to Indonesia’s aggregate CO2 emissions from the household sector, which
captures the CO2 emissions from both direct CO2 emissions from household fuel use of
type j. It represents both direct emissions (kerosene, LPG, and gas) and indirect CO2
emissions arising from electricity production. Then, I define the following variable of year t: 𝐸𝑁𝑗𝑡, the household energy consumption for fuel type j; 𝐸𝑁𝑡, aggregate energy consumption in household sector; 𝐺𝐷𝑃𝑡, Gross Domestic Product; and 𝑃𝑂𝑃𝑡 for the Indonesian population during the year.
2.2 Sustainability, inclusive wealth and its application
Cointegration analysis for panel data
To understand the relationship between income and natural capital, the study performed the PMG developed by Pesaran et al. (1999) as follows:
EQUATION 4 ln 𝑁𝐶𝑡= 𝛽0 + ∑ 𝛽1𝑖 ln 𝑁𝐶 𝑡−𝑖 𝑝 𝑖=1 + ∑ 𝛽2𝑖 ln 𝐺𝐷𝑃𝑡−𝑖 𝑞 𝑖=0 + ∑𝑟𝑖=0𝛽3𝑖 (ln 𝐺𝐷𝑃𝑡−1)2+ ∑𝑠𝑖=0𝛽4𝑖 (ln 𝐺𝐷𝑃𝑡−1)3+ ∑𝑡𝑖=0𝛽5𝑖 ln 𝑃𝑂𝑃𝐷𝐸𝑁𝑆𝑡−𝑖+ 𝜀𝑖𝑡
12
where NC is the natural capital estimation; GDP is the per capita gross domestic product (GDP), and εit is the standard error term. To avoid omitted variable bias, the model also
include population density (POPDENS) as an independent variable.
Productivity and efficiency measure
This resarch used a deterministic non-parametric analysis based on the data envelopment analysis, a Malmquist productivity index to measure the contribution of the natural capital to countries’ productivities. To conduct technical inefficiency decomposition, we employed a new methodological approach proposed by Chen et al. (2015) and Barros et
al. (2012), who used the WRDDM, as defined by the following model: EQUATION 5 𝐷⃗⃗ (𝑥𝑘`, 𝑦𝑘`, 𝑏𝑘`; 𝑔) = 𝜌𝑘`= 𝑚𝑎𝑥𝑤𝑦( ∑ 𝜔𝑚𝑦 𝑀 𝑚=1 𝛼𝑚𝑘`) + 𝑤𝑏(∑ 𝜔𝑗𝑏 𝐽 𝑗=1 𝛽𝑗𝑘`) + 𝑤𝑥(∑ 𝜔𝑛𝑥 𝑁 𝑛=1 𝛾𝑗𝑘`) 𝑠. 𝑡 ∑ 𝑧𝑘𝑦𝑚𝑘 𝐾 𝑘=1 ≥ 𝑦𝑚𝑘`+ 𝛼𝑚𝑘`𝑔𝑦𝑚, 𝑚 = 1, … . , 𝑀, ∑ 𝑧𝑘𝑏𝑗𝑘 𝐾 𝑘=1 = 𝑏𝑗𝑘`− 𝛽𝑗𝑘`𝑔𝑏𝑗, 𝑗 = 1, … . , 𝐽 ∑𝐾𝑘=1𝑧𝑘𝑥𝑛𝑘 ≤ 𝑥𝑛𝑘`− 𝛾𝑛𝑘`𝑔𝑥𝑛, 𝑛 = 1, … , 𝑁, 𝑧𝑘≥ 0, 𝑘 = 1, … . , 𝐾
where 𝜌𝑘`stands for technical inefficiency that measures the maximum expansion of
desirable outputs and contraction of undesirable outputs and inputs that remain technically feasible. If 𝜌𝑘`= 0, the DMU k` works on the frontier of T with technical
efficiency, meaning that this DMU is fully efficient. Otherwise, 𝜌𝑘`> 0, then DMU k` operates inside the frontier of T. The 𝛼𝑚𝑘` refers to the individual inefficiency score of
the desirable output 𝑦𝑚, 𝛽𝑗𝑘` represents the individual inefficiency score of undesirable
output 𝑏𝑗, and 𝛾𝑛𝑘` refers to the individual inefficiency score of input 𝑥𝑛. 𝜔𝑥, 𝜔𝑦, 𝜔𝑏 represent that the priorities given to the inputs, and desirable and undesirable outputs are normalized to unity.
Future wellbeing prediction
Utilizing the datasets, I developed a statistical model for inclusive wealth using generalized additive models (Hastie and Tibshirani, 1990). Then, I develop forecasts of inclusive wealth using the estimated coefficients from the previous model by considering each country’s trajectories under different scenarios for income, population and education.
13
There are five different Shared Socioeconomic Pathways (SSPs), and during the first part of the study, they are differentiated by their challenges regarding the mitigation of and adaptation to climate change (O’Neill et al., 2014; van Vuuren et al., 2017).
Using generalized additive models, this most general model is:
EQUATION 6
log(IW_percapitait) = 𝛼1+ηi + γt + ƒ(Log_GDP_percapitait)+ ƒ(Log_Populationit) + ƒ(Log_Education_attainmentit)+εit
Where IW_percapitait measures inclusive wealth per capita; GDP_percapitait is per capita
gross domestic product PPP (based on US$ 2005). ηi is a country fixed effect, γt is a year fixed effect and εit is a stationary ergodic error term. ƒ (⋅) is a generic flexible functional form allowing for a potentially non-linear non-monotonic inclusive wealth per capita, GDP per capita, population, and education relationship.
14
Table 2. 3 Datasets
Variables Data source
Compensation of employees (World-Bank, 2016) (OECD, 2016) (Feenstra et al., 2015) (Lenzen et al., 2013) (Conference-Board, 2016)
Human capital discount rate Assumed rate of 8.5%
Education attainment (Barro and Lee, 2013; Samir and Lutz, 2017)
Employment, labor forces (by age, gender, time) (ILO, 2016) Mortality rates by age, gender, time (WHO, 2016)
Population by ages, gender, time (UNPD, 2015)
Depreciation rate for produced capital (Feenstra et al., 2015) Investment and output for produced capital (UN-SD, 2016) Agricultural and pasture land discount rate Assumed rate of 5% Harvested area in croplands, permanent crops
(agriculture and pastures), price and quantity of crops
(FAO, 2015)
Agricultural and pasture land rental rate (Aguiar et al., 2012) Forest stock, area, commercial, wood
production, and value (FAO, 2015)
Forestry rental rate (Bolt et al., 2002)
Forest ecosystem service (Van der Ploeg et al., 2010)
Forest area including mangroves, excluding
cultivated forest (FAO, 2015)
Catch of each country’s economic exclusive
zone for fishery (Pauly and Zeller, 2016)
Fossil fuel reserves and production (EIA, 2015)
Fossil fuel prices (BP, 2015)
Fossil fuel rental rate (Aguiar et al., 2012)
Minerals reserves, production, prices (USGS, 2015)
Minerals rental rate (Aguiar et al., 2012)
Share of secondary industry (World-Bank, 2017)
Trade openness (World-Bank, 2017)
Urban population (UNPD, 2017)
Household energy consumption (MEMR, 2017)
Households CO2 emissions (MEMR, 2017)
Note: Data sources are provided annually, except those for education attainment, forest volume, area, and density. A particular data is reported every five years; we carried linear interpolations to obtain information on an annual basis.
15
3. Energy and sustainability in Indonesia
3.1 Economic growth and sustainable development in IndonesiaThis study applies the inclusive wealth theory, which assesses the productive base wealth types that contribute to wellbeing, including produced capital, human capital, and natural capital. By employing the inclusive wealth framework, I evaluate the extent to which Indonesia achieved economic growth from 1990 to 2014 at the expense of massive natural capital use in violation of basic sustainability criteria. Regarding natural capital, this study consider Indonesian biodiversity by including the ecosystem service valuation for forests, such as mangroves, and for non-timber resources, such as fishery resources and subsoil minerals. This study also consider Indonesia’s natural capital account, which consists of forest resources, agricultural land, fossil fuels, and minerals.
Indonesia experienced a GDP growth per capita of 124% between 1990 and 2014, while the inclusive wealth per capita growth was negative (–0.05%). The population grew rapidly during the study period, outpacing total wealth growth, so that per capita wealth growth was considered negative. This study is implied that GDP per capita growth in Indonesia during the period did not necessarily indicate growth in wealth per capita. With a negative inclusive wealth per capita growth, Indonesia was considered to be extracting natural capital more than investing in infrastructure and human capital. The main cause of declining wealth per capita, followed by population growth, is the depreciation of the natural capital. I find Indonesia experienced decreases in both renewable and non-renewable natural capital over the study period. From this standpoint, Indonesia has been extracting natural resources at the expense of the ecological wellbeing of future generations.
Recently, stakeholders have begun to understand that non-renewable resources can, and should, serve as a driver for economic growth and poverty reduction (Aubynn, 2009). In the context of sustainability, however, economic development should be accompanied by environmental stewardship and social progress so that it can be maintained for future generations. As Arrow et al. (2012) suggest, countries on unsustainable trajectories can essentially either increase investments to post-positive gains in the rate of wealth growth, or reduce consumption to levels that their productive base can maintain. Jarvis et al. (2011) discusses several points of policy to support the shift. These include policies to
16
promote efficient resource extraction, a system of taxes and royalties that allow the government to recover equitable and proportionate shares of rent, and a clear policy for investment in other productive assets.
3.2 Coal consumption, urbanization, and trade openness linkage
Applying the endogenous structural break, it is found that first break in 1981 is statistically insignificant, while the second break in 1997 is statistically significant.The second break which capturing the Indonesian economic crisis followed by cancellation of a significant numbers of coal power plant take into effect the reduction of coal consumption during the period. The coefficients of lnY and 𝛥(lnY) are positive, implying that both in the long run and in the short run, economic development leads to coal consumption in Indonesia. Inverted U-shaped which suggests EKC shape existence between income and coal consumption proven by the negative and significant coefficient of ln Y2.
The impact of urbanization on coal consumption on lung run is positive and significant at 1% level of significance, implies urbanization increase coal consumption in Indonesia. Even though Indonesia’s populations have passed the 50 % urban landmark, according to Jones (2016), potential growth of urban populations through migration still very high in the future. LnIn has negative and significant, it implies decreasing the share of secondary industry value added to total value added in Indonesia. The ratio of the secondary industry value added to GDP capture the composition effect of the economic structure. The industry is associated with more energy consumption, however, in Indonesia, there is decreasing share pattern of secondary industry value added to total value added. Trade openness has positive and significant, which implies that trade increase coal consumption in Indonesia. This finding is consistent with Tiwari et al. (2013) that concluded positive relationship between trade openness with environmental deterioration.
3.3 Cleaner energy conversion and household emission decomposition analysis
This study intends to examine the characteristics of the Indonesian energy matrix and its evolution in the household sector alongside the impact of kerosene to the LPG conversion program to Indonesian emission change in the sector. This study also aim to
17
investigate the underlying determinant of emissions change, both the direct and indirect effect, from household energy consumption in Indonesia during 2000-2015. To achieve this objective, we conduct the LMDI decomposition analysis.
I compare the direct emissions from fuel combustion (kerosene, LPG, and gas) and the indirect emissions from the electricity consumed by the household sector. From direct emission activity, switching kerosene consumption to LPG program would reduce CO2
emissions by 29% or 8.52 million tons of CO2 from 2000 to 2015. However, from indirect
activity, by including electricity consumption in the household sector, CO2 emissions
increased by 86% or 45.2 million tons of CO2 during the study period.
When comparing 2015 to 2000, the population, income, and carbon intensity effect led to an increase in both direct and indirect energy emissions, while energy intensity reduced them. The fuel mix effect, which reflects the conversion of kerosene to LPG, has contributed to reduction for direct emission change. However, the high share growth of coal in electricity generation led to increasing indirect emissions for the period.
Dividing the study into three stages, I found the role of national kerosene in the LPG conversion program. The program played a role in reducing emissions in the household sector through carbon intensity improvement, but the effect is limited. During the 2010-2015 period, both direct and indirect emissions from carbon intensity are found to be positive. The fuel mix effect captures the extent to which changes in household emissions are caused by changes in the share of energy consumption by fuel type. Changes in the fuel mix arose from a shift towards kerosene to LPG in final energy use, especially related to cooking activity. Over the kerosene-LPG conversion period, the contribution from the energy mix effect was significant. Energy intensity effect is considered the primary driving factor responsible for slowing down household CO2 emissions. This effect can
offset the positive effects arising from emission from the other factors. It is also noticeable that this factor has increased during the 2010-2015 period.
18
4. Sustainability, inclusive wealth and its application
4.1 Economic growth – environmental quality nexus
The study main objective is to investigate the existence of EKC hypothesis in a wider picture using natural capital of inclusive wealth. Doing so, I applied the PMG bounds testing approach for panel datasets on 140 countries during the 1990-2014 study period.
From the results of the models, I found no evidence of the conventional EKC hypothesis for the natural capital. At initial stage economic development, low-income countries depend on the local natural capital. Thus, natural capital extraction increase as countries' economic growth tends to develop. Once turning point is achieved, the trend reversed, it present that the beneficial impacts of economic growth on natural are likely to be achieved in the middle-high level of the economic stage. However, natural capital degradation also increases in latest stages of economic development. I also found that population density places constant pressure on natural capital extraction.
Achieving a sustainable development pathway level with a positive natural capital accumulation is a very difficult task during the first stage and even latest stage of economic development. As suggested by Arrow et al. (2012), nations on unsustainable pathway essentially can either reduce the extraction levels to certain degrees that their productive base can maintain or enhance investments to post-positive gains in the rate of wealth growth.
4.2 Efficiency and productivity of natural capital
This study combined the concept of inclusive wealth, including natural capital, as input in productivity and efficiency measurements. Using the applied developed directional distance function, we analyzed the contribution effect of natural capital to efficiency and productivity change as an important addition to the current research of sustainability.
It is found that the adjustment to the conventional productivity growth measure depends on the output growth (GDP) and shift of natural capital relative to other input factors. The adjustment to the conventional TFP growth measure is negative, since natural capital grew faster over the sample period than the traditional input index that combines only human and produced capital input growth. It adjusted to be positively higher for several countries that utilized modest natural capital to accompany their GDP growth.
19
The adjustment of the conventional and TFP considering natural capital growth measurement may shift over time with respect to resource utilization.
Countries, on average, have high inefficiency scores for natural capital. Natural capital has remained largely hidden to policy-makers due to the limitations of traditional economic indices. It becomes a significant burden to measure most countries’ performance, particularly for countries that are oil producers or with depleting forests. As a result, these countries have failed to adequately invest in rebuilding this capital, despite evidence that returns on investment in natural capital far outweigh investment in physical capital, such as infrastructure. Investments in natural capital, particularly agricultural land and forest, can produce several dividends: increasing inclusive wealth and productivity, improving agricultural resiliency and food security, and mitigating climate change, according to UNU-IHDP and UNEP (2014).
4.3 Measuring long-term sustainability
Current and long-term inclusive wealth projections (up to 2100) are crucial to understand global sustainability trajectories. By expanding prior datasets, this study considers the entire production base, which includes the human, natural, and produced capital of 140 countries, as a source of wellbeing. I develop a statistical model for the historical effects of key socioeconomic variables (GDP per capita, population, and education) on country-specific inclusive wealth during the study period. This study offers five newly-developed shared socio-economic pathways, which represent a set of widely diverging narratives. Then, we conduct projections for 2014–2100 along with the five SSPs that strive to explain the implications of key socioeconomic variables on long-term global sustainability. Considering the high level of uncertainty, such scenarios would need to extend a wide range of possible sustainability trajectories.
It is discovered that worldwide inclusive wealth increases with socioeconomic improvement, GDP per capita and educational attainment, while larger populations are related to lower inclusive wealth per capita. Global wealth per capita projections differ widely across the different SSPs. Globally, the range of average inclusive wealth per capita income levels at the end of the century varies. It increases from 2 times 2010 levels for SSP3 to more than 4 times for SSP1. The convergence scenarios, SSP1 and SSP5, and SSP2 as an extension, indicate that medium-high economic growth and educational
20
attainment outweigh the impact of expected population growth and result in fostering inclusive wealth per capita. However, for SSP3 and SSP4, low-medium economic growth, low investments in education, and medium to high population growth imply lower inclusive wealth per capita trends.
As for convergence patterns, certain countries and regions will catch up with the technological leaders; the share of wealth of Eastern Asia will be more than 25% of total global wealth in 2040. Over the decades, their growth rates will shrink as their productivity nears the frontier and the structure of the aging population in the region reduces its prospects for growth in wealth. In 2100, based on SSP1, SSP5 and to a certain extent, SSP2, South Central Asia will have a share of wealth of more than 20% of total global wealth. Because of their lower education levels and younger population, this particular region has more room to increase their wealth in the future.
Scenarios for the wealth projection in this study were lower in term of inclusive wealth growth rather than projections of global and regional GDP developed by (Dellink et al., 2015). They found, the range of average per capita income levels at the end of the century varies from a less than 3-fold increase over current levels in SSP3 to more than a 16-fold increase in SSP5. In our study, projections of global and regional wealth differ widely across the different SSPs. The range of increasing inclusive wealth per capita is 2 times greater in SSP3 and approximately 4 times greater in SSP1. This difference is related to the different approach of each indicator. GDP represents flow and measure gains in production and output at market prices. Conversely, inclusive wealth captures capital stocks as a source of wellbeing (Dasgupta et al., 2015; Polasky et al., 2015).
21
5. Conclusions, implications and future research
5.1 Conclusions and implications
To understand the trajectory of sustainability for the local and global scope, there are two main features of this thesis. The first feature discusses energy and sustainability issues within Indonesia scope. The nexus between sustainability and economic growth, the effects of the socioeconomic variables to coal consumption, and the driving forces of emissions were assessed in Indonesia context. Shifting to global analysis, the second feature of this paper discusses three aspects. The linkage between economic development and environmental quality, efficiency and productivity of natural capital, and long-term sustainability measure were explored over global scope. For this purpose, we conducted several quantitative approaches, including the application of inclusive wealth as sustainability measures and combined with the statistical methods.
Utilizing inclusive wealth framework that covers the country’s unique resources and biodiversity, it is found that Indonesia’s inclusive wealth per capita has been negative within the study period. This study is implied that the GDP per capita growth in Indonesia does not necessarily indicate sustainability. The depreciation of both renewable and non-renewable natural capital is driving the decline in wealth per capita. Despite this, trends show sustainability has been improving, although marginally, due to produced and human capital growth rates. To return to a sustainable growth path, Indonesia must increase its investments to net positive gains at the rate of wealth growth, and it must reduce its resource extraction to levels that its productive base can maintain.
Being part of natural capital, coal is one of the important issue related to sustainability in Indonesia. The effects of economic growth, urbanization, industry, and trade openness on coal consumption in Indonesia over the period 1970–2015 were studied. This study estimates the autoregressive distributed lag method and confirm that the variables are cointegrated for long run linkage with the presence of structural breaks. The empirical evidence showed that economic growth, urbanization and trade openness increase coal consumption while decreasing share of secondary industry reduce it. Having a vital role in the energy mix, Indonesia needs to restrain excessive coal consumption to enhance environmental quality. Having crucial impact to coal consumption, urbanization should be taken into consideration in energy policy-making process.
22
Another’s important issue for sustainable development in Indonesia, the world’s fourth most populous country, is their emissions. Using LMDI decomposition analysis, it is found that population and income led to increases of both direct and indirect energy emission, while the impact of energy intensity was the opposite. The fuel mix and carbon intensity effect, which reflects the conversion of kerosene to LPG, contributes to reducing direct emissions with limited effect. High share growth of coal in electricity generation led to increasing indirect emissions for the period. This findings has important policy implications, particularly for increasing the share of new and renewable energy in the national energy mix and for intensifying energy efficiency in the household sector.
Shifting to the global scope, I conducted a study for 140 countries during 1990-2014 periods. This study analyzes the linkage between economic development and environmental quality from the sustainability framework. Conducting a pooled mean group estimator analysis, it is revealed that the beneficial impact of the economy decouples environmental degradation from economic development occurs temporarily. This result shows important implications on natural resources management policy.
Productivity and efficiency measure by using natural capital of inclusive wealth were studied. Applying a weighted Russel directional distance and a Malmquist productivity index, it is found that natural capital remain significant burdens for many countries’ performance, especially for countries with resource-driven economies and extreme vulnerability to climatic shifts. The adjustment to a conventional productivity growth measure depends on GDP growth and an endowment growth shift of natural capital relative to other input factors. This finding enhances our understanding of how particular countries can measure and manage their sustainability.
To understand the trajectory of sustainability, it is important to measure historical and future projections of productive capital that contribute to wellbeing. Adapting the inclusive wealth of 140 countries, I develop projections for 2014–2100 using the newly developed shared socio-economic pathways that strive to explain the implications of key socioeconomic variables on long-term global sustainability. Poverty alleviation, demographic changes and human capital investments are effective instruments to attain greater wealth as shown in East and Southeast Asia. Furthermore, the SSP that describes a sustainability pathway is more conducive to increasing wellbeing than the fragmented pathways that result in inequality.
23 5.2 Future research
This study has several issues that could be addressed in future research. Rely on country scope analysis, it is suggested to assess regional/provincial level to address the highly diverse resources and inequality. Further elaborations, such as greater consideration for the quality of education and health in human capital and socioeconomic inequality, as well as explicitly considering another’s ecosystem services in the scenario, would enhance our understanding of future wellbeing. Further elaborations, such as consideration for biodiversity and including more resources such as: livestock, aquaculture, and coral reef also would enrich the sustainability analysis.
References
Aguiar, A., McDougall, R., Narayanan, B., 2012. Global trade, assistance, and production: The GTAP 8 data base. Center for Global Trade Analysis, Purdue University.
Arrow, K.J., Dasgupta, P., Goulder, L.H., Mumford, K.J., Oleson, K., 2012. Sustainability and the measurement of wealth. Environment and Development Economics 17, 317-353.
Aubynn, A., 2009. Sustainable solution or a marriage of inconvenience? The coexistence of large-scale mining and artisanal and small-scale mining on the Abosso Goldfields concession in Western Ghana. Resources Policy 34, 64-70.
Barro, R.J., Lee, J.W., 2013. A new data set of educational attainment in the world, 1950–2010. Journal of Development Economics 104, 184-198.
Basri, M.C., Rahardja, S., Fitrania, S.N., 2016. Not a Trap, But Slow Transition? Indonesia's Pursuit to High Income Status. Asian Economic Papers 15, 1-22.
Bolt, K., Matete, M., Clemens, M., 2002. Manual for calculating adjusted net savings. Environment Department, World Bank, 1-23.
BP, 2015. Statistical Review of World Energy June 2015. BP. https://www.bp.com/content/dam/bp- country/es_es/spain/documents/downloads/PDF/bp-statistical-review-of-world-energy-2015-full-report.pdf.
Brandt, N., Schreyer, P., Zipperer, V., 2017. Productivity measurement with natural capital. Review of Income and Wealth 63, S7-S21.
Collins, R.D., Selin, N.E., de Weck, O.L., Clark, W.C., 2017. Using inclusive wealth for policy
evaluation: Application to electricity infrastructure planning in oil-exporting countries. Ecological Economics 133, 23-34.
Conference-Board, 2016. Total Economy Database, in: http://www.conference-board.org/data/economydatabase/, C.-B. (Ed.).
Dasgupta, P., Duraiappah, A., Managi, S., Barbier, E., Collins, R., Fraumeni, B., Gundimeda, H., Liu, G., Mumford, K., 2015. How to measure sustainable progress. Science 350, 748-748.
Dellink, R., Chateau, J., Lanzi, E., Magne, B., 2015. Long-term economic growth projections in the Shared
Socioeconomic Pathways. Global Environmental Change.
EIA, 2015. International energy statistics, in: http://www.eia.gov/countries/data.cfm, U.S.E.I.A. (Ed.). FAO, 2015. Global Forest Resources Assessment 2015: How are the World's Forests Changing? Food and
Agriculture Organization Rome.
Feenstra, R.C., Inklaar, R., Timmer, M.P., 2015. The next generation of the Penn World Table. American economic review 105, 3150-3182.
Fenichel, E., Joshua K. Abbott, Jude Bayham, Whitney Boone, Erin M. K. Haacker, Pfeiffer, L., 2016. Measuring the value of groundwater and other forms of natural capital. Proceedings of the National Academy of Sciences 113, 2382-2387.
24
Fujii, H., Managi, S., 2016. An evaluation of inclusive capital stock for urban planning. Ecosystem Health and Sustainability 2, e01243.
Hastie, T.J., Tibshirani, R.J., 1990. Generalized additive models, volume 43 of Monographs on Statistics and Applied Probability. Chapman & Hall, London.
Ikeda, S., Tamaki, T., Nakamura, H., Managi, S., 2017. Inclusive wealth of regions: the case of Japan. Sustainability Science 12, 991-1006.
ILO, 2016. Key Indicators of the Labour Market (KILM), in: https://www.ilo.org/global/statistics-and-databases/research-and-databases/kilm/lang--en/index.htm, I.L.O. (Ed.).
Jarvis, M., Lange, G.-M., Hamilton, K., Desai, D., Fraumeni, B., Edens, B., Ferreira, S., Li, H., Chakraborti, L., Kingsmill, W., 2011. The changing wealth of nations: measuring sustainable development in the new millennium. World Bank, Washington DC.
Jones, G.W., 2016. Migration and Urbanization in China, India and Indonesia: an Overview,
Contemporary Demographic Transformations in China, India and Indonesia. Springer, pp. 271-276. Lenzen, M., Moran, D., Kanemoto, K., Geschke, A., 2013. Building Eora: A Global Multi-Region Input–
Output Database at High Country and Sector Resolution. Economic Systems Research 25, 20-49. Managi, S., Kumar, P., 2018. Inclusive Wealth Report 2018: Measuring Progress towards Sustainability.
Routledge.
MEMR, 2017. Handbook of Energy and Economic Statistics of Indonesia 2016. Ministry of Energy and Mineral Resources Indonesia, Jakarta.
Mumford, K.J., 2016. Prosperity, Sustainability and the Measurement of Wealth. Asia & the Pacific Policy Studies 3, 226-234.
Murillo-Zamorano, L.R., 2005. The role of energy in productivity growth: A controversial issue? The Energy Journal, 69-88.
NEC, 2014. Outlook Energi Indonesia 2014. National Energy Council-Ministry of Energy and Mineral Resources, Jakarta.
O’Neill, B.C., Kriegler, E., Riahi, K., Ebi, K.L., Hallegatte, S., Carter, T.R., Mathur, R., van Vuuren, D.P., 2014. A new scenario framework for climate change research: the concept of shared socioeconomic pathways. Climatic Change 122, 387-400.
OECD, 2016. OECD National Accounts, in: https://stats.oecd.org/Index.aspx?DataSetCode=NAAG, O. (Ed.).
Pauly, D., Zeller, D., 2016. Catch reconstructions reveal that global marine fisheries catches are higher than reported and declining. Nature communications 7, 10244.
Pearson, L.J., Biggs, R., Harris, M., Walker, B., 2017. Measuring sustainable development: the promise and difficulties of implementing Inclusive Wealth in the Goulburn-Broken Catchment, Australia. Sustainability: Science, Practice and Policy 9, 16-27.
Pesaran, M.H., Shin, Y., Smith, R.P., 1999. Pooled Mean Group Estimation of Dynamic Heterogeneous Panels. Journal of the American Statistical Association 94, 621-634.
Polasky, S., Bryant, B., Hawthorne, P., Johnson, J., Keeler, B., Pennington, D., 2015. Inclusive wealth as a metric of sustainable development. Annual Review of Environment and Resources 40, 445-466. Samir, K., Lutz, W., 2017. The human core of the shared socioeconomic pathways: Population scenarios
by age, sex and level of education for all countries to 2100. Global Environmental Change 42, 181-192.
Tiwari, A.K., Shahbaz, M., Adnan Hye, Q.M., 2013. The environmental Kuznets curve and the role of coal consumption in India: Cointegration and causality analysis in an open economy. Renewable and Sustainable Energy Reviews 18, 519-527.
Uehara, T., Mineo, K., 2017. Regional sustainability assessment framework for integrated coastal zone management: Satoumi, ecosystem services approach, and inclusive wealth. Ecological Indicators 73, 716-725.
UN-SD, 2016. National Accounts Estimates of Main Aggregates, in: https://unstats.un.org/unsd/snaama/Introduction.asp, U.N.S.D. (Ed.).
UNPD, 2015. World Population Prospects. Key Findings and Advanced Tables. The 2015 Revision. United Nations Population Division, ESA/P/WP. 241, New York.
UNPD, 2017. World population prospects: The 2017 Revision, New York.
UNU-IHDP, U., 2014. Inclusive Wealth Report 2014: Measuring Progress Towards Sustainability. Cambridge University Press, Cambridge.
USGS, 2015. Mineral Commodity Summaries 2015, in:
25
Van der Ploeg, S., De Groot, R., Wang, Y., 2010. The TEEB Valuation Database: overview of structure, data and results. Foundation for Sustainable Development, Wageningen.
van Vuuren, D.P., Riahi, K., Calvin, K., Dellink, R., Emmerling, J., Fujimori, S., Kc, S., Kriegler, E., O’Neill, B., 2017. The shared socio-economic pathways: trajectories for human development and global environmental change. Global Environmental Change 42, 148-152.
Walker, B., Pearson, L., Harris, M., Maler, K.-G., Li, C.-Z., Biggs, R., Baynes, T., 2009. Incorporating Resilience in the Assessment of Inclusive Wealth: An Example from South East Australia. Environmental and Resource Economics 45, 183-202.
Western, M., Tomaszewski, W., 2016. Subjective wellbeing, objective wellbeing and inequality in Australia. PloS one 11, e0163345.
WHO, 2016. Life tables for WHO member states, in:
http://www.who.int/gho/mortality_burden_disease/life_tables/life_tables/en/, W.H.O. (Ed.), World Health Statistics.
World-Bank, 2013. Indonesia: Toward universal access to clean cooking. The World Bank Group, Washington DC.
World-Bank, 2016. World Bank Data: Indonesia, in: http://data.worldbank.org/country/indonesia, W.B. (Ed.).
World-Bank, 2017. World Bank data World-Bank.
Yoshida, Y., Matsuda, H., Fukushi, K., Ikeda, S., Managi, S., Takeuchi, K., 2018. Assessing local-scale inclusive wealth: a case study of Sado Island, Japan. Sustainability Science 13, 1399-1414. Zhang, J., Sun, W., 2018. Measurement of the ocean wealth of nations in China: An inclusive wealth