Mechanism of the photochemically induced
nucleation of proteins
THESIS
Gunma University
for the Degree of
DOCTOR OF ENGINEERING
Contents
I. General Introduction 1
I-1 Structure-based drug design 2
I-2 Major techniques for structure solution: crystallization 3
I-3 Crystallization theory 4
I-4 Progress of protein crystallization techniques by use of external perturbation 6
I-5 References 7
II. Photochemically induced nucleation of Hen egg-white lysozyme 19 II-1 Introduction
II-1-1 Hen egg-white lysozyme 20
II-1-2 Previous works of light induced nucleation of lysozyme 20 II-2 Experimental section
II-2-1 Sample preparation and experimental apparatus 24
II-2-2 Light irradiation 24
II-2-3 Crystallization experiment 25
II-2-4 Transient absorption measurements 25 II-2-5 Enzymatic activity measurements by the ML method 26
II-2-6 SDS-PAGE experiment 26
II-3 Results and Discussion
II-3-1 Electron spectrum measurements 27
II-3-2 Slide glass tests 27
II-3-3 Development of a crystallization technique 28 II-3-4 Transient absorption measurements 30 II-3-5 Enzymatic activity measurements 32
II-3-6 Crystallization by two-color light-irradiation 33 II-3-7 Dimer detection by SDS-PAGE experiment 33
II-4 Summary 35
II-5 References 37
III. pH dependence of photochemically induced nucleation of lysozyme 71
III-1 Introduction 72
III-2 Experimental section 73
III-3 Results and Discussion
III-3-1 Transient absorption measurements 73 III-3-2 Dimer detection by SDS-PAGE experiments 74 III-3-3 pH dependence of photochemically induced nucleation of lysozyme 75
III-4 Summary 76
III-5 References 76
IV. Photochemically induced nucleation of Bovine pancreatic Ribonuclease A 82
IV-1 Introduction 83
IV-2 Experimental section
IV-2-1 Sample preparation 84
IV-2-2 Crystallization experiment and UV irradiation apparatus 84 IV-3 Results and Discussion
IV-3-1 Electronic spectrum measurements 85 IV-3-2 Transient absorption measurements 85 IV-3-3 Dimer detection by SDS-PAGE experiment 86
IV-4 Summary 88
IV-5 References 89
V. Conclusion 103
Chapter I
I General introduction
I-1 Structure-based drug design
Protein X-ray crystallography is one of the premier techniques for elucidating three dimensional structures at atomic resolution [I-1, 2, 3]. Crystal structures provide the exact nature of protein-ligand interactions and catalytic mechanism of enzymes. Information about the structural, chemical and dynamic landscapes of a macromolecular drug target has been used for the development of small-molecule drugs through a process termed structure-based drug design (SBDD) [I-4]. SBDD is an iterative method that combines protein structure and molecular modeling to develop and optimize small-molecular inhibitors. By the determination of crystal structures of protein targets with substrates, natural product inhibitors, compounds derived from libraries or anew-designed scaffolds, medicinal chemists and molecular modelers are able to devise strategies for making rational modification to molecules that may improve compound affinity and selectivity. Scheme I-1 shows flowchart of structure-based drug design. After the first set of protein-ligand structures is determined, further its active site of rational drug candidates is design and modification, target structure-based screening and cocrystal structure determination are used to develop potential drug candidates.SBDD has the potential to accelerate the rate at which small-molecule candidates reach the clinic by reducing the number of compounds that have to be synthesized and tested.
Although the ability to effectively act upon the drug target is an essential feature of drug candidates, their utility ultimately depends on additional properties that are not directly assessed in most SBDD regimens. However, by precisely localizing regions of the small molecules involved in the key protein-ligand interactions, SBDD provides insights into how modifications to the compound can be made without compromising ligand affinity. Thus, information from testing several small-molecule candidates in animals, or in surrogate tests when available, can provide insights on how to rationally design drug candidates with
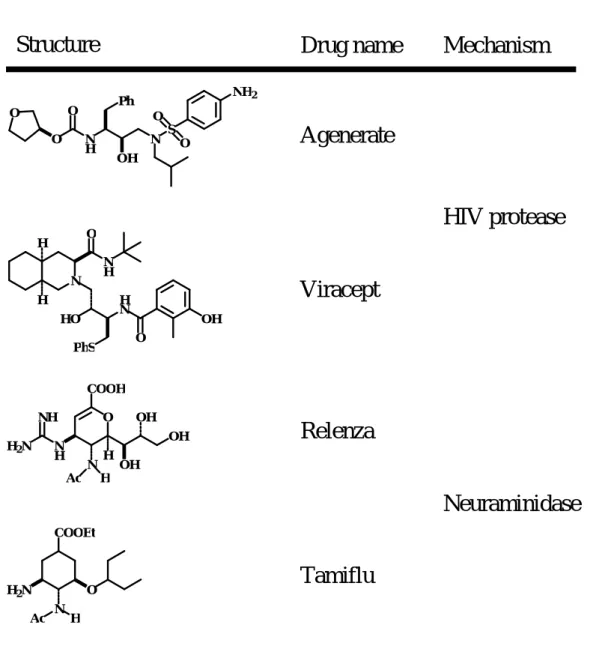
improved pharmacokinetic properties or a reduced toxicity profiles. Table I-1 shows drugs derived from structure-based approaches. Several drugs currently on the market such as the HIV protease [I-5] inhibitors AgeneraseTM (Vertex and GlaxoSmithKline) [I-6], ViraceptTM (Agouron) [I-7], neuraminidase [I-8] inhibitors RelenzaTM (GlaxoSmithKline) [I-9] and TamifluTM (Gilead Sciences and Roche) [I-10] were developed through structure-based methodologies.
I-2 Major techniques for structure solution: crystallization
Protein crystallography has been progressing slowly, because protein crystallization is labor intensive due to a number of bottlenecks.
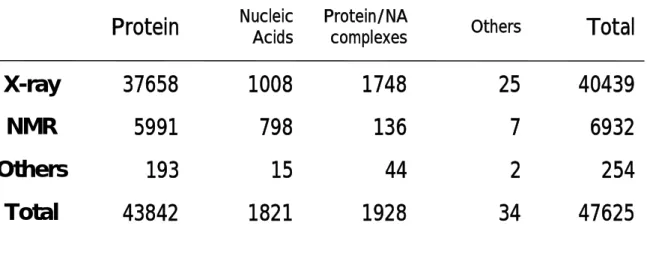
Protein structures are stored in a global responsibility called the Protein Data Bank (PDB) (http://www.rcsb.org/pdb/home/home.do) which, from its inception 1971, has grown from less than a dozen structures to over 47500 structures in 2007; many of which are complexes that contain other relevant molecules and ligands such as drugs or co-factors. The first protein structure (Myoglobin) was determined by Kendrew et al. in 1960s by use of X-ray crystallography [I-11]. Since then, structures of many other proteins have been determined using mostly X-ray crystallography but also nuclear magnetic resonance (NMR) spectroscopy. Table I-2 shows methods for the structure determination and number of proteins listed in PDB. Liganded X-ray structures provide a wealth of information that can significantly assist and guide the drug development process.
Historically, the 3D protein structure determination requires 1-20 years for individual protein or protein assembly. Scheme I-2 shows the structure solution procedure using X-ray crystallography, consisting of cloning, expression, solubilization, purification, crystallization and diffraction steps. The bottleneck of some protein samples was reduced with the molecular
and purification of a number of gene products [I-12 - 16]. This approach enables the exploration of multiple constructs, homologs and variants for specific protein targets. The second major advance has been in the structure determination process. For example, the use of multiple-wavelength anomalous dispersion (MAD) using selsenomethionine incorporated into the overexpressed protein [I-17, 18], diffraction data collection at synchrotron beam-lines using flash cooling [I-19], beam-lines robotics and automated structure solution methods [I-20 - 22] have all provided tremendous breakthroughs enabling the high-throughput structural biology.
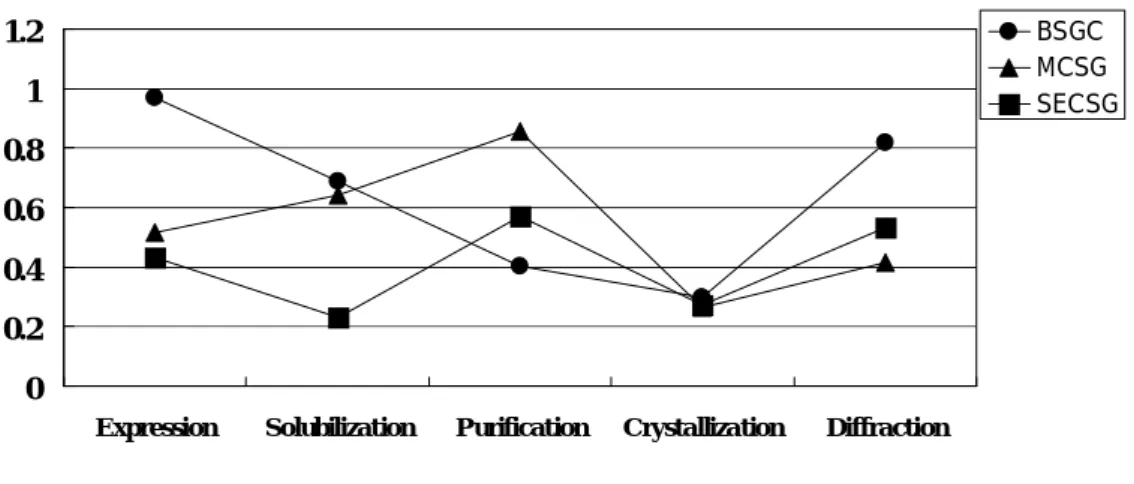
Figure I-1 shows the proportion of success on each experimental step. These data were cited from statistical results of structure solution projects; Berkeley Structural Genomics Center (BSGC, circle), Midwest Center for Structural Genomics (MCSG, triangle) and Southeast Collaboratory Structural Genomics (SECSG, square). It is understood that crystallization remains one of the rate-determining steps to solve macromolecular structure.
I-3 Crystallization theory
The technique of protein crystallization is an underdeveloped subject, and a trial and error procedure has been mainly employed for the crystallization of each protein. The birth of a nucleus, the so-called nucleation process, is one of the most fascinating problems in protein crystallization. This nucleus absorbs growth-units from supersaturated environment to grow to crystal, so called crystal growth process [I-23].
Figure I-2 shows a typical solubility curve of protein vs. the salt concentration. A solution whose composition lies below the solubility curve is “undersaturated”. In this undersaturated region, crystal dissolves into solution, while in the “supersaturated” region proteins nucleate and grow to crystal [I-24, 25]. Therefore, production of a supersaturated solution is a prerequisite for crystallization. Formally the supersaturation, , is defined as the ratio between
the protein concentrations in an equilibrium state, Ceq, and in supersaturated state, Css:
= Css / Ceq (1)
To obtain precise X-ray crystallographic data it is necessary to prepare a single crystal from a solution of low supersaturation level, because a solution of higher supersaturation level gives only amorphous precipitation. Here, I discuss the nucleation and growth of crystal from the point of view of thermodynamics. Figure I-3 shows the free energy change ( G) as a function of critical cluster radius (r) in nucleation. Free energy, G, is defined in terms of surface energy disadvantage (4 r2 ) and volume advantage (- 4 r3 ln / 3V):
G = 4 r2 - 4 r3 kT ln / 3V (2) where r is cluster radius, is surface tension, k is Boltzmann constant, T is Kelvin temperature,
is supersaturation and V is cluster volume. The critical cluster radius r* at the maximum ( G*) in free energy corresponds to the size at which further growth of the cluster leads to a decrease in free energy. For a cluster with radius less than r* the decrease in free energy can only be achieved by dissolution. At the same time, G* is considered to be activation barrier at critical cluster radius r*.Figure I-4 shows variation in the activation barrier as a function of . At high , when the radius of the critical cluster becomes small, the activation barrier disappears and amorphous forms. Thus, an energy barrier with a proper height is necessary to obtain a single crystal.
The crystallization process is summarized as shown in Figure I-5. Molecules gather to form clusters consisting of 2, 3, 4, molecules and finally grow to bulk crystal. When the size is small, clusters are unstable, due to the surface/volume energy disadvantage and grow or dissolve even under supersaturation. When the cluster size becomes larger than the critical size, the nucleus grows to bulk crystal.
lower than that required for “homogenous nucleation”. A catalytic surface also induces nucleation by the adsorption of crystallizing materials to reduce the value of G*. The extent of this reduction depends on the degree to which the catalyzing body mimics the structure of the crystallizing material.
To obtain high quality crystallographic samples, we have to set up an optimum crystallization condition; the nucleus should be formed at a level of supersaturation lower than amorphous area and higher than solubility. For an efficient crystal growth, supersaturation must be reduced to a lower level; a high supersaturation would result in the formation of too many nuclei and then too many small crystals.
I-4 Progress of the protein crystallization technique by use of external
perturbation
Novel nucleation techniques of protein have been recently reported by physical chemists and crystallographers. Most of these techniques are making use of external perturbation such as cooling [I-26], electric field [I-27 - 29], magnetic field [I-30 - 34], micro-gravity [I-34, 35], femto-second laser pulse [I-36, 37] and ultra-sounds radiation [I-38, 39].
In this study, I employed photochemical reaction to induce protein nucleation in low supersaturated solution where spontaneous nucleation does not take place. Hen egg-white lysozyme and bovine pancreatic ribonuclease A were selected as model proteins, and as the first step, development of the crystallization technique making use of photochemical reaction of lysozyme was investigated. To clarify the nucleation mechanism, transient absorption measurements, enzymatic activity measurements and SDS-PAGE were carried out and the mechanism was deduced from the experimental results. As the second step, for further confirmation of the mechanism, crystallization of lysozyme has been studied by changing pH value of protein solution. At the last step, the mechanism deduced from lysozyme was studied
whether it is available or not for other proteins lacking tryptophan residue: ribonuclease A.
I-5 References
[I-1] McPherson, A. Preparation and Analysis of Protein Crystals,KriegerPublishing Company, Malabar, Florida, 1982, 82.
[I-2] McRee, D. Practical Protein Crystalography, 1999. [I-3] McPherson, A. Methods 2004, 34, 245.
[I-4] Harren, J. Trends in Biochemistry 2000, 19, S57.
[I-5] Jaskólski, M.; Tomasselli, A.G.; Sawyer, T.K.; Staples, D.G.; Heinrikson, R.L.; Schneider, J.; Kent; S.B.H.; Wlodawer, A. Biochemistry 1991, 30,1600.
[I-6] Kim, E.E.; Baker, C.T.; Dwyer, M.D.; Murcko, M.A.; Rao, B.G.; Tung, R.D.; Navia, M.A. J. Am. Chem. Soc. 1995, 117, 1181.
[I-7] Kaldor, S.W.; Kalish, V.J.; Davies II, J.F.; Shetty, B.V.; Fritz, J.E.; Appelt, K.; Burgess, J.A.; Campanale, K.M.; Chirgadze, N.Y.; Clawson, D.K.; Dressman, B.A.; Hatch, S.D.; Khalil, D.A.; Kosa, M.B.; Lubbehusen, P.P.; Muesing, M.A.; Patick, A.K.; Reich, S.H.; Su, K.S.; Tatlock, J.H. J. Med. Chem. 1997, 40, 3979.
[I-8] Russell, R. J.; Haire, L. F.; Stevens, D. J.; Collins, P. J.; Lin, Y. P.; Blackburn, G. M.; Hay, A. J.; Gamblin, S. J.; Skehel, J. J. Nature 2006, 443, 45.
[I-9] Von Itzstein, M.; Wu, W.-Y., Kok, G.B.; Pegg, M.S.; Dyason, J.C.; Jin, B.; Tho Van Phan, Smythe, M.L.; White, H.F.; Oliver, S.W.; Colman, P.M.; Varghese, J.N.; Ryan, D.M.; Woods, J.M.; Bethell, R.C.; Hotham, V.J.; Cameron, J.M.; Penn, C.R. Nature 1993, 363, 418.
[I-10] Kim, C.U.; Lew, W.; Williams, M.A.; Liu, H.; Zhang, L.; Swaminathan, S.; Bischofberger, N.; Chen, M.S.; Mendel, D.B.; Tai, C.Y.; Laver, W.G.; Stevens, R.C. J. Am.
D. C.; Shore, V. C. Nature 1960, 185, 422.
[I-12] Edwards, A.M.; Arrowsmith, C.H.; Christendat, D.; Dharamsi, A.; Friesen, J.D.; Greenblatt, J.F.; Vedadi, M. Nature struct. Biol. 2000, 7, 970.
[I-13] Claverie, J.-M.; Monchois, V.; Audic, S.; Poirot, O.; Abergel, C. Comb. Chem. High
Throu. Screen. 2002, 5, 2002.
[I-14] Brizuela, L.; Braun, P.; LaBaer, J. Mol. Biol. Parasit. 2001, 118, 155.
[I-15] Holz, C.; Hesse, O.; Bolotina, N.; Stahl, U.; Lang, C. Protein Exp. Puri. 2002, 25, 372. [I-16] Lesley, S.A. Protein Exp. Puri. 2001, 22, 159.
[I-17] Hendrickson, W.A.; Horton, J.R.; Murthy, H.M.; Pahler, A.; Smith, J.L Basic life Sci.
1989, 51, 317.
[I-18] Hendrickson, W.A; Horton, J.R.; LeMaster, D.M. EMBO Jounal 1990, 9, 1665. [I-19] Garman, E. Acta Crystallogr.Sect. D 1999. 55, 1641.
[I-20] Rupp, B.; Segelke, B.W.; Krupka, H.I.; Lekin, T.P.; Scha fer, J.; Zemla, A.; Toppani, D.; Snell, G.; Earnest, T. Acta Crystallogr.Sect. D 2002. 58, 1514.
[I-21] Karain, W.I.; Bourenkov, G.P.; Blume, H.; Bartunik, H.D. Acta Crystallogr.Sect. D 2002.
58, 1519.
[I-22] Muchmore, S.W.; Olson, J.; Jones, R.; Pan, J.; Blum, M.; Greer, J.; Merrick, S.M.; Magdalinos, P.; Nienaber, V.L. Structure 2000, 8, 243.
[I-23] Manuel, J. and Ruiz, G. J. Struct. Biol. 2003, 142, 22.
[I-24] Arakawa T. and Timasheff, S. N. Biochemistry, 1984, 23, 5912.
[I-25] Larson, S. B.; Day, J. S.; Cudney, R.; McPherson, A. Acta Crystallogr.Sect. D 2007. 63, 310.
[I-26] Galkin, O. and Vekilov, P. G. J. Cryst. Growth 2001, 232, 63.
[I-27] Hammadi, Z.; Astier, J. P.; Morin, R.; Veesler, S. Cryst. Growth Des. 2007, 7, 1472. [I-28] Taleb, M.; Didierjean, C.; Jelsch, C.; Mangeot, J. P.; Capelle, B.; Aubry, A. J. Cryst.
Growth 1999, 200, 575.
[I-29] Penkova, A.; Gliko, O.; Dimitrov, I. L.; Hodjaoglu, F. V.; Nanev, C.; Velilov, P. G. J.
Cryst. Growth 2005, 275, e1527.
[I-30] Wakayama, N. I. Cryst. Growth Des. 2003, 3, 17.
[I-31] Astier, J. P.; Veesler, S.; Boistelle, R. Acta Crystallogr.Sect. D 1998. 54, 703. [I-32] Moreno, A.; Sazaki, G. J. Cryst. Growth 2004, 264, 438.
[I-33] Sazaki, G..; Yoshida, E.; Komatsu, H.; Nakada, T.; Miyashita, S.; Watanabe, K. J. Cryst.
Growth 1997, 173, 231.
[I-34] Sazaki, G.; Moreno, A.; Nakajima, K. J. Cryst. Growth 2004, 262, 499.
[I-35] Snell, E. H.; Judge, R. A.; Crawford, L.; Forsythe, E. L.; Pusey, M. L.; Sportiello, M.; Todd, P.; Bellamy, H.; Lovelace, J.; Cassanto, J. M.; Borgstahl, G. E. O. Cryst. Growth Des.
2001, 1, 151.
[I-36] Adachi, H.; Takano, K.; Hosokawa, Y.; Inoue, T.; Mori, Y.; Matsumura, H.; Yoshimura, M.; Tsunaka, Y.; Morikawa, S.; Kanaya, S.; Masuhara, H.; Kai, Y. and Sasaki, T., Jpn. J. Appl.
Phys., 2003, 42, 798.
[I-37] Adachi, H.; Murakami, S.; Niino, A.; Matsumura, H.; Takano, K.; Inoue, T.; Mori, Y. ; Yamaguchi, A. and Sasaki, T., Jpn. J. Appl. Phys., 2004, 43, 1376.
[I-38] Kakinouchi, K.; Adachi, H.; Matsumura, M.; Mori, Y.; Koga, Y.; Takano, K.; J. Cryst.
Growh., 2006, 292, 437.
[I-39] Nanev, C. N.; Penkova, A. J. Cryst. Growth 2001, 232, 285.
Scheme I-1 Flowchart of structure-based drug design
Target identification and validation
Structure determination
Structure-based drug design
Leading compounds
N H H O N H HO H N OH O PhS O N H H2N OH N H COOH OH OH NH Ac H COOEt H2N O N Ac H
Viracept
Relenza
Tamiflu
HIV protease
Neuraminidase
Structure
Drug name
Mechanism
Table 1 Drugs derived from structure-based approaches
O O N H N S O O NH2 OH O Ph
Agenerate
Table I-2 The way to structure determination and number of
proteins listed in Protein Data Bank (PDB)
X-ray
NMR
Total
43842
1821
1928
34
47625
6932
7
136
798
5991
40439
25
1748
1008
37658
Others
193
15
44
2
254
Total
Others Protein/NA complexes Nucleic AcidsProtein
Diffraction
Cloning
Expression
Solubilization
Purification
Crystallization
Scheme I-2 Structure solution procedure by X-ray
crystallography, showing steps as cloning, expression,
solubilization, purification, crystallization and diffraction.
0 0.2 0.4 0.6 0.8 1 1.2
Expression Solubilization Purification Crystallization Diffraction
BSGC MCSG SECSG
Figure I-1 The proportion of success on each experimental
stage. Statistical results of structure solution projects; BSCG
(circle), MCSG (triangle) and SECSG (square).
Figure I-3 The free energy change ( G) as a function of
cluster radius (r).
surface energy disadvantage
(4 r
2)
volume advantage
(- 4 r
3)
Figure I-4 Size of critical cluster (r*) dependence on
supersaturation ( ).
r*
1r*
2r*
31 2 3
Figure I-5 Crystal growth process from cluster forming to
crystal
condensation
growth
dissolution
Chapter II
Photochemically induced nucleation of
Hen egg white lysozyme
II Photochemically induced nucleation of Hen egg white lysozyme
II-1 Introduction
II-1-1 Hen egg white lysozyme
Hen egg white lysozyme is a 14.4 kDa lytic enzyme. Figure II-1 shows three dimensional structure of Hen egg white lysozyme (PDB ID: 193L). Its structure was described by David Chilton Phillips in 1965 when he got the first 2 Å resolution image [II-1]. Figure II-2 shows the molecular sequence of lysozyme with consisting of 129 amino residues and 4 disulfide bridges. The enzymatic function of lysozyme is illustrated in Scheme II-1 [II-2]. The function is attacking bacterial cell walls by catalyzing hydrolysis of 1,4-beta-linkages between N-acetylmuramic acid and N-acetyl-D-glucosamine residues in a peptidoglycan and between N-acetyl-D-glucosamine residues in chitodextrins. The amino acid side chains glutamic acid 35 (Glu35) and aspartate 52 (Asp52) have been found to be critical to the activity of this enzyme. Glu35 acts as a proton donor to the glycosidic bond, cleaving the C-O bond in the substrate, whilst Asp52 acts as a nucleophile to generate a glycosyl enzyme intermediate. The glycosyl enzyme intermediate then reacts with a water molecule, to give the product of hydrolysis and leaving the enzyme unchanged.
Lysozyme is widely used as a model system of protein for crystal graphic and photochemical studies because it is easily available.
II-1-2 Previous works of light induced nucleation of lysozyme
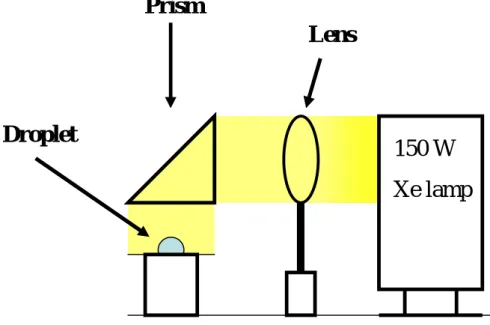
M. Terao and T. Okutsu reported that hen egg white lysozyme crystallization was enhanced by light irradiation [II-3]. In our laboratory, T. Okutsu et al. have investigated the photochemically induced nucleation of protein [II-4 - 7]. In past study, lysozyme solution was prepared for crystallization; 0.7 M NaCl containing 30 mg ml-1 lysozyme in 0.1 M sodium acetate buffer solution at pH 4.5. Figure II-3 shows light irradiation set up for hanging drop
crystallization. The white light from 150 W Xe lamp irradiated to 10 l droplet on the slide grass for 0 to 60 s. The light beam was parallelized go through a lens then vertically reflected to droplet by using prism. Figure II-4 shows the crystallization frequencies in one droplet changing irradiation time. They fitted the experimental crystal distribution with a Poisson law (Figure II-5). Up to 30 s of irradiation time, the experimental crystal distribution was well-fitted by a Poisson law, and they noted a significant discrepancy for an irradiation time of 60 s. This discrepancy was observed as saturation in the variation of the mean number of crystals in one droplet as a function of irradiation time, shown in Figure II-5. They concluded that nucleation frequencies are increased with increasing in irradiation time up to 30 s.
In parallel, to test wavelength dependence in this phenomenon, they selected different wavelengths of the Xe lamp emission (280, 300, and 400 nm) with a monochromator. The bandwidth of the 280, 300, and 400 nm light is ±5 nm. These wavelengths correspond to maximum (280 nm), edge (300 nm), and no (400 nm) absorption for lysozyme (Figure II-6 (a)). For these experiments, the irradiation time was increased up to 210 s because the light intensity decreases due to wavelength selection by a monochromator. Results are presented in Figure II-6 (b); the numbers of crystals are highly correlated with the absorption spectrum of lysozyme: no effect of irradiation at 400 nm on the nucleation of lysozyme and an increase of the nucleation frequency for irradiation at 280 and 300 nm, respectively. A maximum is observed at 280 nm. Because the absorption spectrum produces electronic transition of lysozyme, they conclude that light-induced nucleation was a photochemical process associated with electronic transitions.
Photoirradiation is known to cause denaturation of lysozyme. The activities were measured by the ML method. Figure II-7 shows photoirradiation time dependence of enzymatic activity of lysozyme. Irradiation times are 0, 30, 60, 120, and 180 s. The activity did not change until
unchanged enzyme activity up to 30 s irradiation suggests the presence of a long-lived intermediate before lysozyme denaturation. This intermediate is assumed to play a significant role in nucleation and denaturation of lysozyme and is probably able to go back to lysozyme or to produce denaturated lysozyme by absorbing another photon.
To confirm the presence of this intermediate, the enzyme activity was measured for different irradiation light intensities. Figure II-8 (a) shows the evolution of the lysozyme activity obtained by the ML method for 120 s irradiation as a function of light intensity. The activity did not change linearly with irradiation intensity but is well-fitted by a parabolic law as shown in Figure II-8 (a). Figure II-8 (b) shows the logarithmic plot of the deactivation against light intensity. The slope of the logarithmic plots is 1.4 ± 0.6, which indicates that the deactivation took place by a one-photon process and by a two-photon process. They, here, pay attention to the two-photon deactivation process. Two types of photochemical two-photon processes are known; one occurs simultaneously with two-photon absorption and the other with stepwise photon absorption. Simultaneous two-photon absorption can be ruled out because the photon density of the Xe lamp is typically 108 times smaller than a pulsed laser, which induces simultaneous two-photon absorption. Stepwise two-photon deactivation suggests that denaturation occurs through an intermediate produced by one-photon absorption. From these result they concluded that lysozyme is stepwise denatured by photoirradiation, and expected that the mechanism of light induced the nucleation of lysozyme relate the photochemical intermediate. To summarize, they propose the one-photon-induced nucleation mechanism in Scheme II-2 [II-3, 4].
In this Chapter II, the mechanism of photochemically induced nucleation of lysozyme was investigated. To clarify the photochemical properties of lysozyme, electronic spectra measurements were carried out. To observe the progress of photochemical reaction by UV light irradiation, the generation of white turbidity was carried out on the slide glass. To avoid
non-photochemical effect on the crystallization by use of light irradiation, novel crystallization technique liquid-seeding was developed. To identify the photochemical intermediate of lysozyme in Scheme II-2, transient absorption experiments were carried out. To consider the mechanism of photochemically induced nucleation, enzymatic activity measurements with scavenging the intermediate using visible light irradiation and crystallization experiments with using scavenging technique were carried out. To detect the dimer as a photochemical product, SDS-PAGE was carried out.
II-2 Experimental section
II-2-1 Sample preparation and experimental apparatus
Hen egg white lysozyme was purchased from Seikagaku (6 times recrystallized lot E02Z04) and was used without further purification. Sodium acetate trihydrate, acetic acid, sodium chloride, L-tryptophan, L-tyrosine and L-phenylalanine, all of them GR-grade, were purchased from Wako pure chemical. Sodium acetate trihydrate and acetic acid were dissolved in ultra-pure water (Milli pore, Milli-Q) and used as a buffer solution: NaAc buffer, 50 mM pH 4.3. Prepared buffer solution was adjusted pH by digital pH meter (model 15, Fisher Scientific). Buffer solutions were used for sample preparation and carried out at room temperature. The concentration of lysozyme solution was determined using an extinction coefficient of 2.64 ml mg-1 cm-1 at 280 nm [II-8]. Absorption and emission spectra were recorded on a spectrometer (Hitachi U-3300) and a fluorescence spectrometer (Hitachi F-4500).
II-2-2 Light irradiation
The light source used for the preparation of irradiation samples and in the photochemically induced nucleation experiments, was a xenon short arc lamp (USHIO UXL-300D, 300 W). Figure II-9 shows UV light irradiation apparatus. The light beam from the lamp was passed through water (light pass length = 20 mm), to cut the near-infrared radiation, and a quartz lens (f =100 mm, 50 mm diameter), which focused to the entrance slit of monochrometor (JASCO, CT-10). Figure II-10 shows radiation spectra from a 300 W Xe lamp (dotted line) through a monochromator at 280 nm (broken line). The light beam was extracted at 280 nm, which was used to directly irradiate sample solution in the cell. Figure II-11 shows the apparatus for two-color light irradiation experiments. The light beam from a 500 W Xe lamp (USHIO UXL-500D, 500 W) was cut off under 350 nm UV radiation using a cut off filter and visible
light (Vis) beam was extracted. The Vis irradiation apparatus was set up co-axial at anti position to UV irradiation apparatus.
II-2-3 Crystallization Experiment
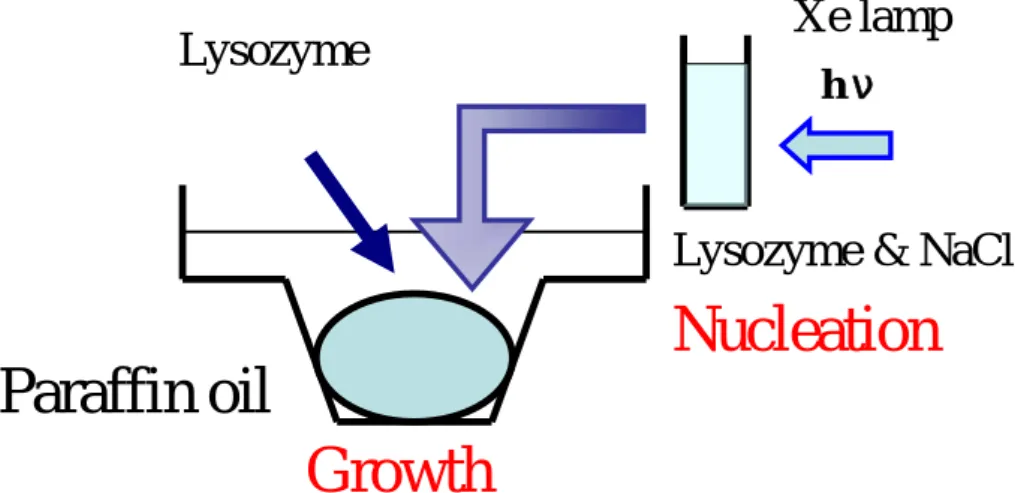
Crystallization Experiments were carried out in incubation room at 20 ºC. The microbatch crystallization experiments were carried out in a 72-wells microbatch plate, purchased from Hampton Research. The microbatch plate was covered with paraffin oil before adding the droplets. Figure II-12 shows liquid-seeding technique. As a seed solution, sodium chloride in buffer solution was mixed with lysozyme then irradiated. The seed solution was dropped on the plate then lysozyme solution was dropped and mixed by micropipette at 20 ºC. To avoid vapor diffusion from sample solution trough paraffin oil to out of plate, the plate was sealed by silicone glees. The prepared microbatch plate was stored at 22 ºC.
II-2-4 Transient absorption measurements
For transient absorption measurements of lysozyme and its aromatic amino residues, a Nd3+:YAG laser (Lotis, 30 ns fwhm, 3 mJ pulse-1, 10 Hz) was used as an excitation light source at 266 nm. Figure II-13 shows transient absorption spectra measurement setup. The samples were flowed through a quartz cell with a flow rate of ca. 40 mL min-1. The produced intermediates by the excitation laser absorb the white light through a water (light pass length = 3 mm) from a 500 W xenon short ark lamp. The transient signals were detected by a photomultiplier tube. The output signals were measured by a digital oscilloscope (Sony Tektronix TDS380P) and transferred to a personal computer.
II-2-5 Enzymatic activity measurements by ML methods
Activity of the lysozyme solution was determined by Micrococcus lysodeikticus (luteus) cell assay test (ML method). This assay is based on the decrease of absorption at 450 nm when the cells are digested. The experimental procedure was described in the literature [II-9].
Micrococcus lysodeikticus (lot 052K8618) was purchased from Sigma industry. Lytic activity
was performed with suitable aliquots of the diluted lysozyme solution (0.1 mL completed to 10 mL of water) in the reaction mixture (0.25 mg of dried Micrococcus lysodeikticus cells per milliliter of 40 mM sodium phosphate buffer, pH 7.0). I recorded the decrease in optical density of the turbid cell suspension at 450 nm with a spectrophotometer (Hitachi U-3300). Mean values of the activities at different concentrations of lysozyme were determined. The assays were linear over 5 min at room temperature. The specific activity of the lysozyme solution was determined to be 51 000 U g-1.
II-2-6 SDS-PAGE experiment
The SDS-PAGE experiment was carried out using a slab minigel electrophoresis unit (Nihon Eido, NA-1020, CN-1010) with 15% resolving and 0.05% concentrating gels. Tris-Gly buffer solution (containing 0.4% SDS) was used as the electrode solution. Five l of the sample solution were loaded onto each lane of gel. The gel was impressed on power current at 8 mA for 3 h. The gel was stained silver stain kit from Wako pure chemical.
II-3 Results and Discussion
II-3-1 Steady state electronic spectra measurements
To clarify the photochemical properties of lysozyme, the electronic spectra of lysozyme, L-tryptophan (Trp), L-tyrosine (Tyr), L-phenylalanine (Phe) were measured. Figure II-14 shows the absorption and emission spectra of lysozyme (a), Trp (b), Tyr (c) and Phe (d). The absorption and emission spectra are indicated by dashed and solid line, respectively. Trp, Tyr and Phe are aromatic amino acids that are expected to participate in the photochemical reactions of lysozyme. Lysozyme and these amino acids in Figure II-4 exhibit fluorescence which wavelengths indicate the emission peak at (a) 340, (b) 350, (c) 310 and (d) 280 nm. The lysozyme (a) emission spectrum was identical to the region of (b) Trp emission spectra and differed from the (c) Tyr and (d) Phe emissions. These results suggest that the emmision of lysozyme is ascribable to excited state of Trp. Lysozyme emission is known to consist of the emission from excited Trp, which is partly generated through intermolecular energy transfer from Try, Phe and Trp to 62nd Trp residue [II-10 - 12]. The lysozyme molecule contains six Trp, three Tyr and three Phe residues as aromatic residues (Figure II-1 and II-2). Since the Trp appears at a longer wavelength than that of Tyr and Phe, the excited state energy of Trp showed lower than those of Tyr and Phe. If the Tyr or Phe residual absorbs a photon, the excited state energy can be transferred to 62nd Trp residue through intramolecular Förster-type energy transfer.
II-3-2 Slide grass test
To observe the progress of photochemical reaction by UV light irradiation, the generation of white turbidity was carried out on the slide glass. The lysozyme solutions were irradiated for 120 s by light from a Xe lamp; half of the solution was masked by a black paper. Figure II-15
indicated below the photographs. The lysozyme concentrations were adjusted at 30 mg ml-1. In the lysozyme solution without NaCl, no apparent change was observed in Figure II-15 (a), whereas in the solutions containing NaCl in Figure II-15 (b) and (c), white turbidity appeared in the irradiated part. It is observed that light irradiation of 30 mg mL-1 lysozyme solutions produces white turbidity in solution containing NaCl at 0.5 and 1.0 M. When the NaCl concentration was increased, the white turbidity was more marked. Because NaCl is known to act as a salting-out agent for lysozyme crystallization, the white turbidity is thought to be aggregates or nuclei of lysozyme. This experimental result suggests that Xe lamp irradiation induces aggregation or nucleation of lysozyme. In addition, when the solutions were observed under optical microscopy, no change (crystal growth and/or Oswald ripening) was noticed in the solution.
II-3-3 Development of crystallization technique
With going forward confirmation of the mechanism of crystallization enhancement by photochemical reaction, it is necessary to remove affects of non-photochemical reactions. Therefore novel crystallization technique was developed.
Here, two type crystallization methods in popular use are presented [I-1 - 3]. Figure II-16 shows hanging drop vapor diffusion crystallization set up (a) and its time profile of concentration in droplets (b). Figure II-17 shows oil batch crystallization set up (a) and its time profile of concentration in droplets (b). These method differ time profile of concentration in droplet. In the vapor diffusion method, both concentration of protein and precipitant in droplet is increased with doing vapor-liquid equilibrium between droplet and reservoir solution because reservoir solution has higher concentration of precipitant than droplet. At last, protein concentration in droplet is decreased to equilibrium when droplet solution reaches the nucleation region. In the batch crystallization method, only protein concentration is decreased
when nucleation occurred.
Previous crystallization technique for the photochemically induced nucleation of lysozyme had some problems. The hanging drop vapor diffusion method was used for the crystallization and directly irradiated to droplet on the circle slide grass [II-3]. In this case, spontaneous vapor diffusion from the droplet to atmosphere occurred during light irradiation and photon absorb only surface of droplet because the concentration of lysozyme is too high to directly irradiate. Unwished nucleation was occurred due to increase supersaturation by the spontaneous vapor diffusion. The unwished nucleation and photon-absorption on the surface of droplet complicated problem.
The developed the novel crystallization technique is used as seeding which separated nucleation from crystal growth process and we named it “liquid-seeding”. Figure II-12 shows liquid-seeding technique for photochemically induced nucleation of protein. The liquid-seeding technique separates two steps; nucleation and growth step were separated from the crystallization. Figure II-18 shows solution condition for photochemically induced nucleation of lysozyme using liquid-seeding technique, showing a (a) nucleation step and (b) growth step. The solid line in Figure II-18 shows solubility curve. In the nucleation step, lysozyme solution was prepared at metastable condition in sample cavity cell. UV light from Xe lamp is irradiated to the metastable solution which does not cause spontaneous nucleation. In the growth step, irradiated sample and pure lysozyme solutions are mixed on the batch plate covered with inert paraffin oil. To avoid the unwished nucleation by down in temperature, these experimental steps of liquid-seeding are carried out at 20 ºC then accomplished plate is stored at 22 ºC. I also checked the temperature rise of the solution during the irradiation. Figure II-19 shows the temperature change of the solution in the 1 cm × 1 cm × 4 cm dimension optical cell during the irradiation. Temperature raised from 22.22 to
during the irradiation, indicating that the heat of the solution is not responsible for the nucleation because up in the temperature decrease the supersaturation in seed solution.
Figure II-20 shows photographs of the droplets of irradiated solutions and pure lysozyme solution observed after 24 h. Irradiation time was 0 (a), 60 (b) and 180 s (c). In the droplets without irradiation, no crystal was observed in all the droplets. On the other hand, lysozyme crystals appeared in the droplet of irradiated solution. The number of crystal was increased with increasing in irradiation time. From these results, photochemically induced nucleation was confirmed.
For estimation of crystal quality using liquid-seeding technique, diffraction studies on the crystals were carried out at BL44B2, Spring-8 with ADSC Q210 as detector. In the crystallographic experiments, I used the samples without and with 60 s irradiation in nucleation step. Figure II-21 shows diffraction pattern of crystals of (a) without and (b) UV irradiated samples. The square in Figures was expanded below. The highest diffractions were up to (a) 1.55 and (b) 1.50 Å resolution. The space group of both crystals belonged to tetragonal P43212, with unit-cell dimensions of a = b = 78.86 or a = b = 78.81 and c = 37.01 Å.
These data are collected in Table II-1 and loss of crystal quality by damage of UV light irradiation is not observed.
These results proved that liquid-seeding technique for nucleation of lysozyme induces non-photochemical but photochemical affect and the crystal quality is not charge to common microbatch crystallization methods.
II-3-4 Transient absorption measurements
In order to identify the photochemical intermediate in Scheme II-2, transient absorption experiments were carried out. To avoid denaturation of lysozyme by a two-photon absorption mechanism, sample solutions were flowed rapidly (40 mL min-1) through a quartz small
cavity cell. Figure II-22 shows transient absorption spectra of (a) lysozyme, (b) Trp, (c) Tyr and (d) Phe in 50 mM NaAc buffer solution at room temperature. Spectra were recorded at 2 (dashed line) and 64 s (solid line) after laser flash. The concentrations of sample solutions were adjusted to the optical density of 1 by using a flow-cell of 4 mm optical pass length. The triplet state was not detected because the sample solutions were saturated with O2 gas [II-13].
These spectra are compared, the transient species of (a) lysozyme having peak at 520 nm are good similar with (b) Trp and differ from (c) Tyr having typically phenoxyl radical peak around 400 nm [II-14] or (d) Phe having no peak in this wavelength region. These results were in good agreement with reports [II-14 - 21]. The spectra of (a) lysozyme are composed of two different species; one is a fast-decaying species having absorption in the range 300-600 nm the lifetime of which was shorter than 4 s. The fast-decaying species is assigned as disulfide (-S-S-) electron adducts from the literature [II-23]. The other is a long-lived species having absorption peaks at 520 nm. Transient species having absorption peak at 520 nm of Trp corresponded to neutral tryptophanyl radical (Trp●) existing radical center on the nitrogen atom of indole-ring [II-17].
The generation of residual Trp● in lysozyme by photochemical reaction illustrated in Scheme II-3. The initial photochemical reaction of tryptophan residue of lysozyme is photo-ionization leading to radical cation (Trp●+) and hydrated electron. The Trp● of the residual of lysozyme formed from Trp●+ by deprotonation [II-19, 24]. The ejected electron is immediately hydrated, which is called hydrated electron showing absorption band over 650 nm [II-15]. Trp●+ has absorption peak at 570 nm.
The decay time profile at 520 nm is shown in Figure II-23. Half-lifetime of the intermediate of lysozyme and Trp were estimated to be 1 ms and 100 s. The reciprocal plot of the time profile showed a linear dependence, the intermediate species decays through a second-order
occur within the intermediate half-lifetime [II-25]. It was reported that 10 lysozyme molecules are necessary to form the critical nucleus in the same condition [I-24]. And if one collision per 250 collisions can form dimer (radical-radical), rate determining step on the nucleation can over because the smallest cluster of 2 molecules was surface/volume disadvantage is the largest.
Thus intermediate of lysozyme in Scheme II-2 having absorption peak at 520 nm confirms residual tryptophanyl radical (Trp●). Transient absorption results suggests the following mechanism; the produced residual Trp● by UV light irradiation produced covalently bonded dimer, which forms cluster and finally grows to crystal (SchemeII-4).
II-3-5 Enzymatic activity measurements
To confirm the mechanism in Scheme II-4, I performed with quenching Trp● by visible (Vis) light irradiation from Xe lamp. It is expected that UV light produces residual Trp● which is able to be scavenged by Vis light. Figure II-24 shows the absorption spectra of lysozyme (solid line) and residual Trp● (dashed line), showing regions of UV (a) and Vis radiation (b) from Xe lamp. These spectra show to be able to selectively irradiate to the species.
Before carrying out crystallization experiments, I confirmed to be able to quench Trp● by Vis light irradiation from 500 W Xe lamp. For quenching experiments by UV and Vis light irradiation, enzyme activity measurements by ML method as a function of irradiation time with two colors of excitation were carried out. Figure II-25 shows the variation in enzyme activity against irradiation time for different experimental conditions. Irradiation by visible (>350 nm) light did not change enzyme activity up to 300 s of irradiation (within the experimental error). As obtained previously [II-3], 20 for the first 30 s of irradiation by UV (280 ±10 nm) light, there was no change in enzyme activity, which decreased when irradiation continued longer than 30 s. And last, irradiation by both UV (280 ±10 nm) and
visible (>350 nm) lights decreased greatly enzyme activity after 10 s of irradiation. The facts that the intermediate has an absorption band ranging from 300 to 600 nm, that irradiation by visible light alone does not denature lysozyme, and that coupling UV to visible light increases the efficiency of the denaturation process of lysozyme suggests the two-step deactivation denaturation mechanism in Scheme II-2. From these results, it is confirmed that two-color light irradiation is controllable to existence of the residual Trp●.
II-3-6 Crystallization by two-color irradiation
To confirm whether the intermediate induces nucleation as suggested in Scheme II-2. It was simultaneously carried out that four nucleation experiments with or without irradiation by UV (280 nm) or visible (>350 nm) light or a combination of the two as described as liquid-seeding technique. Figure 30 shows photographs of droplets under paraffin oil. Figure II-26 (a) shows a droplet without irradiation. No crystal appears in the droplet. Figure II-26 (b) shows a droplet by UV (280 nm) light irradiation for 120 s. The irradiation time is somewhat longer than the experiments without using monochromated light because the light intensity decreases by passing through the monochromator. As a result, several crystals appear in the droplet, indicating that photochemically induced nucleation has occurred. Figure II-26 (c) shows a droplet by visible (>350 nm) light irradiation. Lysozyme has no absorption in the visible (>350 nm) wavelength range; this result is the same as the result without irradiation. Finally, Figure II-26 (d) shows simultaneous irradiation by UV (280 nm) and visible (>350 nm) lights. No crystal was observed in any droplets, confirming the quenching of the intermediate by visible light. These results confirm the photochemically induced nucleation mechanism proposed in Scheme II-2.
I expect that the residual Trp● produced by UV light irradiation causes dimerization, because general organic compound’s radicals are dimerized themselves. To detect the covalently bonded dimer of lysozyme, SDS-PAGE was carried out. In parallel consideration, amount of the dimer was estimated from results of transient absorption spectrum measurement.
Figure II-27 shows a photograph of gel. Lanes 1 to 4 are lysozyme solution containing NaCl (0.1 M), Lane 5 is lysozyme dimer, Lanes 6 to 9 are lysozyme solution without NaCl and Lane 10 is molecular weight marker from 14 to 79 kDa. These sample solutions were irradiated by UV-light for 0, 15, 30, and 60 min. Irradiation times are indicated under the lane numbers. The commercially available lysozyme contains dimer at 28 kDa (0.5%), unknown impurity at 18 kDa (1.0%) and small amount of other impurities smaller than 14 kDa. Lane 1 is the solution without irradiation which indicates mainly lysozyme monomer at 14 kDa and smaller weight bands. The dimer and 18 kDa impurity bands were not detected in this experimental condition. Lanes 2 4 show irradiated samples. The dimer band and the smaller weight band intensity were increased with increasing in irradiation time. Samples without NaCl were also loaded onto the same gel. Lanes 6 to 9 show irradiated samples. In this case, smaller band intensity was increased but the dimer band intensity was hardly increased by the irradiation. Since, NaCl is known to take place salting-out which reduces electrostatic repulsion between charged lysozyme (+11 at pH 4.5), covalent-bonded dimer formation becomes to happen in the presence of NaCl.
To estimate amount of the produced dimer by photochemical reaction and relationship of liquid-seeding technique, amount of residual Trp● in lysozyme was calculated from the radiation energy of Xe lamp and transient absorption spectrum of lysozyme. In Figure II-22 (a), optical density of residual Trp● at 520 nm showed approximately 2.0×10⁻³. It has been reported that the molecular extinction coefficient of Trp● at 520 nm is 1800 M-1 cm-1. From these values, 1.1 M of residual Trp● was produced by laser pulse irradiation at 3 mJ.
Assuming the produced residual Trp● is perfectly dimerized, 3 mJ laser pulse produces 0.55 M of covalently bonded dimer. From radiation spectrum of Xe lamp through a monochromator (broken line) in Figure II-10, we calculated that radiation intensity in 250~300 nm wavelength region is approximately 150 W. The UV light irradiation for 60 s with using monochromator provides photon energy of approximately 9 mJ then 1.65 M of dimer was produced. The liquid-seeding technique was used equal volume of precipitant solution containing the dimer (1.4 M NaCl and 1 mg ml-1 lysozyme) and pure lysozyme (39 mg ml-1). From these calculation results, we estimated that the dimer in a droplet with irradiation 60 s existed about 1.2% and crystal appeared in droplet. T. Matsui et al. reported impurity effect of lysozyme. The addition of chemically modified F-lysozyme (approximately 0.17%) having fluorescent probe of functional group as an impurity drastically promoted nucleation [II-27].
It is concluded that the promoted nucleation of lysozyme was heterogeneous nucleation by addition of impurity. The result of SDS-PAGE suggests that covalently bonded dimer was produced from residual Trp● by UV light irradiation and the dimer induces nucleation of lysozyme.
II-4 Summary
In this Chapter, the mechanism of the photochemically induced nucleation of Hen egg white lysozyme was investigated. In lysozyme system, photochemically induced nucleation brought about the photochemical reaction of the Trp residual groups instead.
It was confirmed that the chromophore of lysozyme is tryptophan. The white turbidity of lysozyme was produced by UV light irradiation. This result suggested aggregation of lysozyme was enhanced by UV light irradiation.
nucleation of lysozyme, liquid-seeding was developed. In crystallization experiments by use of liquid-seeding technique, the number of crystals increased with increasing in irradiation time for 0, 60 and 180 s. The lattice parameters of crystal obtained by use of liquid-seeding technique dose not change to lattice parameter by use of common microbatch crystallization method.
The intermediate in Scheme II-2 is produced by one-photon absorption, and resulting residual tryptophanyl radical. The lytic activity of coupling UV to Vis light irradiated solution increased the efficiency of denaturation process than only UV light irradiated solution. The results of activity measurements suggested that the two-step denaturation mechanism relate residual tryptophanyl radical. From crystallization experiments, lysozyme crystallization was enhanced by only UV light irradiation but not enhanced by coupling UV to Vis light irradiation. The photograph of SDS-PAGE showed that covalently bonded dimer (Mw = 28 kDa) was produced by UV light irradiation.
It is summarized in Scheme II-4 that covalently bonded dimer was produced from residual tryptophanyl radical by photochemical reaction then it plays important role as the smallest cluster in early stage of nucleation process.
II-5 References
[II-1] Blake, C. C.; Koenig, D. F.; Mair, G.A.; North, A. C.; Phillips, D. C.; Sarma, V. R.
Nature 1965, 206, 757.
[II-2] Baird, S.D.; Hefford, M.A.; Johnson, D.A.; Sung, W.L.; Yaguchi, M.; Seligy, V.L.
Biochem. Biophys. Res. Commu. 1990, 169, 1035.
[II-3] Okutsu, T.; Furuta, K.; Terao, M.; Hiratsuka, H.; Yamano, A.; Ferté, N. and Veesler, S.,
Cryst. Growth Des. 2005, 5, 1393.
[II-4] Veesler, S.; Furuta, K.; Horiuchi, H.; Ferté, N. and Okutsu, T., Cryst. Growth Des, 2006,
6, 1631.
[II-5] Okutsu, T.; Sato, M.; Furuta, K.; Fujinaga, Y.; Horota, K.; Obi, K.; Horiuchi, H. and Hiratsuka, H. Chem. Lett. 2007, 36, 338.
[II-6] Furuta, K.; Okutsu, T.; Sazaki, G.; Yoshizaki, I.; Horiuchi, H.; Shimizu, T.; Yamamoto, M.; Tanaka, Y. and Hiroshi, H., Chem. Lett, 2007, 36, 714.
[II-7] Okutsu, T.; Sugiyama, K.; Furuta, K.; Watanabe, I.; Mori, H.; Obi, K.; Horota, K.; Horiuchi, H.; Sazaki, G.; Veesler, S. and Hiroshi, H., J. Photochem. Photobiol, A 2007, 190, 88.
[II-8] Thomas, B. R.; Vekilov, P. G.; Rosenberger, F. Acta Crystallogr. D 1996, 52, 776. [II-9] Sophianopoulas, A.; J., Rhodes, C. K.; Holcomb, D. N.; Varhold, K. E. J. Biol. Chem.
1962, 273, 1107.
[II-10] Imoto, T.; Föster, L. S.; Rupley, J. A. and Tanaka, F., Proc. Nat. Acad. Sci. USA. 1972,
69, 1151.
[II-11] Birks, J. B., Photophysics of Aromatic Molecules, Wiley-intersciences (a division of John Wiley & Sons Ltd.), 1970.
[II-13] Turro, N. J., Modern Molecular Photochemistry, The Benjamin/Cummings Publishing,
1978.
[II-14] Bent, D.V. and Hayon, E., J. Am. Chem. Soc. 1975, 97, 2599.
[II-15] Grossweiner, L. I.; Kaluskar, A. G. and Baugher, J. F., Int. J. Radiat. Biol. 1976, 29, 1. [II-16] Bryant, F. D.; Santus, R.; Grossweiner, L. I. J. Phys. Chem. 1975, 79, 2711.
[II-17] Feitelson, J.; Hayon, E. and Treinin, A., J. Am. Chem. Soc. 1973, 95, 1025. [II-18] Grossweiner, L. I. and Usui, Y., Phtochem. Photobiol. 1971, 13, 195. [II-19] Bent, D.V. and Hayon, E., J. Am. Chem. Soc. 1975, 97, 2612.
[II-20] Peter, S. S.; Olga, A. S.; Yuri, P. T. Chem. Phys. Lett. 2004, 391, 44. [II-21] Baugher, J. F. and Grossweiner, L. I. J. Phys. Chem. 1977, 81, 1349. [II-22] Ries-Kautt, M. M. and Ducruix, A. F. J. Biol. Chem. 1989, 264, 745.
[II-23] El Hanine L. C.; Conte, D.; Jacquot, J.-P.; Houee-Levin, C. Biochemistry 2000, 39, 9295.
[II-24] Tsentalovich, Y. P.; Snytnikova, O. A.; Sagdeev, R. Z. J.Photochem.Photobiol. A:Chem.
2004. 162. 371.
[II-25] Nesmelova, I. V. and Fedotov, V. D. Mol. Biol. 1998, 32, 549. [II-26] Joschek, H.-I., Grossweiner, L.I. J. Am. Chem. Soc. 1966, 88, 3261.
[II-27] Matsui, T.; Sazaki, G.; Hondoh, H.; Matsuura, Y.; Nakada, T.; Nakajima, K. J. Cryst.
Figure II-1 Hen egg white lysozyme three dimensional
structure
Figure II-2 Molecular sequence of lysozyme
KVFGRCELAA AMKRHGLDNY
RGYSLGNWVC AAKFESNFNT
QA T NR N T DGS T DY G I LQI NS
RWWCNDGRTP GSRNLCNIPC
S A L L S S D I T A S V N C A K K I V S
DGNGMNAWVA WRNRCKGTDV
QAWIRGCRL
150 W
Xe lamp
Lens
Prism
Droplet
Figure II-3 Irradiation setup for light induced nucleation,
using previous work
0 s
10 s
20 s
30 s
60 s
Number of crystals
in one droplet
0
0.5
1
0
0.5
0
0.5
0
0.5
0
1
2
3
4
5
6
0
0.5
N
o
rm
a
li
ze
d
F
re
q
u
en
cy
Figure II-4 The crystallization frequencies in one droplet
changing irradiation time.
0
20
40
60
80
0
1
2
irradiation time /s
M ea n n u m b er o f cr y st al s in o n e d ro p le tFigure II-5 Mean number of crystals in one droplet function
as irradiation time.
Figure II-6 Absorption spectrum of lysozyme (a) and
photographs of hanging droplets observed after 48 h.
Irradiation wavelengths are indicated below the photographs.
280nm
300nm
400nm
without irradiation
1mm 1mm 1mm 1mm 1.4 1.2 1.0 0.8 0.6 0.4 0.2 0.0 -0.2 a bs or pt io n 500 450 400 350 300 250 200 wave length(nm)(a)
(b)
0
50
100
150
200
2
3
4
5
6
[ 10
4]
Irradiation time /s
A
ct
iv
it
y
/
U
Figure II-7 Light irradiation action spectra of lysozyme.
Enzymatic activity
Figure II-8 Enzymatic activity (semi log) and power
dependence
Lysozyme
intermediate
denatured
species
h
h
n Lysozyme
Nucleus
cluster
Scheme II-2 Expected mechanism of photochemically
induced nucleation of lysozyme
Figure II-9 UV light irradiation apparatus
MC
300 W
Xe lamp
Lens
Figure II-10 Radiation spectra from 300 W Xe lamp (dotted
line) through a monochromator at 280 nm (broken line).
Wavelength / nm
200
150
100
50
0
In
te
n
si
ty
/
W
c
m
-2n
m
-1700
600
500
400
300
200
Figure II-11 Irradiation apparatus for two-color excitation
experiments
MC
300 W
Xe lamp
500 W
Xe lamp
Lens
Sample
Lysozyme & NaCl
Nucleation
Growth
hν
Lysozyme
Xe lamp
Paraffin oil
Nd
3+:YAG
Xe lamp
MC
PMT
OSC
PC
Lens
1
Figure II-13 Experimental setup for transient absorption
Lens
1
Lens
Figure II-14 Steady state electronic spectra of lysozyme and
aromatic amino acids
1.0 0.8 0.6 0.4 0.2 0.0 500 450 400 350 300 250 1.0 0.0 1.0 0.8 0.6 0.4 0.2 0.0 1.0 0.0 1.0 0.8 0.6 0.4 0.2 0.0 1.0 0.0 1.0 0.8 0.6 0.4 0.2 0.0 1.0 0.0
Wavelength / nm
A
b
so
rb
an
ce
In
te
n
si
ty
(
a.
u
.)
Figure II-15 Photographs of the lysozyme solution. NaCl
concentrations in solution indicate below the photographs.
(a)
(b)
Droplet
Reservoir
Figure II-16 Hanging drop vapor diffusion crystallization set
up (a) and its time profile of concentration in droplets (b)
Undersaturation
Supersaturation
Concentration of Salt
C o n ce n tr a ti o n o f p ro te inUndersaturation
Supersaturation
Concentration of Salt
C o n ce n tr a ti o n o f p ro te inDroplet
Paraffin oil
Figure II-17 Oil batch crystallization set up (a) and its time
profile of concentration in droplets (b)
Undersaturation
Supersaturation
0.5
1
1.5
10
010
1[NaCl] / mol dm
-3[
L
y
so
zy
m
e
]
/
m
g
m
L
-1(b)
(a)
Figure II-18 Crystallization condition for photochemically
induced nucleation of lysozyme using liquid-seeding
technique. Concentration of sample solution for nucleation
(a) and crystal growth (b)
Figure II-19 Temperature changing of sample solution by
light irradiation
Figure II-20 Photographs of the droplets irradiated solution
and pure lysozyme solution observed at 24 h after.
Irradiation time was 0 (a), 60 (b) and 180 s (c).
1 mm
1 mm
1 mm
(a)
(b)
Figure II-21 Diffraction pattern of crystals of without (a)
and UV irradiated samples (b).
Without irradiation
UV irradiation
Table II-1 Diffraction date of crystals with using
liquid-seeding technique
Cyrstal
without UV UV
Space goup
P4
3
2
1
2 P4
3
2
1
2
Cell
a, b (Å) 78.89
78.86
c (Å) 37.01
37.01
Resolution (Å)
1.55 1.50
Rmerge (%)
7.8 (31.6) 8.4 (27.6)
I/gigma(I)
23.1 (8.5) 23.0 (9.5)
Redundancy
13.6 (13.6) 13.5 (13.7)
Completeness (%) 100.0 (100.0) 100.0 (100.0)
Figure II-22 Transient absorption spectra of lysozyme (a),
Trp (b), Tyr (c) and Phe (d).
(a)
(c)
(b)
(d)
4
3
2
1
0
x
1
0
-3700
600
500
400
8
6
4
2
0
x
1
0
-34
3
2
1
0
x
1
0
-34
3
2
1
0
x
1
0
-3A
b
so
rb
a
n
ce
Wavelength / nm
Scheme II-3 Reaction of Residual tryptophanyl radical
max= 520 nm
1/2= 1 ms
H2N H N O HO H2N N O HOh
+
e
-+
H
+
H2N H N O HO H2N H N O HO4 x 1 0- 3 3 2 1 0 T i m e / s 1/2
= 1 ms
8 0 0 x 1 0- 6 6 0 0 4 0 0 2 0 0 0 T i m e / s 1/2= 100 s
Figure II-23 Decay time profile of intermediate of lysozyme
(a) and tryptophan (b) at 520 nm. Half-lifetime (
1/2) of
lysozyme and tryptophan indicate approximately 1 ms and
100 s, respectively.
(a)
(b)
Lysozyme
Lysozyme
intermediate
Trp・
denatured
species
UV
VIS
n Lysozyme
Nucleus
cluster
Scheme II-4 photochemically induced nucleation of
lysozyme
Figure II-24 the absorption spectra of lysozyme (solid line)
and residual Trp
●(dashed line), showing regions of UV (a)
and Vis radiation (b) from Xe lamp.
Lysozyme Transient absorption