Systematic Immunohistochemical Profiling of 378 Brain Tumors with 37 Antibodies Using Tissue Microarray Technology Hayato Ikota, Sawako Kinjo, Hideaki Yokoo, Yoichi Nakazato Department of Human Pathology, Gunma University Graduate School of Medicine, 33922 Showamachi, Maebashi, 3718511 Gunma, Japan. Email: [email protected]u.ac.jp Tel.: +81272207972 Fax: +81272207978 Acknowledgment This work was supported in part by a GrantinAid for Scientific Research (B) (no. 15300113) from the Japanese Ministry of Education, Culture, Sports, Science and Technology (to Y.N.).
Abstract
We performed a systematic immunohistochemical study on 378 brain tumors using tissue microarray (TMA) technology. The aim of this study was to find new diagnostic biomarkers using antibodies established in our laboratory. Our TMA consisted of a grid of 1.5mm cores that were extracted from individual donor blocks. We carried out immunostaining with 37 antibodies. Staining for each antibody was scored using a threepoint system. We used hierarchical clustering analysis to interpret these data, which resulted in separation of all the brain tumors into seven groups. Although there were some exceptions, cases with the same histological diagnosis were generally grouped together. We then carried out statistical analyses to find the most useful antibody for grouping of brain tumors, and several antibodies were revealed to have significant immunostaining features. Ten antibodies (glial fibrillary acidic protein (GFAP), Olig2, vimentin, epithelial membrane antigen (EMA), cytokeratin (AE1/AE3), alphainternexin, nestin, PP5, aquaporin4 (AQP4) M13d and AQP4M13e) discriminated between astrocytomas and oligodendroglial tumors. Six antibodies (EMA, AE1/AE3, TUJ1, nestin, neurofilament proteinMH (NFMH) and GP1) showed significant differences between highgrade and lowgrade gliomas. Our new antibodies that are considered to have potential diagnostic utility are Olig2, PP5 and GP1. We conclude that TMA technology is highly useful in verifying the usefulness of newly established antibodies for brain tumor research.
Introduction TMAs are powerful, largescale tools for tumor analyses [11]. TMA technology has markedly increased the number of available specimens for tumor research. TMAs have thus far been used for highthroughput studies of various tumors. Since staining conditions for all the tissue cores on each TMA slide are identical, technical variation among cases is avoided. Furthermore, the use of reagents is minimized, which leads to costeffectiveness. TMA technology is still being developed and improved. At the present time, TMAs are used mainly for immunohistochemical studies. However, some reports applied TMAs to deoxyribonucleic acid (DNA) fluorescence in situ hybridization with paraffin blocks (TMAFISH) [2, 5, 9]. Furthermore, recent studies showed that TMAs could also be used for frozen tissue [4, 13] and cell line [6] analyses. Brain tumors include many histological subtypes. In the current World Health Organization (WHO) classification, brain tumors are classified into as many as 126 types [10]. Since therapeutic strategies and prognosis are highly dependent on the histological type of tumors, accurate pathological diagnosis is indispensable. Therefore, pathologists need to have adequate knowledge of the morphological and immunohistochemical features of brain tumors. Hitherto, there have been few systematic immunohistochemical studies of brain tumors. The considerable pathological variety and rareness (8 to 10 cases occur per 100,000 Japanese per year) of brain tumors seem to have prevented largescale analyses. Some publications applied TMAs to brain tumor profiling [5, 15, 20,
22, 23]; however, there is still a need for the analysis of larger numbers of cases and antibodies. For research, the development and application of new diagnostic biomarkers are necessary. Our laboratory has been establishing many polyclonal and monoclonal antibodies against nervous system antigens [1, 1719, 2631]. We are already using some of these antibodies for routine pathological diagnosis. However, the expression patterns of our biomarkers among many types of brain tumors remain unknown. In this study, we applied TMA technology for exhaustive immunoprofiling of brain tumors in an attempt to find new biomarkers with diagnostic utility using our homemade antibodies.
Materials and methods Case materials Paraffin blocks of primary brain tumors were acquired from the pathology archives of Gunma University Hospital and Kantoh Neurosurgical Hospital. The cases dated from 1991 to 2005. Tumors with marked heatdegeneration at surgery or marked calcification were not used. The total of 378 cases listed in Table 1 were selected to build a TMA. TMA construction TMA production started with a pathological review of all the selected cases. A representative area of each tumor was marked both on a hematoxylineosin section and an original donor block. One tissue core of 1.5mm diameter was extracted from the marked area of each donor block using an arraying machine (MTA1, Beecher Instruments, Sun Prairie, WI, USA). The core was fit into a vertical hole that was bored in a recipient paraffin block in advance. This sampling procedure for each case was repeated many times to produce TMA blocks. Finally, recipient blocks were incubated at 60°C for 5 minutes, pressed on a hot plate for 3 minutes and cooled in ice water. This procedure made the paraffin melt and congeal, which enabled tissue cores to integrate into the recipient block, and thereby prevented tissue core loss at sectioning. Sections of 3µm thickness were cut from each array block. Unused sections were stored at minus 80°C with paraffin coating.
Immunohistochemistry Immunohistochemical studies were carried out by a streptavidinbiotinimmunoperoxidase technique (Histofine SABPO kit; Nichirei, Tokyo, Japan). The 37 antibodies listed in Table 2 were used in this study. Various antibodies we had established in our laboratory were chosen, including antibodies against pinealocytes (PP1 to PP7), pineal interstitial cells (PI1, PI2 and PX1), perivascular cells of the central nervous system (GP1, GP2), Schwann cells (Schwann/2E), protoplasmic astrocytes (PRAS1, PRAS4), oligodendrocytes (Olig2) and neurofilament protein (NF1D). Sections of 3µm thickness were deparaffinized, rehydrated, treated with 0.3% H2O2 in methanol for 30 minutes to inhibit endogenous peroxidase activity and rinsed in phosphate buffered saline (PBS). For antigen retrieval before staining with some antibodies, pretreatment was performed as follows: (i) autoclaving in PBS or 0.1 mol/L citrate buffer pH 6.0 for 10 min at 121°C; (ii) pronase treatment (0.05% protease, type XXVII, Sigma, St. Louis, MO, USA) for 5 min at room temperature. Sections were then covered with 10% normal goat or rabbit serum for 30 minutes. Sections were overlaid with optimally diluted antibodies, and incubated overnight in a moist chamber at 4°C. Sections were washed three times with PBS, and incubated with biotinylated antimouse or antirabbit IgG for 30 minutes. After three washes in PBS, sections were incubated with peroxidaseconjugated streptavidin for 30 minutes. Finally,
peroxidase activity was visualized by incubation with 0.02% 3.3'diaminobenzidine4HCl (Wako Pure Chemicals, Osaka, Japan) in 0.05 mol/L TrisHCl buffer (pH 7.6) containing 0.005% H2O2 for 5 minutes. Sections were washed, counterstained lightly with hematoxylin, dehydrated and mounted. Incubation, except that with primary antibodies, was carried out at room temperature. Scoring of immunostaining data Each tumor core was considered to be suitable for evaluation if the tumor occupied more than 10% of the core area. The scoring system was as follows: score 0 (less than 5% of tumor cells stained), score 1 (525% of tumor cells stained) and score 2 (more than 25% of tumor cells stained). Data analysis and statistics Staining data were recorded directly into Microsoft Excel worksheets and reformatted into a suitable form for hierarchical clustering analysis. This reformat procedure was performed using the TMADeconvoluter program, freely available at the Stanford TMA software website (http://genomewww.stanford.edu/TMA/) [14]. The hierarchical clustering analysis was performed with the Cluster program and the results were visualized using the TreeView program. Both the Cluster program and the TreeView program were freely available at the Eisen Lab website
(http://rana.lbl.gov/EisenSoftware.htm). Clustered data were displayed with antibodies on the horizontal axis and cases on the vertical axis. Cases or antibodies were placed next to each other if they had the most similar expression profiles. Length of branches was inversely proportional to profiling similarity. Cases with 50% or less interpretable scores were excluded from the hierarchical clustering analysis. Staining results were compared between two tumor types by Fisher’s exact test using StatView for Windows version 5.0 software (SAS Institute Inc.). A significant difference was declared if the p value was less than 0.05. If multiple significance tests are conducted in parallel, inflation of the overall Type1 error may occur. Because the significance level is assumed to be 5% in this study, 5% of results are expected to be false positives. Usually, no strict correction of significance levels of the single tests is carried out in statistical analyses of TMA data. Among all conducted tests, a certain amount of false positive results is accepted.
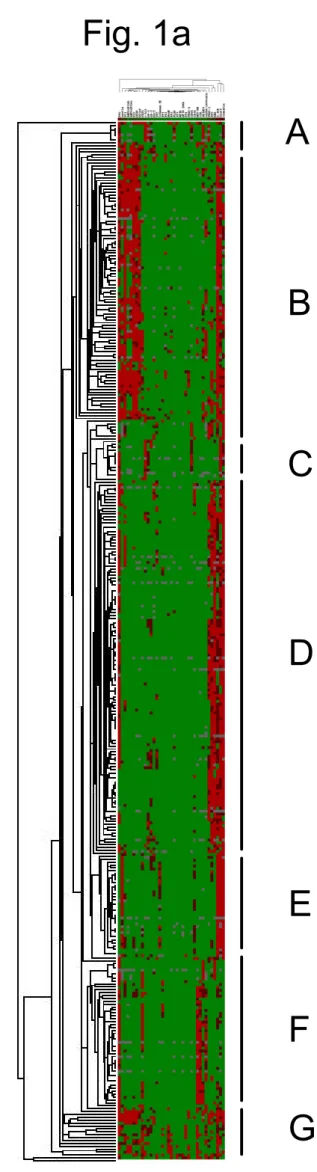
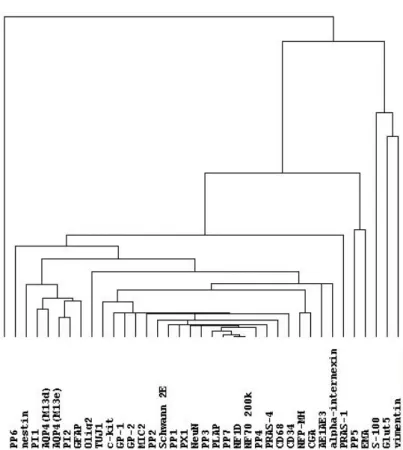
Results Hierarchical clustering analysis Nineteen cases were excluded from the hierarchical clustering analysis because their data were insufficient (i.e., interpretable scores were 50% or less). The reasons for insufficient data were mainly inadequate tumor volume or tissue core loss at sectioning. The clustering of the remaining 359 cases produced seven groups, group A to group G (Fig. 1a). All the groups included more than one histological type. The number of cases and the major histological type in each group were respectively as follows: Group A (8 cases, germinomas); Group B (95 cases, gliomas); Group C (19 cases, malignant lymphomas and hemangioblastomas); Group D (131 cases, meningiomas); Group E (37 cases, schwannomas); Group F (50 cases, pituitary adenomas); Group G (19 cases, medulloblastomas, neuronal tumors and pineal parenchymal tumors). Occasionally, cases with the same histological diagnosis were placed into different groups. For example, two of 126 meningiomas were placed into group C or E, not into group D. The other results of clustering were as follows. Ependymomas were placed into group B. Hemangiopericytomas were placed into group F. Craniopharyngiomas were placed into group F. In the same way, clustering analysis of the 37 antibodies used for immunohistochemistry was carried out (Fig. 1b). The length of branches above antibody names in the figure is inversely proportional to the profiling similarity. Two biomarkers with a close relationship were placed next to each other (for
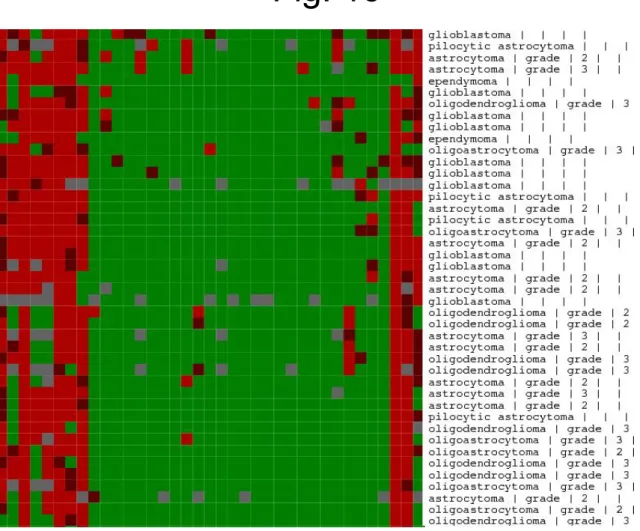
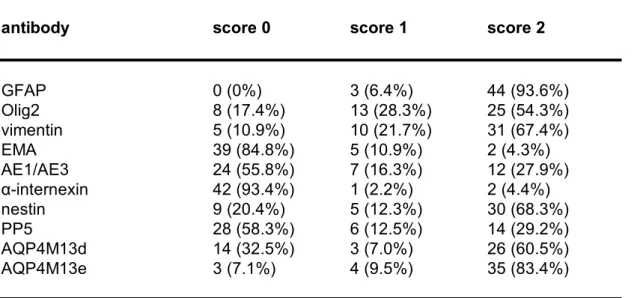
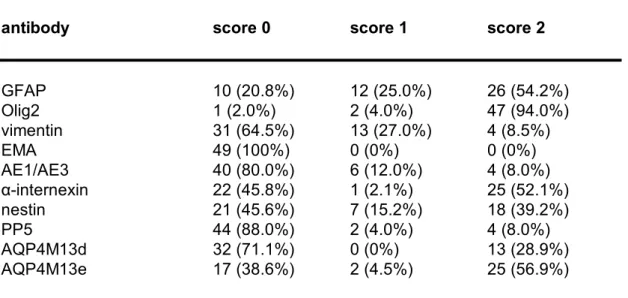
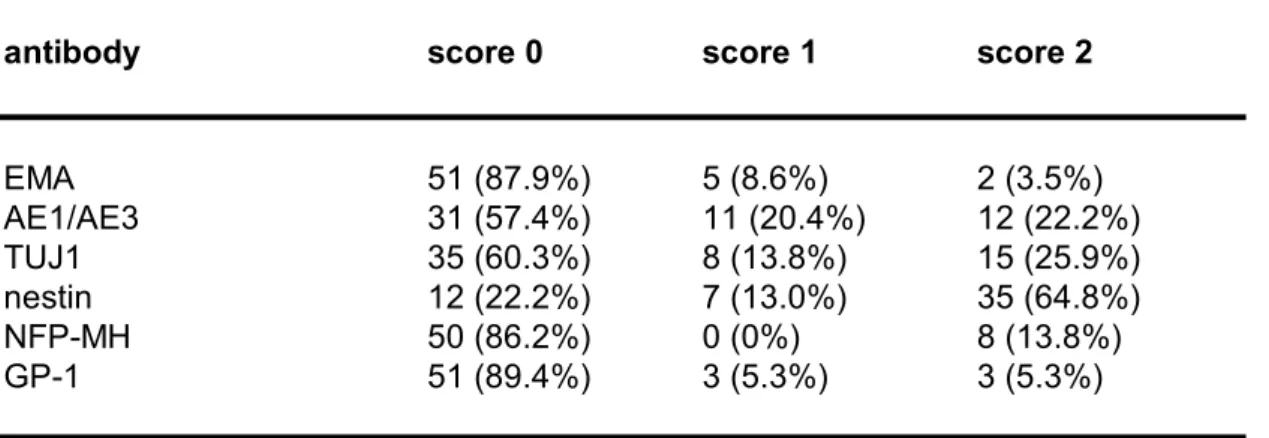
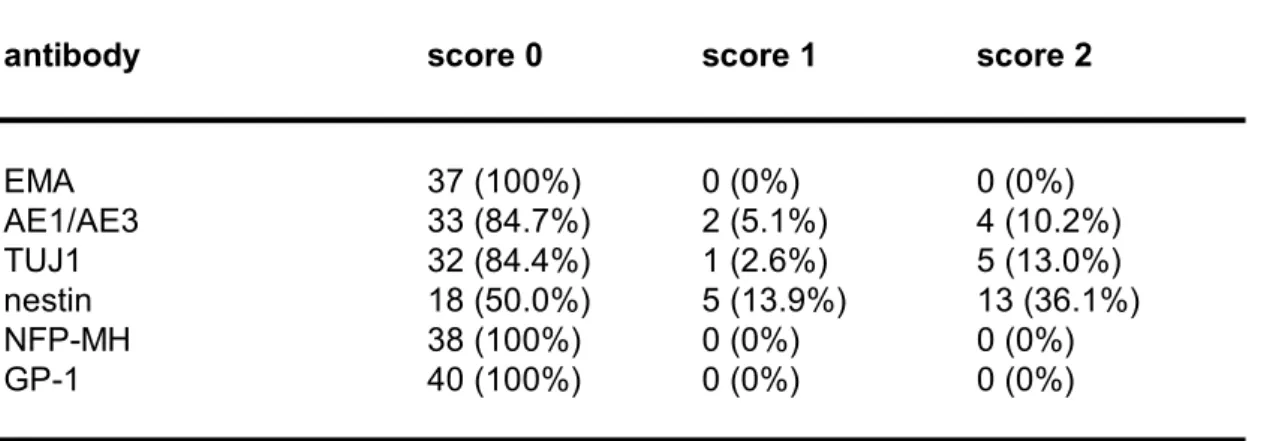
example, NF (neurofilament) 1D and NF70/200k, antibodies against neurofilament protein). However, two adjacent antibodies did not always have a close relationship (for example, Glut5 and vimentin). A closeup view of the clustering analysis results for a part of group B is shown in Figure 1c. Gliomas of different histological types are placed therein. However, gliomas were not completely divided in accord with their cell of origin or grade. To find biomarkers that further differentiate gliomas, we adopted another method, statistical analysis. Statistical analysis All the gliomas were examined in terms of cell of origin and grade. Ten antibodies (glial fibrillary acidic protein (GFAP), Olig2, vimentin, epithelial membrane antigen (EMA), cytokeratin (AE1/AE3), alphainternexin, nestin, PP5, aquaporin4 (AQP4) M13d and AQP4M13e) significantly distinguished between astrocytomas and oligodendrogliomas. The expression of these biomarkers in astrocytic tumors and oligodendroglial tumors is shown in Table 3a, Fig. 2a and Table 3b, Fig. 2b, respectively (p values are indicated in Table 3c). Six antibodies (EMA, AE1/AE3, neuronal class III beta tubulin clone TUJ1, nestin, neurofilament proteinMH (NFMH) and GP1) differentiated between highgrade (WHO grade III or IV) and lowgrade (WHO grade I or II) gliomas. The expression of these biomarkers in highgrade gliomas and lowgrade gliomas is shown in Table 4a, Fig. 3a and Table 4b, Fig. 3b, respectively (p
Discussion We applied TMA for exhaustive profiling of a wide variety of brain tumors. As a result, we observed distinct immunostaining features of many tumors with many antibodies. Although the significance of the expression profiles requires further evaluation, based on the present findings, some antibodies we had obtained previously in our laboratory were concluded to be useful for the subtyping or grading of gliomas. These antibodies were Olig2, PP5 and GP1. In addition, the immunostaining results we obtained using common antibodies were in accord with previous findings (for example, schwannomas were positive for S100). We also found that some antibodies yielded unexpected clues with potential diagnostic usefulness. Additional experiments will be needed to draw definitive conclusions regarding these issues. We will report those expression profiles in more detail in another publication. For discrimination between astrocytoma and oligodroglial tumors, 10 biomarkers were useful (Table 3, Fig. 2). The distinction between these two types of tumors is important because oligodendroglial tumors show chemosensitivity to PCV (procarbazine, CCNU and vincristine) therapy and more favorable clinical behavior. A previous study showed that the expression of several oligodendroglial lineage genes was frequently increased in gliomas; nevertheless, no significant expression difference between astrocytic tumors and oligodendroglial tumors was detected [21]. In our study, we found Olig2 to be useful for distinguishing between these tumors. Olig2 recognizes a
transcription factor that regulates oligodendroglial development. Olig2 labels the nuclei of oligodendrocytes and oligodendroglial tumors, and besides, astrocytomas are also positive for Olig2 to a lesser extent [31]. Our data are in accord with that finding. Another useful antibody we had obtained was PP5, an antibody against human pineal antigens. Our laboratory has established seven antibodies (PP1 to PP7) that react with pinealocytes and three antibodies (PI1, PI2 and PX1) that react with pineal interstitial cells [19, 27]. Other biomarkers that discriminated between astrocytoma and oligodroglial tumors included vimentin and AQP4. It has been shown that antivimentin immunoreactivity was seen in gliomas and ependymomas, but not in neuronal tumors [12]. Our data obtained in the current study were in accord with those findings. Additionally, vimentin was expressed more frequently in astrocytic tumors than in oligodendroglial tumors. AQP4 is a water channel protein that is highly expressed in astrocytes. AQP4 is considered to be involved in regulating water flux between vascular and glial compartments, and responsible for the development of vasogenic edema in the brain. It has been shown that AQP4 and potassium channel protein Kir4.1 are redistributed in glioblastomas [24], and low and highgrade gliomas [25], respectively. However, our study showed significant differences of the expression profiles of AQP4 between astrocytic tumors and oligodendroglial tumors rather than between high and lowgrade gliomas. The grade of gliomas markedly affects patients’ prognosis. This work
showed that 6 biomarkers were significantly able to discriminate between highgrade and lowgrade gliomas (Table 4, Fig. 3). Interestingly, most of these biomarkers were epithelial markers (EMA, AE1/AE3) or neuronal markers (TUJ1, nestin and NFPMH). Gliomas tend to have EMA immunoreactivity more frequently as their grade becomes higher [16]. In addition, according to a previous study, TUJ1 immunoreactivity is significantly stronger in highgrade astrocytomas than in lowgrade astrocytomas [8]. Our data were in accord with those findings. The antigens reacting with GP1 were expressed more frequently in highgrade gliomas than in lowgrade gliomas. GP1 is an antibody that recognizes lysosomal proteins in the perivascular cells of the central nervous system [30]. In this study, we addressed two technical issues related to TMA technology, namely, TMA construction and data analyses. One limitation of TMAs is that a given tissue core is not always representative of the whole tumor. To overcome this problem, in most recent studies, multiple 0.6mmcores were prepared at tissue extraction. We attached importance to consistent, reproducible histological observation rather than to examining a number of cores mounted on one recipient block. To ensure the adequate representation of diverse brain tumor tissues, we extracted one 1.5mm core instead of two or three 0.6mm cores. Although the tissue of a 1.5mm core is 6.25 times as large as that of a 0.6mm core ((1.5/0.6) 2 =6.25), the tissue loss in each donor block was trivial. We paid careful attention to the conditions for storage of unused TMA sections.
A previous study demonstrated that each core on a section lost its antigenicity within 1 month if a section was stored unwrapped in room air [3]. That study indicated that frozenstorage of slides with paraffin coating held antigenicity loss to a minimum. Using this method, we obtained satisfactory immunostaining results even 10 months after sectioning. The other issue was the strategy for data analysis. Because the amount of data generated by TMAs is huge, novel analytic methods are required. In fact, the number of our data points was 13986 (378 cases with 37 antibodies). To analyze this enormous amount of data, we performed twostep analysis. First, we qualitatively classified all the valuable cases with a hierarchical clustering analysis. Then, we quantitatively and statistically evaluated tumor marker expression. This procedure allowed both a simple overview and detailed investigation of all the cases. Finally, we demonstrated that TMA technology was a powerful method for brain tumor profiling. On the other hand, TMAs generate such a large amount of data that it is necessary to verify and analyze the data carefully. TMAs can be used for identifying prognostic parameters. For example, loss of heterozygosity on chromosome arms 1p and 19q is predictive of chemosensitivity and longer survival in oligodendroglial tumors [7]. This genetic alteration can be found by TMA with FISH. Our findings demonstrated that TMA technology is highly useful for assessing the usefulness of newly established antibodies for brain tumor research.
Acknowledgments We thank Professor K. Takata (Department of Anatomy and Cell Biology, Gunma University Graduate School of Medicine) for providing antibodies (AQP4M13d and AQP4M13e). We also thank Dr M. Kamiya for helpful advice. The technical assistance of Ms A. Kumagai and Ms A. Kodama is gratefully acknowledged.
References 1. Arai H, Hirato J, Nakazato Y (1998) A novel marker of Schwann cells and myelin of the peripheral nervous system. Pathol Int 48:206214 2. Bubendorf L, Kononen J, Koivisto P, Schraml P, Moch H, Gasser TC, Willi N, Mihatsch MJ, Sauter G, Kallioniemi OP (1999) Survey of gene amplifications during prostate cancer progression by highthroughout fluorescence in situ hybridization on tissue microarrays. Cancer Res 59:803806. Erratum in: Cancer Res 59:1388 3. DiVito KA, Charette LA, Rimm DL, Camp RL (2004) Longterm preservation of antigenicity on tissue microarrays. Lab Invest 84:10711078 4. Fejzo MS, Slamon DJ (2001) Frozen tumor tissue microarray technology for analysis of tumor RNA, DNA, and proteins. Am J Pathol 159:16451650 5. Fuller CE, Wang H, Zhang W, Fuller GN, Perry A (2002) Highthroughput molecular profiling of highgrade astrocytomas: the utility of fluorescence in situ hybridization on tissue microarrays (TMAFISH). J Neuropathol Exp Neurol 61:10781084 6. Hoos A, CordonCardo C (2001) Tissue microarray profiling of cancer specimens and cell lines: opportunities and limitations. Lab Invest 81:13311338 7. Jeuken JW, von Deimling A, Wesseling P (2004) Molecular pathogenesis of oligodendroglial tumors. J Neurooncol 70:161181 8. Katsetos CD, Del Valle L, Geddes JF, Assimakopoulou M, Legido A, Boyd JC,Balin B, Parikh NA, Maraziotis T, de Chadarevian JP, Varakis JN, Matsas R, SpanoA, Frankfurter A, Herman MM, Khalili K (2001) Aberrant localization of the neuronal class III betatubulin in astrocytomas. Arch Pathol Lab Med 125:613624 9. Kay E, O'Grady A, Morgan JM, Wozniak S, Jasani B (2004) Use of tissue microarray for interlaboratory validation of HER2immunocytochemical and FISH testing. J Clin Pathol 57:11401144 10. Kleihues P, Cavenee WK. (2000) World Health Organization Classification of Tumours, Pathology and Genetics of Tumours of the Nervous System. IARC, Lyon 11. Kononen J, Bubendorf L, Kallioniemi A, Barlund M, Schraml P, Leighton S, Torhorst J, Mihatsch MJ, Sauter G, Kallioniemi OP (1998) Tissue microarrays for highthroughput molecular profiling of tumor specimens. Nat Med 4:844847 12. Koperek O, Gelpi E, Birner P, Haberler C, Budka H, Hainfellner JA (2004) Value and limits of immunohistochemistry in differential diagnosis of clear cell primary brain tumors. Acta Neuropathol (Berl) 108:2430 13. Kylaniemi M, Koskinen M, Karhunen P, Rantala I, Peltola J, Haapasalo H (2004) A novel frozen brain tissue array technique: immunohistochemical detection of neuronal paraneoplastic autoantibodies. Neuropathol Appl Neurobiol 30:3945
de Rijn M (2002) Software tools for highthroughput analysis and archiving of immunohistochemistry staining data obtained with tissue microarrays. Am J Pathol 161:15571565 15. Lusis EA, Chicoine MR, Perry A (2005) High throughput screening of meningioma biomarkers using a tissue microarray. J Neurooncol 73:219223 16. Hasselblatt M, Paulus W (2003) Sensitivity and specificity of epithelial membrane antigen staining patterns in ependymomas. Acta Neuropathol (Berl) 106:385388 17. Nakazato Y, Ishizeki J, Takahashi K, Yamaguchi H, Kamei T, Mori T (1982) Localization of S100 protein and glial fibrillary acidic proteinrelated antigen in pleomorphic adenoma of the salivary glands. Lab Invest 46:621626 18. Nakazato Y, Sasaki A, Hirato J, Ishida Y (1987) Monoclonal antibodies which recognize phosphorylated and nonphosphorylated epitopes of neurofilament protein. Biomed Res 8:369376 19. Nakazato Y, Hirato J, Sasaki A, Yokoo H, Arai H, Yamane Y, Jyunki S (2002) Differential labeling of the pinealocytes and pineal interstitial cells by a series of monoclonal antibodies to human pineal body. Neuropathology 22:2633 20. Neben K, Korshunov A, Benner A, Wrobel G, Hahn M, Kokocinski F, Golanov A, Joos S, Lichter P (2004) Microarraybased screening for molecular markers in medulloblastoma revealed STK15 as independent predictor for survival. Cancer Res 64:31033111 21. Riemenschneider MJ, Koy TH, Reifenberger G (2004) Expression of oligodendrocyte lineage genes in oligodendroglial and astrocytic gliomas. Acta Neuropathol (Berl) 107:277282 22. Sallinen SL, Sallinen PK, Haapasalo HK, Helin HJ, Helen PT, Schraml P, Kallioniemi OP, Kononen J (2000) Identification of differentially expressed genes in human gliomas by DNA microarray and tissue chip techniques. Cancer Res 60:66176622 23. Tynninen O, Carpen O, Jaaskelainen J, Paavonen T, Paetau A (2004) Ezrin expression in tissue microarray of primary and recurrent gliomas. Neuropathol Appl Neurobiol 30:472477 24. Warth A, Kroger S, Wolburg H (2004) Redistribution of aquaporin4 in human glioblastoma correlates with loss ofagrin immunoreactivity from brain capillary basal laminae. Acta Neuropathol (Berl) 107:311318 25. Warth A, Mittelbronn M, Wolburg H (2005) Redistribution of the water channel protein aquaporin4 and the K+ channel protein Kir4.1 differs in low and highgrade human brain tumors. Acta Neuropathol (Berl) 109:41826 26. Yamaguchi H (1980) Studies on the immunohistochemical localization of S100 and glial fibrillary acidic proteins in the rat nervous system and in human brain tumors. No To Shinkei 32:10551064 (in Japanese) 27. Yamane Y, Mena H, Nakazato Y (2002) Immunohistochemical characterization of pineal parenchymal tumors using novel monoclonal antibodies to the pineal body. Neuropathology 22:6676 28. Yokoo H, Nakazato Y (1996) A monoclonal antibody that recognizes a
(Berl) 91:2330 29. Yokoo H, Sasaki A, Hirato J, Nakazato Y (1996) A monoclonal antibody that specifically recognizes a novel mitochondrial protein of human astrocytes. J Neuropathol Exp Neurol 55:716721 30. Yokoo H, Sasaki A, Hirato J, Nakazato Y (1998) Immunohistochemical characterization of two novel monoclonal antibodies that recognize human perivascular cells of the central nervous system and macrophage subsets. Pathol Int 48:678688 31. Yokoo H, Nobusawa S, Takebayashi H, Ikenaka K, Isoda K, Kamiya M, Sasaki A, Hirato J, Nakazato Y (2004) Antihuman Olig2 antibody as a useful immunohistochemical marker of normal oligodendrocytes and gliomas. Am J Pathol 164:17171725
Figure legends
Figure 1. Hierarchical clustering analysis of brain tumors. (a) A fulllength view of the diagram with cases on the vertical axis and antibodies on the
horizontal axis. (b) A closeup view of the diagram of antibody clustering. Two biomarkers with a close relationship are located next to each other. (c) A closeup view of the diagram of clustering analysis of a part of group B. Red, brown, and green cubes indicate score 2, score 1 and score 0 respectively. Grey cubes indicate the absence of staining data. Gliomas of different cell of origin or grade are placed together herein. Figure 2. Comparison of marker expression patterns between astrocytic tumors (a) and oligodendroglial tumors (b). Threestep bars show percentages of tumors positive for each antibody. Red, brown, and green bars indicate score 2, score 1 and score 0 respectively. All the antibodies here showed significant immunostaining (p<0.05). Figure 3. Comparison of marker expression patterns between highgrade gliomas (a) and lowgrade gliomas (b). All the antibodies here showed significant immunostaining (p<0.05).
Fig. 1a
Ikota et al.
A
B
C
D
E
F
a
Fig. 1b
Ikota et al.
b
0% 20% 40% 60% 80% 100% GFAP Olig 2 vimen tin EMA AE1/ AE3 α-inte rnex in nesti n PP5 AQP4 M13 d AQP4 M13 e Astro c ytic tu mo rs 0% 20% 40% 60% 80% 100% GFAP Olig 2 vimen tin EMA AE1/ AE3 tern exin nestin PP5 P4M 13d P4M1 3e O ligo de n dro glial tu mo rs
Fig. 2
Ikota et al.
b
a
0% 20% 40% 60% 80% 100% A in H 1 Low-gra de gliomas 0% 20% 40% 60% 80% 100% EMA AE1 /AE3 TUJ1 nesti n NF P-MH GP-1 H igh - grade glio mas
Fig. 3
Ikota et al.
b
a
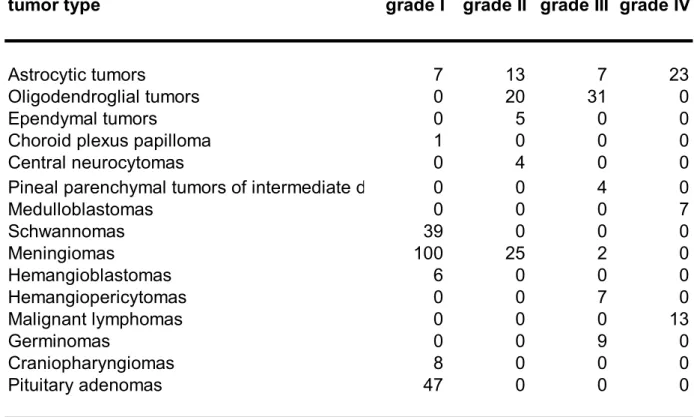
Table 1. Brain tumors in the tissue microarray block
tumor type grade I grade II grade III grade IV
Astrocytic tumors 7 13 7 23 Oligodendroglial tumors 0 20 31 0 Ependymal tumors 0 5 0 0 Choroid plexus papilloma 1 0 0 0 Central neurocytomas 0 4 0 0 Pineal parenchymal tumors of intermediate differentiation 0 0 4 0 Medulloblastomas 0 0 0 7 Schwannomas 39 0 0 0 Meningiomas 100 25 2 0 Hemangioblastomas 6 0 0 0 Hemangiopericytomas 0 0 7 0 Malignant lymphomas 0 0 0 13 Germinomas 0 0 9 0 Craniopharyngiomas 8 0 0 0 Pituitary adenomas 47 0 0 0 a We clinicopathologically interpreted pineal parenchymal tumors of intermediate differentiation as grade III tumors.
Antibody Source Category Dilution Antigen retrieval method
PP1 Ref 19 Mouse monoclonal 1:10 None PP2 Ref 19 Mouse monoclonal 1:50 None PP3 Ref 19 Mouse monoclonal 1:300 None PP4 Ref 19 Mouse monoclonal 1:50 None PP5 Ref 19 Mouse monoclonal 1:800 None PP6 Ref 19 Mouse monoclonal 1:200 None PP7 Ref 19 Mouse monoclonal 1:100 None PI1 Ref 19 Mouse monoclonal 1:100 None PI2 Ref 19 Mouse monoclonal 1:100 None PX1 Ref 19 Mouse monoclonal 1:10 None GP1 Ref 30 Mouse monoclonal 1:50 None GP2 Ref 30 Mouse monoclonal 1:100 None Schwann/2E Ref 1 Mouse monoclonal 1:50 None PRAS1 Ref 28 Mouse monoclonal 1:50 None PRAS4 Ref 29 Mouse monoclonal 1:50 None S100 Ref 26 Rabbit polyclonal 1:20000 None GFAP Ref 17 Rabbit polyclonal 1:10000 None
Olig2 Ref 31 Rabbit polyclonal 1:10000 Autoclaving (citrate buffer) NF1D Ref 18 Mouse monoclonal 1:50 None
NF70/200k SCYTEK, Logan Utah, USA Mouse monoclonal 1:50 None
NFMH Zymed, San Francisco, CA, USA Mouse monoclonal 1:5 Autoclaving (PBS) Chromogranin A DakoCytomation, Glostrup, Denmark Rabbit polyclonal 1:1000 None
αinternexin NOVOCASTRA, Newcastle upon Tyne, Mouse monoclonal 1:50 Autoclaving (citrate buffer) TUJ1 Covance Research Products, California, Mouse monoclonal 1:1500 None
Nestin IBL, Gunma, Japan Rabbit polyclonal 1:50 None vimentin DakoCytomation, Glostrup, Denmark Mouse monoclonal 1:200 None
ckit DakoCytomation Japan, Kyoto, Japan Rabbit polyclonal 1:50 Autoclaving (citrate buffer) AE1/AE3 Boehringer Mannheim Mouse monoclonal 1:500 Pronase
MIC2 DakoCytomation, Carpinteria, CA, USA Mouse monoclonal 1:50 None CD68 DakoCytomation, Glostrup, Denmark Mouse monoclonal 1:50 Pronase
NeuN Chemicon, Temecula, CA, USA Mouse monoclonal 1:1000 Autoclaving (citrate buffer) PLAP DakoCytomation, Glostrup, Denmark Rabbit polyclonal 1:1000 None
CD34 Nichirei Corporation, Tokyo, Japan Mouse monoclonal 1:200 None EMA DakoCytomation, Glostrup, Denmark Mouse monoclonal 1:100 None AQP4M13d Courtesy of Prof. K. Takata Rabbit polyclonal 1:4000 None AQP4M13e Courtesy of Prof. K. Takata Rabbit polyclonal 1:8000 None
Glut5 IBL, Gunma, Japan Rabbit polyclonal 1:400 Autoclaving (citrate buffer)
Antibodies: glial fibrillary acidic protein (GFAP); neurofilament (NF); neuronal class III beta tubulin clone TUJ1 (TUJ1);
placental alkaline phosphatase (PLAP); epithelial membrane antigen (EMA); aquaporin (AQP).
Table 3a. Biomarker expression in astrocytic tumors.
antibody score 0 score 1 score 2
GFAP 0 (0%) 3 (6.4%) 44 (93.6%) Olig2 8 (17.4%) 13 (28.3%) 25 (54.3%) vimentin 5 (10.9%) 10 (21.7%) 31 (67.4%) EMA 39 (84.8%) 5 (10.9%) 2 (4.3%) AE1/AE3 24 (55.8%) 7 (16.3%) 12 (27.9%) αinternexin 42 (93.4%) 1 (2.2%) 2 (4.4%) nestin 9 (20.4%) 5 (12.3%) 30 (68.3%) PP5 28 (58.3%) 6 (12.5%) 14 (29.2%) AQP4M13d 14 (32.5%) 3 (7.0%) 26 (60.5%) AQP4M13e 3 (7.1%) 4 (9.5%) 35 (83.4%) For antibody definitions, see Table 2.
Table 3b. Biomarker expression in oligodendroglial tumors.
antibody score 0 score 1 score 2
GFAP 10 (20.8%) 12 (25.0%) 26 (54.2%) Olig2 1 (2.0%) 2 (4.0%) 47 (94.0%) vimentin 31 (64.5%) 13 (27.0%) 4 (8.5%) EMA 49 (100%) 0 (0%) 0 (0%) AE1/AE3 40 (80.0%) 6 (12.0%) 4 (8.0%) αinternexin 22 (45.8%) 1 (2.1%) 25 (52.1%) nestin 21 (45.6%) 7 (15.2%) 18 (39.2%) PP5 44 (88.0%) 2 (4.0%) 4 (8.0%) AQP4M13d 32 (71.1%) 0 (0%) 13 (28.9%) AQP4M13e 17 (38.6%) 2 (4.5%) 25 (56.9%) For antibody definitions, see Table 2.
antibody p value GFAP 0.0012 Olig2 0.016 vimentin <0.0001 EMA 0.0374 AE1/AE3 0.0037 αinternexin <0.0001 nestin 0.0143 PP5 0.016 AQP4M13d 0.0006 AQP4M13e 0.0007 For antibody definitions, see Table 2. Table 3c. Useful antibodies for discrimination between astrocytic tumors and oligodendroglial tumors.
Table 4a. Biomarker expression in highgrade gliomas.
antibody score 0 score 1 score 2
EMA 51 (87.9%) 5 (8.6%) 2 (3.5%) AE1/AE3 31 (57.4%) 11 (20.4%) 12 (22.2%) TUJ1 35 (60.3%) 8 (13.8%) 15 (25.9%) nestin 12 (22.2%) 7 (13.0%) 35 (64.8%) NFPMH 50 (86.2%) 0 (0%) 8 (13.8%) GP1 51 (89.4%) 3 (5.3%) 3 (5.3%) For antibody definitions, see Table 2.
Table 4b. Biomarker expression in lowgrade gliomas.
antibody score 0 score 1 score 2
EMA 37 (100%) 0 (0%) 0 (0%) AE1/AE3 33 (84.7%) 2 (5.1%) 4 (10.2%) TUJ1 32 (84.4%) 1 (2.6%) 5 (13.0%) nestin 18 (50.0%) 5 (13.9%) 13 (36.1%) NFPMH 38 (100%) 0 (0%) 0 (0%) GP1 40 (100%) 0 (0%) 0 (0%) For antibody definitions, see Table 2.
Table 4c. Useful antibodies for discrimination between high and lowgrade gliomas. antibody p value EMA 0.0403 AE1/AE3 0.0064 TUJ1 0.0137 nestin 0.0113 NFPMH 0.0203 GP1 0.0406 For antibody definitions, see Table 2.