Barometer
Coefficients of H返h Latitude Neutron Monitors
Masahiko KuSUNOSE
Department of Information Science, Faculりof Science Kochi Uaiuersitv, Kochi 780, Japa几
Abstract:The
cosmic ray monitor is used to measure
the primary
cosmic ray intensity・
The counting rate of neutron monitor is affected by the atmospheric
pressure variation.
The amplitude
of the variation in the counting rate caused by the atmospheric
pressure is
usually larger than that of the primary
cosmic ray intensity. It is very important
to derive
a certain approprヽiatebarometer
coefficient to make a reliable correction of the counting
rate for the barometric
pressure. To decide the barometer
coefficients of the neutron
monitors, it is necessary to separate the intensity variations caused by the primary
cosmic
ray itself and that due to the pressure variation. To this end, we
adopted
the spherical
harmonic
analysis using the neutron
monitor
data from
about twenty
stations located in
the high latitude region where
the geomagnetic
cutoff rigidity is below
2.3 GV. The
primary
cosmic ray variations are removed
from
the observed data, and thus the residuals
are derived. Through
the study of the correlations between
the derived residual and
the
daily mean
pressures, reevaluation of the barometer coefficients was made by using
twelve-years data from January 1966 to December 1977.
The re-evaluated barometer
coefficients for every year were tabulated. The result shows that the re-evaluated
barometer
coefficients at a few stations are considerably deviated from
the conventionally
used coefficients. Further
analysis is made
0n the data observed at the selected eight
stations, where complete twelve-years data were available. As a result,it is found that the
long-term
variation of the revised barometer
coefficientsis correlated in positive sense
with that of the cosmic ray neutron intensity levels. The barometer
coefficient depends on
the cosmic ray neutron intensity. The dependence in the solar quiet period is stronger than
that in the solar active period. Using
the -riがdityspectrum
of the barometer
coefficient
and
the cosmic
ray
neutron
intensity at sea level,the dependence of the barometer
coefficient on the primary
spectrum
variation was
estimated by numerical calculation。
The result shows clearly that the variation rate of the barometer
coefficient against the
cosmic ray neutron intensity is influenced by the changes in the cutoff rigidity and in the
primary
spectrum.
Key
words : Cosmic
Ray, Neutron
Monitor,
Barometer
Coefficient.
1.
Introduction
1 0
Res. Rep. Kochi Univ. Vol.46
Most
of the primary
cosmic rays are the galactic cosmic rays arriving onthe top of the
earth's atmosphere
from
outside the earth, while the secondary ones areソthose
produced in
the air through nuclear interactions between the primary 姉smic ra沁∧andair nuclei. It is
well known
that most
parts of the primary
cosmicニ血y………jうarticles
wh:6砲ニhighest energy
amounts to the order of 1022 eV have their origins in the universe outside the solar system and a little ctニ)ntribution from the sun is recognized as the so-called solar cosmic rays with
energies of the order of 109 eV. ∧ ‥ 上
一〇n the travelling iourney ofトthe primaryレcosmic rayくparticlesしfromレt畑・outside of the solar system toward the earth, they usually sufferイrom various kinds of modulations such as scattering, degradation and deflection owing to the ordered or disordered interplanetary
magnetic field as well as the earth's magnetic field. AS□a result, cosmic ray intensity
variations observed on the earth are influencedレby
Time modulations of the
primary cosmic
ray
several………typesof modulations.……
にinte邨沁y一include∧theニtransient and
long-term variations. The former is the Forbush decrease,ニsolar cosmic ray event. diurnal
variations and so on. The latter is the periodical fluctuations caused by the rotation of the
sun and the eleven-year solar activity change. These two kinds of modulations can be
detected easily on the earth's surface. Whdしwe observe……・t・he cosmic rayぺ……i・ntensityby………the
neutron monitor on the ground, the atmospheric and temperature effects on the secondary
cosmic rays are usually superposed on the primary cosmic ray modulations. It is very
important to discriminate the primary and secondary modulations as precisely as possible,
to上show characteristics of the respective modulationsト……=J :=:1I=JII し.・・・・.・・・・ .・・.
Since the primary cosmicトray modulations are concerned with three dimensional
anisotorpic flows of cosmic ray particles in space, the spherical harmonic analysis is one
of the most useful methods to understand the physical ch征racters of the modulations. For
example, this analysis was applied by Yoshida et al. (1971)上如\the studies of the Forbush
decrease and also by Nagashima (1971) to the solar aうd sidereal anisoソtropies. For these
studies are essential the data from a network of cosmic ray stations distributed uniformly
over the globe. ..
In the earlier stage of cosmic ray modulation studieらくcontinuous monitoring of the
secondary cosmic ray intensity had started by∧using the∧畑皿zation chamber・that is one =of
the most simple and stable instruments to detect: the c(始血ic ray muonノゼomponent. After
that the precision ionization chamber was developed by Compton et al.(1934) and four
sets of the identical chambers were installed at four different stations:
Huancayo, Cheltenham, Christchurch and Go曲尽vn・. InJ如4れ,・five sets gfレthe Nishina-type ionization chambers had been constructed 拍r the ai 「毎卜establishing a =ねimilar network
system of observations during the period 1934 − 1941 (Ishii↓1944). Four Compton-type and one Nishina一七ype of chambers have been in satisfactory operation for more than 40 years (Kusunoseand Wada, 1969). Muon data accumulated during such long period are usefulイor
the studies of the 11-year solar cycle modulations. …………:レし.・・.・.・ ・.=.・・・.. ・・犬
Muon observations were further ・extended to a new∧technique of multi- directional
telescopes using plural arrays of the Geiger-Miiuller counters and/or plastic scintillation counters. This observation method has made possible \not\only improvement of the
目0
】 0 0
90
95
Barometer Coefficients of∇High Latitude Neutron Monitors (Kusunose) 11
statistical accuracy but also directional surveyり of modlu毎tions in space at aりtation.…… Another important component of the secondary cosmicしrays is theくnucleonic犬component
仇at has the energy response to\theprimary cosmic汁ays different from that of:the muon coポponent and it h乱S little effect of the atmosphericトtemperat計eレSimpson犬(1957)
developed the first standardized device for measuring this component↓一万which is called 曲e
IGY-type (InternationalレGeophysical Yearレ1957卜↑958)△of neutronつmonitors〉aれd has been
in operationしthroughoutへthe world. The dataトobtained by this deviceレ尽rむnow widelyコsed by many cosmic ray investigators through the二World Data Centers for Cosmic Rays. Cosmic ray neutron data obtained by the neutron monitor have]been highlyしevaluated by improving the IGY-type ・into the IQSY-typeニ(Inter皿tionaト・Quiet ・Sun .・Year, 1964√1965)。 using the largeしneutron COUnlter十W社hしdetection・sensitivity incr阿斗ng・ by an・orderトof
magnitude higher than that of IGY ・neutron counter (Carmichael, 1964)レThe number of
IQSY:neutron monitors being now in operation amou緋s to about∧fifty. ‥‥‥‥‥‥‥‥
ヶFluxes O仁cosmic ray∧nucleoれic componenトare modulated∧in the atmosphere. Counting
rates of the ground-basedトneμΓon mon辻orare]very sensitive to the atmospheric pressure variations, therefore the monitor seems to beニa kind of barometer. As is shown in Fig. 1, the amplitude of n卵七ron intensity variations due to pressure variations exceeds usually the primary cosmic ray intensity variations, eχcept in cases of the Forbush decrease and the
十 ・・.・.・・・ DEEP RIVER NEUTRONMONJTOR………NOVEMBER 1966ニ=‥‥‥‥‥
1 ・2 3 4 5 6 7 日・日IO□ 12ト13 14 .1S・16jlフ・1日/1日・20 21 22・23 24・25 26 272日2S 30
0R[⊃Inote: SCRLE S.0 PERCENT ト ト 尚 ‥‥‥‥‥ト ・・ ,ト .. ト
㎜ ・ ・ ・ ■■ ■Fig.l. Deep River neutron monitor intensity for November 1966. The upper curve shows the
intensity before correction, the lower curve, the intensityトafter correction foratmospheric
The即Utron皐面ltQrこisごa(devjc6that ldete収(仙(叫§面(ニ=IT功夕………レil収1面れ……=………Cgm加面峠;/lt CO耶iStS<of\an\昨rayjo仁BF.3わropニor仏)n耐∇couh坤叫レニj・叫叶面面組∧叶ゾ…… I dQ仙加………琳妙叫こミ./6fI・−・・lle昧..d・.1nd 釦1ye仏y1e面(or十p=吋4哨n).……=Th。j nIQutrI6h 万串卵㈲礼j……毎面叫二叫尚尚4ダ……=j4―φ=ぐφれ44yyjII宍1 吋od如6d 1loむauy好\1nニu巾a(坤;eract沁niノbotwe卵………jIエ―tニれ.ニり.万I―万エJhjixjjぐIJIり―φれ.iIIりj―I―I―J―=2ぐニφ加袖呻叶Ta頑ケエ1叫d<卯巾iづ 1t縦im面tta牡toダexc但dee面i坤h出 .e耳ta1―.―.=b.adk―gれ m4tet伍佞加tSideth(monit吋犬by▽the=面1yeth=yI面φニレ尚叫d―y―),怖緋……エ=ぐ .。φjJれ`tニ4iIねI5ニ――j。―=41jれ.iIiと―れニわjφlラcφInI―tI芦ge―of
Barometer Coefficients of High Latitude Neutron Monitors (Kusunose) 13
neutron), being∼3820 barns (1 barn =10-28 「)at thermal ぽergies (l/40eV). As the
counter is operated in the proportional region, it is easy to discriminate large pulses caused
by me nucleus from somewhat small pulses produced by muons, electrons or gamma rays
passing through this counter. Alpha pulses thus detected have one-to-one correspondence to ・incident nucleons。
Around each counter there is an inner moderator, the function of which is to slow down fast neutrons to near thermal energies to facilitate their capture in the boron trifluoride. Surrounding the inner moderator, there is the producer in which the evaporation neutrons are produced. Besides, the entire device is enclosed by a reflector that reflects the neutrons also moderates them. The reflector has the additional function of absorbing and
reflecting unwanted low energy neutrons produced in the atmosphere and in materials close to the monitor.
2.2. The IGY
and NM64
monitor
As shown
in Fig. 2,a full size of the standard IGY
type neutron monitor
contains 12
counters and usually is divided into a duplicate unit consisting of six counters each. The
total counting rates of the monitor is ∼ 24,000 counts/hour
at a high-latitude sea level
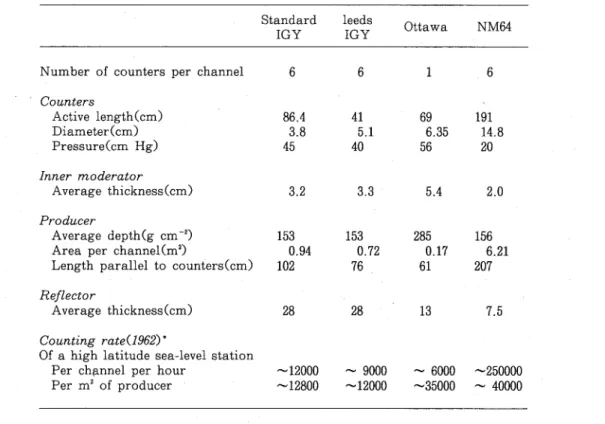
Table l. Comparison
of the dimensions and counting rates of various cosmic ray
neutron monitor designs. (Hatton, 1971)
Number
of counters per channel
Countp.rR
Active length(cm)
DiameterCcm)
Pressure(cm Hg)
Inner
moderator
Average thickness(cm)
Producer
Average depth(g cm-2)
Area per channel(mO
Length parallel to counters(cm)
Reμector
Average thickness(cm)
Countingrate(1962)*
Of a high latitude sea-level station Per channel per hour
Per m2 of producer
Standard
IGY
6 86.4 3.8 45 3.2 153 0.94 102 28 ∼12000 ∼12800 leeds IGY 6 41 5.1 40 3.3 153 0.72 76 28 ∼9000 ∼12000 Ottawa 1 69 6.35 56 5.4 285 0 61 17 13 ∼6000 ∼35000 NM64 6 191 14.8 20 2.0 156 6.21 207 7.5 ∼250000 ∼40000The counting in 1962 has been adopted as representative of the average counting
rate over the solar cycle.
14 Res. Rep. Kochi Univ. Vol. 46 (19り7)犬Nat.
station. Dimensions
of various types of the neutron monitors are summarized in
Table 1.
A radical change took place in the design of neutron monitors from
the need for a much
larger counting rate the order of 10" counts/hour
or詐印加r), which leads to the improved
statisticaトaccuracy of neutron monitorゲ上data. TheヤNM64 monitor犬was
designed
(Carmichael,
1964)
by
using large
(BP28)
BF3
pΓφ面巾onal counters
developed・ by
Fowler(1963).
Figure 2 shows its geometry.
The quanti蝉o白°B in the effective volume
of
each counter should be approximately
2.1×1PatomS.犬
O…………= 50 し 1 1111 1 1 CENTIMETERS
に7ご]POLYETHYLENE . EEI LEAD
NM 64 MONITOR し IGY M●ONITOR
Fig.2. Plans and elevations of a siχ-counter一一unit of………ド:M64neutron:……monitor and \of a twelve-counter unit of IGY neutron monitor. Incidentゾ五uc]earparticles interact w社hthe lead target yielding evaporation neutrons that are moderated in the inner polyethylene sheath (paraffin for IGY)andcaptured in the gas of the counters. The drawinSS show the structure of the NM64 and IGY neutron monitors on the same scale.
(IGY:Simpson, 1957 and NM64: Car血1chae1,1964y‥‥‥‥‥‥ ‥‥万
An innovation in the NM64 monitor design was the………useof polyethylene in place of
paraffin as the inner moderator. This alternation enabled the counter with a moderator to be manufactured as a single assembly. Paraffin:wax aUd∧polyethylene are both composed of carbon andごhydrogen, and essentially theダcarbon∠hydrogen ratios are the same. The use of polyethylene reflector has also been ableくto・mak=e・(.くconvenienti.面・tallation that the producer of lead could be placed directly on the lower p皿tion of reflector. A full-size of
Barometer Coefficients of High Latitude Neutron Monitors (Kusunose) 15
counters each. The counting rate of one unit of 18-NM64
1s ∼750・,000 counts/hour
at a
high latitude seaしlevels七ation.
2.3. Multiplicity and total counting rate
Multiplicity means the number of neutrons produced in a single nuclear reaction. Cosmic ray nucleus interacting in the lead ・’・producer of the neutron monitor result in 曲e multiproduction of evaporated neutrons within the short time interval of about 1 μsec. The total counting rate yv is given by the product of the intensity 7, the interaction probability ?, the mean multiplicity of neutrons 771, and the detection probability e . Thus
十 N=IPm A, (2.2)
where A is the effective area of the lead in the monitor.
Multiplicity measurements have been performed for the IGY neutron monitor (Bachelet
屹 「・, 1964, 1965; Kent d al, 1968; Dyring and Sporre, 1966a, 1966b) and the NM-64
neutron monitor (Griffiths d aL, 1968; Blomster and Tanskanen, 1969;Agrawal d 「.,
1969; Smirnov and Ustinovitch, 1969;Lockwood and Singh, 1969). ..
Hughes and Marsden (1966) suggested that the detected multiplicity spectrum would
reflect the energy dependence of the primary cosmic radiation. The spectral response functions were determined experimentally by latitude surveys carried out at different phase of solar cycle (Kodama and Inoue, 1969).
The neutron multiplicity distribution depends upon the geometry of the neutron monitor, for instance, the arrangement of the monitor pile, or the number of operated neutron counters (Hatton and Carmichael, 1964; Fujii有心よ1972).
According to Kodama and Inoue (1970), it is known that the barometer coefficients and the magnitudes of intensity variations as observed in the solar proton and Forbush decrease events are decreasing w此h the increasing multiplicity, while no significant multiplicity effect is recognized in the diurnal variation.
It is expected that the time variations in the rates of the detected multiplicities will reflect the characteristics of the primary energy spectrum of the cosmic radiation, and then this matter will be useful in the study of the various time-dependent phenomena of the
cosmic ray・
2.4. Contributions made
by the various components
Cosmic
ray neutron monitors
are sensitive to the secondary
components
of the nucleon
cascade, which are generated in nuclear interactions throughout
the atmosphere.
Many
authors
have made
the quantitative estimations of
the contributions of the secondary
components
to the total counting rates obtained by the neutron monitor (Simpson
etd.,
1953; Hughes
and Marsden,
1966)。
Hatton
(1971) made
a certain significant improvement
on the calculations of Harman
and Hatton
(1968) to incorporate more recent data of the various parameters required. The
results are given in Table 2 for both
the IGY
and NM64
monitors,
where the fractional
!6 Res. Rep. Kochi Univ. V 46 Nat.
counting rate of a neutron counter is in general due to se帥りdary neutrons, protons, muons captured in the detector. The daily counting rate from each componeni, Ni,was calculated under the assumption that the various components makeトthe sa皿e fractionalΛcontribution to the interactions in the moderator and surroundings as that in the producer。
The contributions made by the various components are found上to be comparable for the
two monitors, although those are not identical.………yl:naddition, because the uncertainties in those contributions are not independent for the two monitors, the differences are important and may be interpreted in terms of the トreducedニreflectorトthickness in the NM64 monitor.
Table 2. The contributions made
by secondary componentsザto the counting rate
of
the IGY
and NM64
monitors. (Hatton,二1971) し :
Component
Neutrons
Protons
Pions
Stopping muons
Interacting muons
Background
Daily counting・ rate 161200 15200 2530 9150 4800 2000% 犬
Contribution
Daily 皿 ・一一rate サ 4 8 5 7 0 0 0 4 2 3 0 0 0 ・ 5 8 0 0 0 … … 2 1 2 0 0 0 : I レ 1 1 8 0 0 0 / 6 0 0 0 0%
Contribution
85.2±2 犬7.2土t.0 1.0±0.3 3.6土O・・.7 2.0土O=.4 1.0 Predicted total Observed total 194880 216000 83.6±2ト] 7.4土1.0 1.2±0.3 4.4士0.8 2.4士0.4 1.0 5 7 2 8 0 0 0 6 0 0 0 0 0 0The contributions given in・Table 2 are applied如 a high latitude s6ぷlevel station with a thin roof above the monitor. It may be expected :that they will vary slightly at individual stations dependinぼ・ upon the thicknessトlhd一一material 0fしthe roof. They areトalso average values for the solar cycle. During the 1954-65 solar cycle the total intensity of a high latitude sea-level neutron monitor decreased by "ヽ・18% while that of a muon monitor
decreased by ∼5%. づ
3. Spherical Harmoりjc Analysis ト
As
a first approximation
the external magneticトfield of the earth can be represented by
a dipole located in the center of the earth. The
fir昨geophysicaトapplication
of
the
spherical harmonic
analysis was Gauss's
analysis of the potential of geomagnetic
dipole
field (Gauss,
1839), and since then spherical harmonic
analysis has been used for various
studies that must
represent geophysical quantities∧asfunctionsレ吋spherical coordinates. In
the present section, the spherical harmonic
analysis is aうplied to the cosmic ray intensity
variations observed by the worldwidりnetwork
of上前our!dレbased
neutron monitorsに
Barometer Coefficients of High Latitude Neutron Monitors∧(Kusunose) 17
3。1. Cutoff rigidity ∧ 十 二 ト 1 。1
A charged particle is characterized by the rigidity R=pc/ふぃwhere ふ is the charge and
p the momentum of a particle, and c the velocity o卜light. The rigidity R is usually
expressed in unit of [GV]. It has been shown〉=by Stormer (1955) that particles with any rigidity less than a critical value Ro (cutoff rigidity), are unableくto reach a specificザpoint
on丿he earth's surface, The cutoff rigidity Re is given by ‥十一.j………
R。∠器cos'
B,
(3.1)where n is :the radius of the earth,θ the geomagnetic
latitude of: the point andへM the
dipole moment
of :the spherical harmonic
expansion of the magnetic potential 0f the earth.
To have a full knowledge
of the cutoff rigidit如sat different geographic locations on the
earth is O仁great importance
in the study of the energy spectrum and
modulations of
primary
cosmic ray intensity. \ < /
3.2. Asymptotic directions of approach ∧ ト \ = \
Information耳bout the directions of propagation of a cosmic ray particle in the
interplanetary space before they enter to the vicinity:of the geomagnetic field is required for the study of the spatial dependen叩of primary cosmic rays. The cosmic ray particles that arrive at any point on 怖e earth's surface haveコbeen deflected in尚the geo皿agnetic field. To relate the time variations of cosmic rayこintensities observed on the ground to the time variations and anisotropy of the primary 6(沁耳lierays in the interplanetary space, it is essential for the analysis of the data to take into: account these deflections.・.. .. Suppose that cosmic ray particles having a rigidity R arrives from仙e vertical direction。 in average, at a location on the earth surface, where the geographic latitude and longitude
are <p, and λ Γespectively. Those cosmic ray particles are∧deflやctedin the geomagnetic field as shown in Figへ3. Let us refer the direction of approach before their entering into
− j(R沁八)
StationLongitude \ 犬 \. \ 十 \
Fig.3. The trajectory of a charged particle through the geomagnetic field. Illustration of the def毎毎on of the asymptotic direction ofトapproach. (MoCracken et al., 1965).
18
 ̄ ̄Z ̄' ̄l'・・. ・ . ・・・ .・ . ・・・ふ ・・・・.・ ・・.・・・一一 ・.・.・・.:・■■■■■ ■■■
Malmfors (1945)☆皿d Brunb雨Jレand Dat:n:er=員9卵卜水卜=聯y=j万作(毎牡皿ノ卵s/如eh……1・nvestigated
by Stormer (1955), Jory (1956), and Lus卜部dy……拍血㈱れ=j……(1957)………〉ヶニ:………1………∧:ノ…………:万…………几……=………\……万
Thド:orbit 0仁a negatively charged partic:↓・e・ ・I血.:φ々.・1り倉・=・J=.:j.J.゜.φ.ji,キメ
the earth i乱dentical:with th・e ・・・.・orbi・t・of a・posit・パ/e・・=:=うj4が.t:1・(う万l・0..:j・::万of:・,..・0.φj・・4
earth脂om the outside andく蛍t血ately arri対噌…………at the………皿垣e/……location.………Pro・・ぽrla・ms・and
methods尚曲at use the differential equationいo仁面水皿ノ……ゾ………ト∧◇〉):・し万………I.………\・\………:・:………)\‥‥‥‥‥‥‥
toし畑c垣りth白皿thくof aソparticleダofy・charge∧q and →... ・・・.・・ ・・・ .・.・.・・
B by numericalトintegration, have been
g W .●一一 ●四 ・・・・・ ・ ・
and the references there in):. In theうreseねtxyφおく:、lにtwo t
mainly in the即och of 1955し[McCracken it etゲ皿ゾレ……]坤65)一万j巨面万.:・p・artl一 琵琵∧aLに1983) wereトused:………I………犬………=、1…………/∧:∧ト……1:……〉:………/j……呂……1万jj
3jレMethod of the∧spherical har 「onic analysiレ4=/………1………=:レス……\………=\=`プゾ…………│………フ…………=・\宍・.・にI・.: Here, He呻ンレwe we describe thedescribe the method十〇卜‥‥ ‥‥∧レナレ∧<ノ…………=:ノ=宍ヶソ…………ケ…………ノノ……1………:レ…………method∧oLト
analysis aceぱd垣gしto Yoshida入沁/禅屁
(1971):レA functioれイ(θレφ)しdefined on
a・spherical su球収e/ in .・termsユof the∧∧
うolar coordinates θ and ψ,=卵胞own
加F収一 六
4, is expa卜ded into a serie:s of
theレ印herica卜harmonic functions as… ……:
プ((φ=Σダ=(肌φ)………(抑)○……… へ∧ <,・1-0 11 .1 ‥‥‥ where ダ ‥‥‥‥‥‥ ‥‥ ‥ ‥‥‥‥ ΥλOi〉φ)=トCiP.(0√(p)= …… ………… .:.・ .・: ■■ ■ ・.Z. ・. ‥ .・ ・ ……j … ………=j°十万jΣ{A\・}じosm<p………I…… ヤ ペ批=●l ・・ ・. 尚・ .・ ∧≒ ………=‥‥‥デÅ'"'・' sin 171'φ}戸戸COSの……… ‥‥‥万‥‥‥‥ ‥‥‥‥万 犬 ダ(3.4) レ ソ ゙ ノ … … … … : … … … = = … … … ゛ : ( 3 . 2 ) 皿:4………aね夕`φかotic ダ:幽目……epoぐれ, of 7£ φ etic field ・.√1983, direct如ns, 1975 (Inoue
1cし
n of
Y e n o I P 1 0 −︱ 稗1如t沁丿如こordinate・gy叫:ems. itude,〉latitudeBarometer Coefficients of High Latitude Neutron Monitors (Kusunose) 19
In the above equation, Al""^,召呻,and
G are harmonic
coefficients.The sum
of the terms
upトto the second order of 1=2, is given as 十十 △
y(0. <p)= ゛ ` ’ 2▽ 乙 = n(0, <p) where ∧ : し ‥‥‥‥‥ ‥‥‥‥j 十 十 ・yo(θ,妁=G几加sθレ……1 ∧ ニ ニ n(肌炉)= CiPi(cosθ)十(ぶ1)qo岬十ろび)sinm武)晋(cosθ), =
\ y2(0バ))=GR(cosθ)ご十(洵1)co岬十召び' sin mcp)月(cosθ)ニ ) \ 十(湘2)eQs収)十召Pjsin恥)月(co・J). 上 ‥‥‥‥‥ ‥ Further, the associated Legendre functions 戸戸・(cosθ')up to the order of Z,碍 =レ0
2 are expressed as in the next table, where Z>m∧and丿,(coφ)=戸(cosθ). /
(3.5) (3.5a) (3.56) (3.5c) 1√
l/m.
Isotropic/zonal
component
0
First harmonic
component
1
Second harmonic
component
2
0
1
2
1 COSθ ¬ y(cos2θ−1)sinθ
3sinθcos.θ
3sin2θNow, we express the asymptotic direction of the i-th station specified by the polar
coordinates 6i and (Pi, which are given with。・・・・・ ・. ・.・ .・ .・.・ .. ・・・
respect to the earth's axis and the direction toward the sun, respectivelyトAs shown in
Fig. 4 and 拘gレ5, the polar coordinates (仇,
(み)are related to the asymptotic latitude 仇
and longitudeλi as follows:上 ト
θ,=π/2−(pi and 仇=ω(£−12)十λべ3.6) レ
where £ denotes UT (Universal T.ime)/and
ωis the angle velocity of the earth's self
rotation (ω=π/12rad/hour).
Nine harmonic coefficients up to the second order, Co, d, d,ぶ1),屈1),刈1),瓦1レ人2)油d務2).. are determined every one hour from the data of cosmic ray intensities亘6i, </>i)at stations,
≠(ブ)プヤ……\\………
:
ノ……
…\:
.
││
ノ
千ノヤH
SENSE OF ROTATION OF THE EARTH ψi=ω(t−13)十λ,where
i° 1,
2・
3・…・″・by
the least Fig.5……peれれing
the angles employed
to specify
squarりfitting method,
which is to minimize
theasymptotic direction 6f viewing an
20 \……… Res. Rep. Koohi Univ.仁y皿ゾ俳ト(1997)く・トN貼……I………=・上白………万………
minimize the totaトsums of square devia蝉)面騨雨声如軋ノ町レ彫V〉………I……=……:\\\………
………J:・ 二万……:………a=・Σ皿/[y昧レ :・ レ.・・.・・ .・ .・ i=1 ・.
where the mean countingぴte at十an t-th・
statiohsご‥‥‥‥‥‥‥‥‥‥‥‥ ‥‥‥‥‥‥‥
T如ダcoeff姐咄tトC。it) i・s t臨入isotropic \(wQr岫
ぶ1)](£)\knd………5P,(after thi臨bbrev姐佃d……:as A ani帥■tropicぐompone皿∧The二coeff池谷nt 。已くj asymmetric (latitudinal)レcomponen卜血dレ=伽
longitudinalレasymme:try. The
maximum〉nhχ
l………プヶ町ゲ……j=1万・=皿:4ねd:万j:nis theかamber ofレ 加如皿丿面4▽らノ(り, together with)∧6φ面七姐lies the first……order of
harmonic
terms comes
from一the asymptotic longitude give
itude………of………the north一台outh デ=排)リノ\/前面……that of the 丿6皿瞬緋図………by the:first u り 9 り 、 y i i i j j L u b i し l U l 卜 5 ・ ・ l ・ ! そ : Q p ・ ヨ . 、 ・ 6 万 考 V C i i … … … 1 J J … … … … ト し . ∧ 1 ○ ‥ ‥ ‥ ‥ ‥ ‥ = φ 牛 t a n ダ 1 ( 且 / Å 八 十 ( │ ご 万 … … … = 〉 宍 = … … … … 1 … … … j = j … … … …I = j ノ ケ . 1 = 宍 … … … ∧ … … … \ \ j = … … … ト … … … j … … I I ¨ = し ∧ へ \ … … : ・ j ( 3 。 . 8 )
One also〉can:definりthe threeトdimensioれal quantitie球〉…………J………:レ………万………1…………1=……二………:………j= 1
■ ■ ■ ■■ ■ wい/・jn・.マヘnl.・/り6ゝ1・ ? ヨ ( Å 1 十 狸 + a ) イ , = j … … … : … … … j … … … … = : レ … … … … ∧ ◇ ト … … … … ノ … … … : … … … 1 < … … … = レ … … ∧ … … = = … … …./Qト・.・・..・...・・J・.・・:./...・・, ..・ し..・一一
車 止 t a n ソ { C 1 / { Å 1 + 屈 y イ } 1 / . =
, y \ ノ … … … ケ ゙ ノ … … ∧ = … … = 〉 1 … … … … j … … … ∧ \ レ ノ … … = ノ … … \ フ ゚ … … … …
The quantity P gives the maxi㈲i皿
asymptotic direction specified by the relationsくare illustrated犬in Fiヒ6レダ
X Å 1 C φ ∧\ ‥‥‥ ‥万W≠t:anヤ{CI/(j Fig.6……Illustration of coeffiぐients A:1=:゜, / \▽Jm4×imum anisotropicしcompon:り asymj〕totic directiりn:ぼivenby longitudeΦ.く………万 I
flux
ヤ(3.9) (3↓:10) m anBarometer Coefficients of Latitude Neutron Monitors (Kusunose) 21
The
stations where data are used in the analysis are given in Table 3. For each station,
the vertical cutoff rigidity, the asymptotic
direction (cOiand λi), and
the mean
counting
rates (Wi) are given. The vertical cutoff rigidities for every station can be seen to be less
than 2.3 GV,
whicりis close to the atmospheric
cutoff value.しThegeographic distribution of
the stations is shown in Fig. 7. ト
It is assumed
as theトfirstapproximation
that the mean
rigidity of primary
cosmic ray
particles arriving at every station is almost eqリal t0 9.5GV.
This assumption
is based on
the fact that the effective asymptotic
latitudes obtained for 11 stations (except for
Su!phur Mt.)
agree within accuracy of ±5°十with the asymptotic
latitudes obtained by
McCraeken
it d al. (1965) for the rigidity value d 9.5GV
(Nagashima
it et al, 1968)。
Figure 6 shows
the geographic distribution of 仙e asymptotic
directions for rigidity 9.5
GV
at UT=O for all the stations where data are used in this analysis.・A・geographically
uniform
distribution of stations is essential for making
an accurate spherical harmonic
analysis.
22 90レ4
Geographicレゲ
HI仙工dt↓tu
Neutron十M6「4
◇V心卜刈ゾレ( 万喜7・Geographic distribution吋:high … ………sphericalharmonic analysis.〉90E
90W
Barometer Coefficients of High Latitude Neutron Monitors (Kusunose)
180
0O
Northern
(D S・outhern
Hemisphere
Hemisphere
Geo・graphic Asymptotic Direction
of Neutron ・MonitorjS‥‥‥‥‥
2390E
Fig.8. Geographic distribution o卜the asymptotic directioりs (for rigidity 9.5GV) of high latitude neutron monitor町used in止e spherical harmonic analysis.
24 NO.STATION 1 2 3 4
…………Res. R面。Kochi Univ………ゾV挺4肩汗(四97)………Nat.……\ス…………]ノ………ト……
Taり1e 3. List of the high lati皿萌………万々:osm如………=姐y………neutr皿……mon・itor・り一万・。・
HEIGHTプVERTICAL コ :・ニ=1 =CUTOIFF ■■■■ :. RIGIDITY ALERT (S)く APATITY(S) CALGARY(S) CASEY▽ ‥ 5 CHURCHIL(S)ト 6 DEEP RIVER(S) 7へDURHAM(S) 8/G00SEBAY(S) 9トHEISSIS‥‥‥‥ 10.・HOBART…… 1i………INUVIK(S)\ 12 KERGUELEN(S) 13. KIEL(S)犬 ‥‥‥‥ 14 KIRUNA(S)し 15……LEEDS(S) / 16▽MAGADAN(S)上 17\NAWSON 上一 18\MCMURDO(S)+ 19犬MT.WASHINGTON'ト 20しNORILSK(S)ニ 21 OTTAWA + 22 OULU(S)………J° 23 RESOUTE BAY(S) 24 SANAE(S)\ + 25 SOUTH POLE 26\SULPHURMT.(S)ダレ 27しSVERDLOVSK(S) 28 SWARTHMORE(S) 29 TERRE ADELIE(S) 30 THUILE(S) ニ 31 TIXIE BAY(S) 32 UPPSALA 犬〉 33 VICTORIA(S)…… 34 WILKES 35\YAKUTSK 〉 ……YAKUTSk(S) ト (m) 一 犬57 177 8L95L60LIL402LL8 mS314S42S2S5407SS4 1909 L7L7CO O CO Q︶roq゛1rD8228 CV] CO :300 ∧80 lO O LLIL55 426SS7S1010 /(GV) 0.0し 0.65 寸.09 0.01△ 0.21 L02 L41 0.52 0.10 ↓.89 0.18 1.19し 2.29 0.54 2.20∧ 2,10 0j2犬 0.01 上24ト 0.63…… 1.08 0.81 0.0 1.02 0.11 1.14 2.30 1.92 0.01ニ 0.0 ト 0.53 L34 1 1.86 0.01 \ ↓.70= L70ダ
NUMBER OF STATIONS USED IN THE
HARMONIC ANALYSISニニ (MAXIM
(S):NM+64MONITOR,0THERS :IGY
(*)::NOT USED IN THE SPHERICAL]
t / j … … … ソ ゙ 犬 : … … ト 1 1 . 0 6 … … … … 万 … … … … 1 1 , 1 0 ㎜ % ・ % ・ ・ ■ ■ ■ ■ ■ ■ ■ ゝ … … … : ・ . . ■ ■ ■ ■ : ミ ミ ㎜ 23 1 9 6 8 一 二 6 . 7 9 1 . 9 7 … … … 1 0 . 7 0 2774 8552 1 630 一 622358 一 75236607 1305 一 2439 一 9 一 384 751319 292258410 一 一 I I − 一 一 I 一 一 I 一 一 一 − I 一 I 一 一 一 I I ∼ 一 71946 0675 6 0只︶I 132127 33470400 21 /26.T22
Barometer Coefficients of High Latitude Neutron Monitors (Kusunose) COUNTING RATES 1969
6.68
, 3.87
1970 -6.68 1971 -7.15 4.65 (105/h) 1972 1973 7.46 7.43 4.72 4.73 10.48 10.57 11.22 11,71 0.39 十〇.40 − − ・7.01 1 7.05 7.53 7.66 19.05 19.18・ 20.51 20.86 3.53 6.43 − 0.27 6.35 7.19 5.83 − 6.64 − 0.35 8.75 一 一 1.73 3.47 2.12 1.32 2.09 3。54 4.84 6.46コ つ6.87 一 一 0.28 6.39 7.26 5.86 6.52 6.27 − 0.35 8.79 1.36 − 1.76 3.49 2.12 1.33 2.09 85 一 7 79 一 7 3。20 3.84 4.16 6.59 0.55 6,23 0.39 0.18 − 25-20 24 3.23 3.88 4.19 6.55 0j6 一 一 一 一 22 0.29 6.80 7.76 6.23 6,96 6.23 4.92 0.38 9.43 1.443 3.50 1.92 3.75 − 1.42 2.23 8 Q U 4 4 4一404 6.76 0.58 一 一 一 1.48 ・5.83 6.98 − 0.30 6.90 7.90 6.31 7.09 6.31 5.00 − 9.61 1.46 3.33 1.95 1974 1975 二 1976 7.33 7.49 7.52 4.64 4.77 。4.77 一 一 7.50 20.90 ト5.84 98 一 Ry 0.29 6.91 7.88 6.29 7.11 6.29 4.99 − 9.56 1.45 3.34 3.79 3.82 − 1.43 2.25 O CTi CO CD 8一425 QU QU44 6.33 一 一 一 一 1.50 1.48 2.25 − 5、81 一 一 一 20.55 5.77 6.88 一 ︸81 7.79 6.20 6.99 6.20 4.97 − 9.46 1.42 3.30 − 3.77 − 1.46 2.19 − 5.61 一 一 一 一 一 一 31.07 21.21 5.8「i 5.70 7.01 7.04 一 一 6.96 7.96 6.32 − 6.32 5.06 ・− 9.69 1.46 3.36 − 3.85 − L46 − − 5.78 一 一 6.98 7.99 6.35 − 6.35 5.10 − 9.74 1.48 3.37 − 3.88 − 1.47 − − 5.81 4 0 5 ≪ 3 L O C O L O 一 一 I Q u 4 4 り 乙 ︷ h ︸ り n y L O O O L O i 。 . Q U 4 t 4 L O L O C O 4 1 4 一 一 I n j 4 4 0 0 T -H L O 4 C N ] L O 一 一 一 Q u 4 4 6。87 − 一 一 一 1.49 2.19 一 一 一 一 1.46 2.26 一 一 一 一 1.46 4.00 一 一 一 一 25 1977 -7.48 4.75 一 一 − 21.13 5.86 7.00 一 一 6.94 1 7j8 ト 6.34 − 6.34 ぺ 5.03 一 7 3 5 0 Q ■ ⋮ 1 -( 3.36 ・ 3.86 > − 1.47 1.17 : − 5.79 3.53 − − 3.09 一 一 一 -1.46 1.46 25-21 24-21 24-21 22-20ト 20-20 20-18 19−1826 Res.く狸epンケKochi Univ.………V皿ザ研(1997)パヅケ……N組・=・∧j=………I,………∧に=ノ……
………ト………4、Atmospheric Eff如ts on the Neutron Monitoりごjレ)‘j…………ノ………:…………\………/IJ………:
The countingプate of a neutリn\陽o皿tor is囃bj皿鋤d/:丿o…………、皿(枇如ぱ似耐\レ好防氷上〇f六大・t・1!e
4.1. Barometer effeCt‥‥‥‥‥‥‥ト ソ \
□The barometer:effect〉is associated with
The close correlation between the cosmicト組夕=・一万J:=・. discovered byレMyssowsky八姐d・Tu・ぺffiva ・(1926)∧7Jフ
isコtaken as a measure of十thiレmass andレ=t・h・6]
attenuation and/or barometer coefficienレβ,/Ty
the cou削血g (/うrincipalプparts of 昨皿レノ皿十仙e ground jt………above the°ni:onit〇r. 如spheric pressure………糞as e recorded at a station 了如t所レknown白臨ノthe 4。2. Temperature effeとt 犬 ∧ 〉。 十The工如untingトrate皿(尽。, p, t)6fトa\
written for the seco姐町y七〇mpone肩丿
where Re and p axe
ゲqu:纏以tダダy(凡φ)
cosmic…… 二in.・the……
べ(y(㈲で早牛ケ
the cu仏ff rigidity and
レthe gross specific
generated fromレ仙e
primary
p町tidりsトwith
primary
・ ` ゛ ゛ ` 4 ゛ J ・ . ゛ ゛ ` ゛ ゛ . ゛ . ` ゛ J - . ゛ 4 ゛ j . . “ £ , J . V A ‘ ゛ J ` J r ゛ ` ゛ ゛ 4 ゛ ^ や ` 4 = ゛ ・ . ` 4differer巾峠rigidity spectrum
at a tii
゛ ・ f “ ‘ 7 1 . : . r ぺ … … … : I T h e a t m o s p h e r i c : p a r a m e t e r a p p e a r i : n g e x p l i c 縦 元 半 レ 面correction for t恥∧atmospheric effects is to
to ・瓦……value・at a・.・蔀j1むcted standard depth………
cascade procおりproduφng theぶompo面nt
i in
1φng in compari噌with the time d :・flight∧・一行6毎ゾ ■■■㎜■㎜㎜㎜ ㎜ a -・・ J ・八-i■-- --・ ・■■■■■■■■
This situation is not always
fulfilledfor
11佞七1耳le of a・3トGV=皿uonし1sroughly eq皿トt9ト
sea level. The muon intensity at sea level is t臨 temp皿出ire distribution throughout the atmos componentけa significan卜depen:dence on柿e尽t:l pjoかlink in the nucleo『cascade. Owing to theレ
is too small如励a土印mewhat
jgねificant
帥(皿りね1如r at亙time t,is usually ドゲ1皿白面融lレし如p如如ね皿球屈\ノ……… 了ぴ∧ハ……。4:pト<し1………1\:l=∧ト………:l= 犬∧………1 W ■ ■ ■ ㎜ ■ ■ ■ ■ ■ ■ ■ ) ケ … … … d R … … … : : : 呂 … … … J : … … … ∧ … … … : ト ( p 坤 s 尚 尚 √ 袖 印 り 直 祐 水 Λ Υ h e r … … … ∧ 曲 ( ・ ・ \ 心 り c l o : i \ ) l 柿 ( \ 面 面 坤 如 寸 ( 日 √ ∧ ノ ) … … I i s : t h e .しThe depth 〉翁=jく如s縦陣(卯之f面△as……the
s whose life time is enough
jねxample,スthe relativistic
)有6血the 100∧mb level士to
佃姐面t……血……the density and
可\七he low energy〉n:如!eon
し面(面i白面………oれ=1y七hrouだh°a
contribution
宮姐鋤de will
■ ■■ ■■ ■ ■ ■ W ■■ ■■■㎜■■■■■ ■■■ ■■■■ ■■ ■
Barometer Coefficients of High Latitudむ Neutron Monitors (Kusunose) 27
The median energy of the primaries detected by sea level high latitude neutron monitors is about 20 GV. We note that this energy isレdivided roughly equally at the first interaction
in the atmosphere (at a mean depth of ぺ=60トg/耐)しbetween fast nucleons and two or
more charged pions with average enerぱies of」ess than 5 GV. 尚 し 〉
If r n is the probability of pion decay per unit……time and the l≒ 曲e probability of
nuclear ・interaction,・then ・ ▽・.・・ ..・・ .・・. .・ ・.・.
Γ。=
l
ら几
白骨
(4.3)where F ;, is the pion energy in units of rest mass, r , is the pion lifetime of 2.5×10⁻⁸
sec, p is the atmospheric density at a deptれof 60 1g/ ・andλ, is the interaction m・叫n
free path. Thus, it follows that 十 尚 ニ し
呉/二旦nn^n
..ヽ・12.5r。ρ (4.4)
for p∼109 gm/ 氓≠獅 7 .=35(∼5 GeV), I≒/Γカ∼0.045. This meansトthat about 4 %
or less O仁the energy of the nucleonic cascade is transmitted through a pion li皿 at the first interactionレSince p changesしby about -0.5% per 1.゜C,十the effect of the te血perature change on the fluxes∧of the nucleonic component near the top of the〉atmos油ere is d the order of -0.02%/゜C or less. In typical cases大目uch an order尚of the temperatureニeffect can be neglected. \ し\ .・ 一一 \
Although the nucleon component has little atmospheric temperature effect, an:appreciable contribution of muons to the counting rate of a S6aしlevel neutron monitor introduces a significant temperature dependence. Since the muons involved there are found トnear the termination of their flight range, their negative temperature effect is considerably larger than for the muon flux alone. As a result the neutron temperature effec卜becomes large. Dormanで1958) has calculated the temperature coefficients toニ卵ply to the correction of
neutron monitor data. レ ‥‥‥‥‥‥‥‥ ‥‥‥ ‥‥‥‥:
Kaminer et al. (1965) have investigated the: annual∧temperature effect by むomparing neutron:counting rates at 乱 station in the Northern∧Hemisphere几with that at the
geomagnetically むorresponding station in the SouthernしHemisphere. They find an annually
seasonal wave of L2% in amplitude from c6・parativeヶstudies between the Hobart and
Chicago neutron data, being about 1.8 times the∧value theoretically obtained by using Dorman's temperature coefficients. Thus the atmosphericユemperature effect on neutron =iS
found as small as one fifth of that of muons. レ 尚 ……… 1 ∧
4.3ンEquation for the barometer coefficientし =\………:.・.・ ・ . =.・・..・..・ .・ ・ ・.・ ・. ・ .・. ・・
Let us consider how the mass absorption coefficient o仁neutronsニdepends on the
atmospheric depth, the cutoff rigidity and the⊃primary∧spectrum. The∧subscript トin
eq.(4.2) will 1beしfrom now on omitted for treating mainly neutron CO・mponentsト 犬 プ
28
where
The expressionβ'=(瓦:p)うsトtheトdifferentialトab如
from the primaries叩沁hしa specific∇うμd雨に菰〉飢二
on theうrimarダ:spectrumバ凡イ) whereas・β……4=り・p.・
It is evident from eq√(4.5) that the barometer柏耐恥尚尚………異ノ鋤畑面目:)面微……the:shape q.・f:
the……primary尚spectrum. In general。……any・6佃1:姐血]征子(瓦宍………ノ=)…………袖八面……in:.・:gre:ater extent 飢
lower rigidities than……a.tしhigher rigidities,しand alsoΛ皿e coeffic如牡く………βt・ends・to decrease as:
the intensity decreases, sinceぐthe coeffi・雨聯βソ`',ゾ鋤やreases with……鋤皿臨白営レenergy∧十\………
The spectrumニdependent changes of・β\毎町e firs卜pointedケ・り似=レこ.ノレ町=万ノレMcCracken a・うd▽Johns
(1959). They noted十曲aト2=%大助crease inβご似………皿油j………1=j
Forbush:decrease of 10% in amplitude occurred……)……\……=Iヤ…………レレゲjト・=\yj・・.・ト………=ノ……j………万……土入………1………
4.4. Inf:luence of the high winds / …………レレ.十ノサlレ\………\………=……:……\レ………:\-=………J…………:………レ……
In applying corrections for the barometr細大奸佞ct to………=・曲(鋤帥面面y………com如面皿/㈲・asured a
possiblや・. difference between the air mass二八b卵り………ノ仙yyj節姐叫佃(臨社1∧j励………レreading of………the
barometei≒when strong wind blow should上恥]\如■ted.………j狐半\d社印rence・,し・面面:i噌……:ft6㎡/t如
Sφ-called Bernoulli'心effect, is▽proportiona卜如く皿谷レし.ノ面姐緋……万……=胚二万t㈲∧面皿)ダ\y.・・velocity. In・=.・a
hrometcr
.希hen∧叫rong
wjnd b1ow=Sbou誹ケ畑Tノ面佃jd,―………jΥ垣(I4j;μ9r昨加√面isニiれgj……ニft6m十t徊
Sφーqal1Qd Be印ouni'ノ白\effed。iS▽propo竹iohaI\縦ノ怖谷レづ.ノ亘面加]……万……=奸レゾt㈲∧面面)ダ\yIII面1oぐi竹。・\=万Ih―I=.―a
pra雨ceバhe Iinf1uen坤ofthむw沁dニto伴いi叫紅叫\φ叫加坤吋ニ……ノ畑………=d―o縦i面吋\加励n=thQケ和面
continuous observations of cosmic ray neu
neutron mo 「tor尚sin叩入February!9卵∧Us・1μg………tl)゜4
March 1971, possible deviation of thO〕b佃如ed]
investigated in typical 8 e姐mples of ・hi帥∧W如
It is∧shown that thむ pressure deviation inferredゾ
reduced byコuse of a specially designed barometr紅白
amounts
to about
4 mb
in maximum
whe元二:th6……:l:
deviatic〕n is still higher by one order血sトcompared ■>
theニwind tunneトexperime緋thatしhad beenくc如西浦=
Figure 10 shows……an example of仇eへeffectケレj・l:Iφ.・・f=.・jl=一一一一§
correction for atmosp!aerie pressure:observedト万町jプ=7・4
sensor at Syowa
Station.
(=プ面ingthe二12-NM64
years up to
h winds were
k. 9.十>
・condition. トi緋ensity barometric+1 O り 2 ﹃ 4 ︵%) uoa:^n^N jo A:;Tsua::mH −5
Barometer Coefficients of High Latitude Neutron Monitors (Kusunose)
ト wind Velocity (m/sec)
Fig.9. The relation between the neutron monitor intensity deviation and the pressure deviation caused by high wind observed at Syowa station (Kusunoseand Kodama, 1972) CVJ ︱ 十 十 29 ︵ ︵ ︷ 日 ︸ ajnssajcd OTast[dsouiq.v I 2 3 4 5 6 atmospheric Antarctica.
As
has been reported by Kawasaki
(1966, 1972),
there are two
problems
in neutron
observation at Mt.
Norikura (36.11ON, 137.55OE, cutoff rigidity: 11.4 GV,
altitude: 2770
m):
(1)
Barometer
coefficient of
Mt.
Norikura
neutron
monitor
is 0.64 %/mb(=0.85
%/mmHg),whichis extraordinary lower than that expected from
the values obtained at
other stations, and
(2)the
time variations of the barometer
corrected intensity frequently suggest abnormal
pattern compared
with the data
of other stations, specially with
those at Tokyo that
should show
almost
the same
variations.
The barometer
readings at the mountain
observatory
that are affected by h址h winds
through
the dynamic
pressure effect are corrected reasonably by the free air pressures that
are estimated from the interpolations of radiosonde data of corresponding altitude
(Kawasaki,
1979; Kawasaki
d
al., 1983; Kawasaki
and Wada,
1983).
3 0 SE︶3dnSS3dd 3iy3HdS0WlV つg︶ AllsZ]トZ一 ZOtトコ山Z 990 980 970 960 950 940 ○ ○ ○ ○ ○ ︲ 2 3 4 (VE) AlIuoJ]ン QZ一S
Res. Rep. Kochi Univ. Vol. 46 Nat.
((】)
(b)
(c)
(d)
。
ノ∩ダ
[
L
−(e) − ∼ − (O − ∼ = − ● ●AUG.14
AUG.15
AUG.16,1969
Fig.10. An example of the effect of strong十windダon the neutron intensity correction for atmospheric pressure observed at Syowa Station. (a) Apatity, (b) Oulu. (o) Syowa 犬 Neutron intensity corrected for the wind velocity coけected十atmospheric pressure, (d) Syowa Neutron intensity corrected for the wind velocity uncorrected atmospheric pressure, (e) Syowa atmospheric pressure. Dotted line means correction for wind
Barometer Coefficients of High Latitude Neutron Monitors (Kusunose)
5. Examination of the Barometer Coefficients
31
As described in the previous section, the barometric correction of the observed counting rates of ground based neutron monitor is important and unavoidable process. The purpose of the present section is to examine the barometer coefficients of high latitude neutron monitors that are used for barometric correction of data. Barometer coefficients that are used for the barometric correction are usually determined by individual observatories. It is not easy to examine the value of the barometer coefficient in use at each station. At a single station, the successive differencing method (Lapointe and Rose, 1962) and the autoregressive method (Martinelle, 1968) have been proposed. However, it is not proper to
examine the baromむter coefficient in the earth's scale. Through the study of the
correlations between the daily mean pressures and the residuals of the observed data from which the composed intensities were removed, re-evaluation of the barometer coefficients
have been performed. (Ogita d 「。, 1973; Kusunose d 「。, 1981; Kusunose, 1984)
In eq. (4.1), the barometer coefficient β is determined statistically from the linear regression analysis between the neutron intensity and the barometric pressure. Our first objective is to examine whether the barometer coefficients used in the existing cosmic ray stations are appropriate or not. We evaluate how large in the order of magnitude is the residual variation that is a possible pressure-dependent term still remained in 七he pressure
corrected neutron intensity data supposedly caused by improper coefficients. The observed counting rates of incident particles depend upon the characteristi叩 inherent to the
observational apparatus and environment.
Therefore, the counted number of particles coming from the apparatus aiming direction must be transformed into that for unit area, unit solid angle and unit time. However, in studying the time variations of cosmic ray intensity, use of the relative intensity is convenient. Using the relative intensity, one can disregard the differences due to the size of apparatus. The pressure corrected neutron intensity 7\/。。。is transformed into percentage values L。,rrelative to the mean value. After this we use the relative percentage values in place of counting rates.
To eliminate the longitudinal component, the daily mean values are used. We define the composite neutron intensity to be
−
y(φ)=Co十Cisinφ (5.1)
whereφ=π/2−θis the geographic asymptotic latitude. The harmonic coefficient Co
−and c, were obtained in Section 3. The function y(φ)is the composite neutron intensity for the cosmic ray station at asymptotic latitude φ .
The composite intensity y is derived from the analysis by using data from nearly twenty stations, so the effect of improper barometer correction at some stations is reduced to about a tenth of the pressure corrected neutron intensity variation at each station. The −difference△7 between L。t and y(φ) for a neutron monitor located at an asymptotic latitudeφ, that is,
32 Res. Rep. Kochi Univ. Vol.46 (1997) Nat.
ト △7=L−y(φ),∧……… ……\ ‥‥‥ ‥‥‥‥ (5.2)
minimizes the effect of the intensity variations of the primary cosmic rays outside the
magnetosphere. In this way, the remaining small pressure好和ct that 皿ay be included in
the pressure corrected data becomes apparent by inspection of plots on the diagram of ∂7
against the barometric pressure。
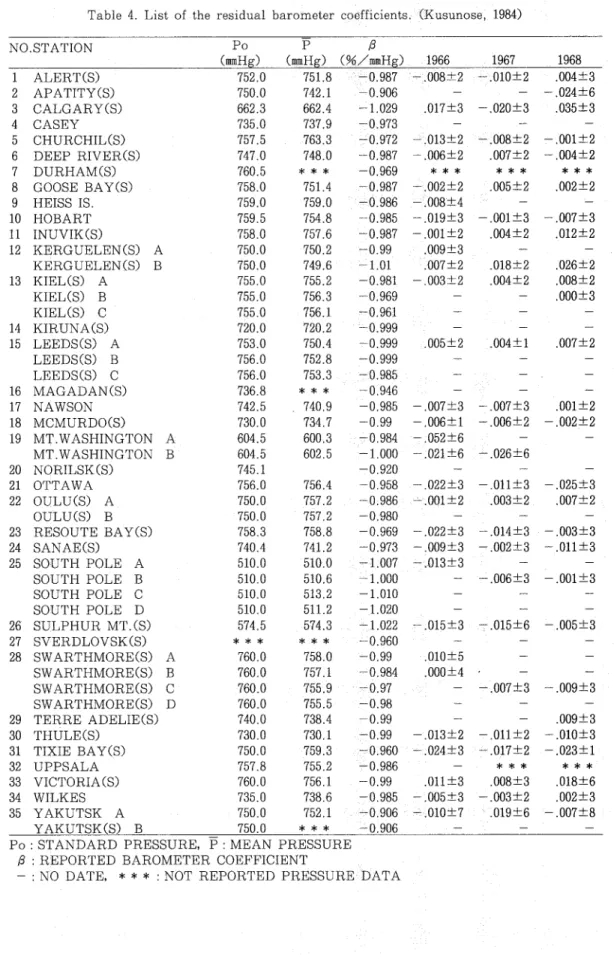
The。residual barometer coefficient △βis obtainedゲ卵a 11叩町regression coefficien七from
the correlation between the atmospheric pressure p and the residual in七己nsity variation △7
defined by eq. (5.2). Thus derived values of △βfor the period from 1966 to 1977 are
presented in Table 5.1. The errors of coefficients in Table 5.1 stand for the sta回教d errors
of the linear regression coefficients derived from this analysisレThe barometer coefficients
βΓeported at each station are also given。
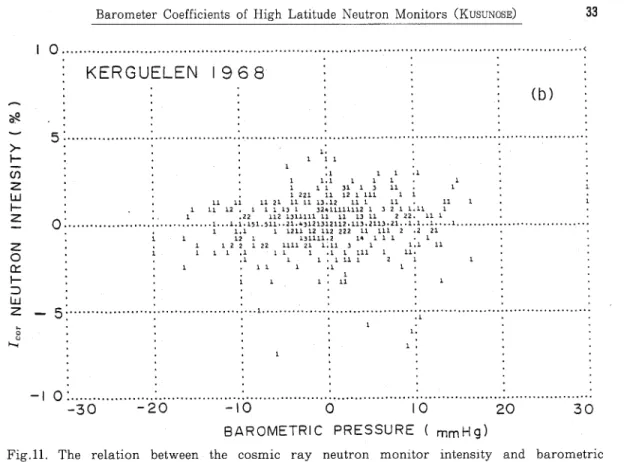
Figure 11 (a) and (b) are examples of the corr出所on between the pressure corrected
neutron intensity L・r and the barometric pressure p, at (a)尚Deep River, 1968 and (b)
Kerguelen, 1968. There appears no indicative of any correlation bewtween L。。and p as seen
in two figures√Figure 12(a)and(b)show the c面relationくbetween the residual neutron
intensity△7 and the barometric pressure p, at (aドDeep Riv:er,1968 and (b) Kerguelen,
1968. There is no correlation between △/ and p in Fig。12(a), but the correlation is seen
clearly in Figト12 (b). It seems necessary that the barometer coefficient at \Kerguelen
Station in 1968 should be re-corrected. ・・
○ 5 0 5 一 ︵% ) AilsZ3にLZ一 Z︵︶叱﹂にn3N ’””I ○
DEEP
RIVER I
968
1. 1 1● . 1 ● ・1 1 11 1 1- ≒ I ・1・ヅヅ ・● 1 11 111 ,. 一一‥1・ 3 1 11 1 1 ・ 1 11・ 3・1211 11 1 11 t 11 11 15211 2・222 111 1 .11 λ1 44 43 1131.2 1 *3321211 1.1 121 1 1413121 }23Z2 4232H↓212U .1.2...X..i..3・..2311..11112.,λ14531212211・. ・ 1 1 1 1 . 1 1 , 1 1 1 1 1 1 1 1 1 . 1 ([]) . 1 1 2 1 2 1 1 1 2 1 2 2 ● 1 1 1 1 i m 21 ・ , . 1 λ ↓ 1 1 1 1 ・ 2 1 2 二 3 1 a i l ・ 1 . 2 1 . 1 = . , . 1 2 k ン . ・ 1 . 2 2 2 i n 1 . 1 ・ 3 2 1 ・ . 2 ・ 1 ノ ド . 1 . ハ ゚ ・ 1 1 1 1 1 . ・ λ 1 λ 1 ・ ト 2 2 1 ・ . / ・ , λ 1 . ・ ● . ・ ● 1 L 1 ● ● ● ○ -30 0 |○ 20 3 BAROMETRIC PRESSURE ( mmHgレ) ………= ノ Fig.ll. The relation between the cosmic ray neutron monitor intensity and barometric︵gT″︶にIωz]に[z一 き Q 卜 卜 ' 『
Barometer Coefficients of H址h Latitude Neutron Monitors (Kusunose) 33
5 ○ 5 一 Z〇y.[D]Z III4・I 5 0 5 ︵g︶メヒ∽Z3にLZ一 ZO叱トD]Z 1.0
KERGUELEN 1968
︱ I I あ I ! ︱ 1 1 ! 1 1 1 1 1 1 2 . 5 1 1 . . ︱λ II自SIIIa 1 , 1 1 1 1 1 a s 自 1 1 1 − 1 1 4 £ 5 一 1 1 1 1 ︱ ︱ IIIa∼I一一SI141SII 0 1 1 1 . d:1・ 1111 lll 13U 111 1111 3112 3 3 2 1 l . H 2 2 2 . 1 1 1 1 4 1 1 1 11 1 1 l t l 1 1 − U 2 1 ・ 1 1 11 1 12 1 L211U 1 1 i H 1 U lj︵ i一1一 − 11 −︱・11119 0 . 1 1 . 1 1 1 1 1 ・ . 1 1 . 1 。 ○ 1 1 (b) 20 20 30 (0) 30 ● ● ● ● 丿 ● ・ ● ● ● ・ ● ● ● ● ・ 1 ● ● 1 1 ︱ ︱ U 1 1 ● 1 ● 1 1 2 . . 2 2 . 1 . 1 ・ λ 1 , 1 11111 1 1 1 -30 −20 −|○ 日AROMETRIC PRESSURE ( mmHg) Fig.ll. The relation between the cosmic ray neutron monitor intensity and barometric pressure, (b) Kerguelen, 1968 ○‥‥‥‥‥DEEP
RIVER
1 -30 −20I 968
一一︱II欄 II . 1 .1 1 11 1. 1 .1 .工 - ○ 1 1 1 ● ● I ● ・ ● ・ .. 1 . . . 1 1 . 2 ・ 1 1 . 1 L . 2 U 2 Lk 11 . 1 2 1 。 1 1 1 2 1 2 111 1 1 1 1 3 12 ! 3 1 1 1 1 2 。 3 2 1 3 1 1 I 2 1 I 2 。 2 1 I l l 2 1 1 1 1 1 1 j 1 1 2 11 I l l 23 1 J . 1 . . 1 1 1 n Ill 13 1 1 ●1 1 1● 1 1 1 i l j 1 . L 1 1 1 H . i . U 2 1 l - . 1 . 1 . 1 1 1 1 . 3 1 2 2 1 1 . 1 1 2 1 1 X 1 5 3 2 2 1 3 1 1 1 2 3 1 21 2 1 2 2 12 2 1 1 21 1 1 1 1 2 1 L 2 : ^ . 2 2 2 1 1 I I I ︱ t L I 1 2 1 . 1 1 1 1 1 ・ 1 。 11 11 11 |○ 1 1 1 BAROMETRIC PRESSURE ( mmHg)Fig. 12. The relation between the residual △/ of cosmic ray neutron intensity and the barometric pressure p. (a) Deep River, 1968
34 ︵% ) AllsZ3に一にZ一 ○ 0.5 0。0・ O Z〇ainaZ 卜η 5 :
KERGUELEN
−│.0:…… -30 −20Fig. 12. The relation between barometricpressure p
1968
141 1 1 1 2 1 。 (1997) Nat. S I I I I ∼ ︱ 1 1 1 1 − 1 1 − ︱ 1・ 2・●・,・1・・:・●・・i 1 1・・;・・. ・.・・. 1 1 1 1 1 1 1 1 1 . 1 1 1 1 1 1 1 1 1 ・ . 】 1 2 1 1 ・ 1 . 1 L 2 1 ‥ 1 ● 1 1 Z 1 . 1 … … I 1 1 1 1 1 1 1 1 1 ∼ I I I 1 1 ・ ・ ● ● 3 1 , . ・ . 1 11 1 1 ・ l ・ ・ ・ ・ ・ ・ ● ・ ・ ・ ・ ● ・ ● ・ (b) i , I 1 1 1 . 2 1 1 , 1 ・ 11 1 ・ I I I ● ● . I ● ・ . . . .. 1 , . . 1 - . ・ ・ ● ・ ● I ● I ● ● ・ ● ● ト | ○ ● ● ● ・ ● ● ● ● ● ● ● . ● ● 丿 ● 30 . 2 Z 1 11 1 。11 2・ 12 1 1 4 1 ・ . ● χ ● 1 1 , 1 2 2 ト , 1 ト 2 2 1 2 . E I . 1 ‥ ‥ ‥ ‥ 1 ・ . 1 1 I I 1 ・ 4 ↓ 1 2 1 1 1 1 1 1 1 1 1 1 2 2 1 1 2 4 ・ 2 1 1 1 . I1 1 1 1 U l . 1 1 1 1 2 1 ・ 1 1 1 2 1 3 . 3 2 1 1 1 1 1 1 1 . ・ ・ . . 1 1 . . 1 . - 1 1 1 1 3 . し 1 d . パ . 1 ・ ・ ・ ・ ・ 1 ・ ・ ・ 丿 ● ・ ・ ● ・ ・ ・ 1 ・ 2 . 21 1 二 し 1 1 ・ ・ ・ . I 1 2 U . 4 1 1 1 ト ・ ・ ・ . 1 1 1 1 2 1 . I H 2 1 1 . ・ 1 1 1 1 1 1 1 . 7 1 1 1 1 1 1 1 , 1 t 1 ・ , 1 1 1 1 . 1 .1111 2 1 1 1 1 11 .1 1.1 111 111 1 . 1 Z ・ |○ 1 . . 1 1 1 1 1 2 1 20 0 日AROMETRIC :PRESSUREニ( mmHg)the residual △7o卜\cosmiと∧肺y neutronうntensity and the
(b) Kerguelen, 1968 1=・..・. .・:・ y ・・
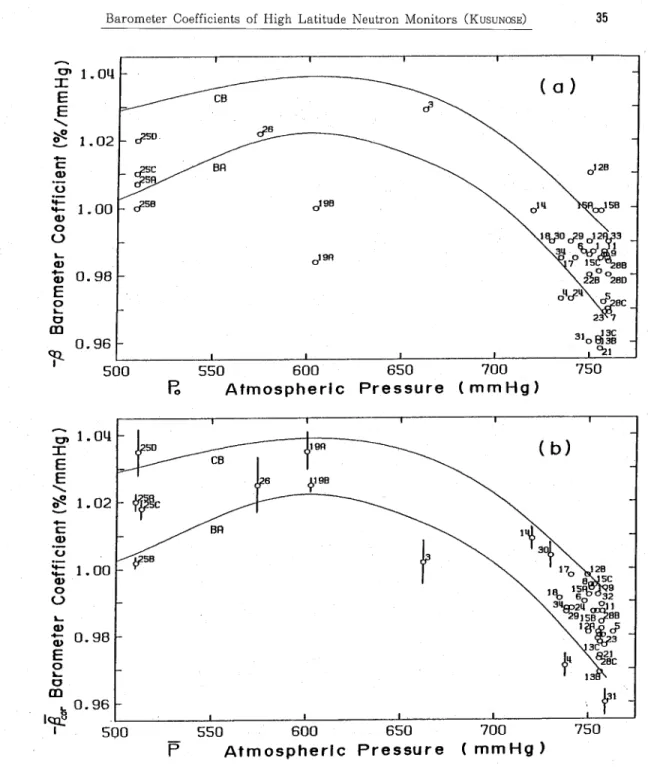
Figure 13 (a) shows the relation between the reported barometer coefficient β and the used standard pressure p・ヽAs seen in the figure the reported barometer coefficients of individual stations scatter widely even at an identical st紅臨rdニpressure. Two curves are
observed barometer coefficients (%/mmHg)of the nucleonic component as a function of
atmospheric depth (mmHg), for stations at:cuto拝レrigidi牲レ 「2∧GV. =
Those curves are obtained by the different two レworks (BA: Bachelet et al。, 1965, CB:
Carmichael and Bercovitch, 1969). From the reported barometer coefficient β and the
residual barometer coefficient △β, the corrected pressure coefficients i。
: β。=β十△β。 ‥‥‥‥‥‥‥‥‥‥‥‥ (5.3)
The dependence of the corrected pressure coeffic加財sβ。9 on the pressure is presented in Fig. 13 (b). Scattering of the points in (b) is much smaller than in (aレThis suggests that
the newly derived values of β。are evaluated to be more accurate than β.
Table 4 is the list of cosmic ray犬stations fro血which neutron data \are used in the
present analysis. Two stations, Mt. Washington and Sulphur Mt. are excluded from the
spherical harmonic analysis because they are mo!jntain stations, but 攻reapplied to the examination of barometer coefficients.
︵`エEE/%) iUd\O\UBOO J949EoJog 9'-ぺ □l 工EE/%)iU9!O!a900 ﹄919EoJDQ
ヅ
Barometer Coefficients of High Latitude Neutron Monitors (Kusunose)
1.0q 1.02 1.00 0.98 0.96 500 1.0q 1.02 1.00 0.98 ○。96 500
Po
− P 550 600 Atmospheric 550‥ 600
Atmospheric
650 700Pressure
(mmHg)
650 700
Pressure
(mmHa)
35 750 750Fig. 13. Barometer coefficient and atmospheric pressure. Figures attached to marks correspond to those in Table 5.1. Curves are reproduced from the papers, BA: 1962-1963, Bacheletei al. (1965). CB: 1965, Carmihael and Bercovitch (1969).
(a)β:thebarometer coefficients of the neutron monitors and p: the standard atmospheric pressure, those are reported from respective stations.
−
(b)β.:the mean barometer coefficients corrected by the present analysis. Error bars mean −
the standard deviations. ρ:mean pressure. The period of averages correspond to their respective analyzed years as given in Table 5.1.