The Familial Economy of Household Fisheries in
Indonesia
著者
KATAOKA Chikashi, TAUFIQ Muhammad
journal or
publication title
鹿児島大学水産学部紀要=Memoirs of Faculty of
Fisheries Kagoshima University
volume
39
page range
173-200
別言語のタイトル
インドネシアにおける小漁業世帯の家族主義的経済
Mem. Fac. Fish. Kagoshima Univ., Vol. 39, pp. 173-200 (1990)
The Familial Economy of
Household Fisheries in Indonesia
Chikashi Kataoka* and Muhammad Taufiq* *
Keywords: Indonesian fishing villages, household fisheries economy, familial relationship, mutual cooperation
Abstract
The objective of this study is to investigate the characteristics of the familial economy of household fisheries in 2 urban and 2 rural fishing villages of Pati Regency, Central Java, Indonesia. We analyzed the results of the socio-economic survey on 152 fishing own er households and 92 fishing labor households from the old and the young generations.
Household fisheries in this area is still in a stage of transition from a subsistence to an exchange economy. In this stage social obligations in the family and in the community are strong, while contractual obligations of commercial type are unfamiliar. These communi ties are characterized by a high degree of cooperativeness and cohesion which are based on the spirit of "kekeluargaan" (familial principle). This spirit was moved by the motivat ing force of social justice which lead by the feeling of "malu" (shame) and uhutang budf (to owe a favor). Their organization has a great potential power for the promotion of their self-reliance and participation in the development process.
1. Introduction
Since the Indonesian government is aware on the important role of the people's participa
tion in the development process, household fisheries as a primary unit of social organization has received increasing attention. They are not only the basic social unit for most of econo mic and social activities, but also as an object of terminal goal of the fisheries development
policy. As known, until now Indonesian fishery is still dominated by small scale operations using small boats and simple gear, and rely on labor intensive and continually restricted to the coastal water1*. In 1986 contribution of small scale fisheries accounted about 90% of the
total fish production2*. Nevertheless they are often faced with seemingly impossible obstacle
in their attempts to uplift themselves conditions3*; hence, they need financial and technical
assistance from the government, as well as their organization.* Department of Marine Social Science, Faculty of Fisheries, Kagoshima University, 50-20 Shimoarata 4, Kagoshima, 890 Japan.
Doctoral Course at the United Graduate School of Agricultural Sciences, Kagoshima University,
In the recent, there has been remarkable increased in awareness of some development
planners that the top-down approach which commonly used is not working. Paternalistic gov
ernments and local elites either could not make any evaluations nor decision concerning development program that may result in the effectively increasing the quality of life of the
poor rural areas. They also lacked some necessary informations at the local level or feared
that potential changes would reduce their power5*. In case of the Indonesian government,
lack of necessary informations at the local level looks remarkable. Data or publication pertaining to the necessary information such as socio-economic and ecological conditions at the
local level is very limited. Many cases on the failure of the fisheries development showed that the development policies did not conform with local conditions, because it was directlyadopted from the western concepts with only slight modification6*, or if any, the modification
based on the knowledge of farming sociology7*.
As well known, there are many differences between the fishing community and the peasant agriculture. These are: the nature of production unit, opportunity to investment, production
process, marketing and the yield in relation to nutrition and food habits. *. All of these fac
tors, resulting in the differences of personal temperament and behavior of the fishermen
compared to that of farmers. Therefore, any policy or program which was successfully im
plemented for the farmers not always succeed with the similar degree in the fishing
society9*.
The economic life of household fisheries is characterized by predictable variations in the availability of target species. The seasonality of fishing has influenced several behavioral
responses which are reflected in day to day life10*. In fishing they are as hunters, depend
pa-rasitically on whatever natural resources has to offer. They can not control weather and location of fish. When they are lucky, they have enough food and the income to spare, and they may satiate themselves. Their economic activities depend on the work of their family members, as the conditions in an agricultural peasant economy. The decisions are taken with a view to domestic needs. Production is based on familial requirement. Because their fishing is uncertainty, frequently they get into speculating attitudes to maximize their catch as well as their income such as capitalist firm.Since household fisheries always face the uncertainty in fishing, they need entering into
agreements with each others to minimize the risk of starvation11*. The rise of these agree
ment is oftenly in the form of social norm or social organization displayed within household members, relatives, companion, neighbor of their society. Generally, social norm in Indonesia is based on the spirit of ukekeluargaann (familial principle). The spirit of family cooperation, compassion and mutual respect for others are found equally among all sections of thepopulation, and are transformed into social solidarity12*.
The norm of social relationship or social organization, traditionally performed multiple
functions including community decision making and communication with the outside world *.
Automatically these norm and social organization will influence to the fisheries development program, directly or indirectly. Therefore, if the people's participation approach will be used in the development process, the socio-economic data pertaining to life and work at the household and village level are very important. These data are needed almost in all stages ofKataoka and Taufiq '. The Familial Economy of Household Fisheries 175
the development process, such as in motorization of fishing boats, modernization of fishing techniques and gears, fish processing, fish marketing system, resources management and also in arrangement of fishermen's organization in the form of cooperative movement or
fishermen's association.
This study focuses on the socio-economic characteristics of household fisheries in Indone sian fishing villages. The present of their socio-economic conditions are discussed against the background of their management system pertaining to their activities as a primary unit of organization in coastal fishing community. Socio-economic factors were be analyzed are local economic circumstances, fishing activity, their socio-demographic profile, the occupa tional structure and background, income and expenditure, and their familial relationship. More specifically objective of this study is to investigate the characteristics of the familial economy of household fisheries in Pati Regency of the northeastern coast of Central Java,
Indonesia.
2. Survey Methodology
Pati Regency was chosen as a study area due to several important and practical consid erations. Pati Regency is an agricultural region with fisheries sector which is still domin ate d by small scale fisheries. Compared to the other regions in Indonesia, Pati Regency is in the middle stage of development and their fishing community is still in a stage of transition from a subsistence to an exchange economy; therefore, it might be acceptable as a typical representative of Indonesian fishing communities. Based on our preliminary investigations, it was reliable that the study area is one of the populous coastal areas in Java where house hold fisheries are still in the developing process; characteristics of local traditions, belief, peasant and money economy are existing in their economic behaviors simultaneously. Com munication, personal support and other facilities from local government and village coopera tive unit of Pati Regency (KUD uSarono Minon) are also as important considerations, parti cularly during the fieldworks and data collection.
The data were collected during two periods. The first period was for 6 weeks in July and August 1988. In this period, test questionnaire and secondary data collection from the gov ernment offices of Pati Regency, village offices and other relating publication were con ducted. In the second period, during almost 2 months from August to September in 1989, we focused on the primary data collection and completed the secondary data.
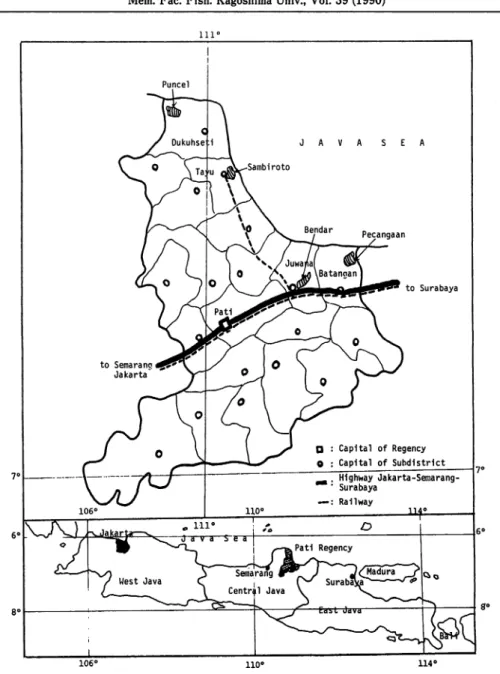
Based on the demographic data obtained from the statistical office of Pati Regency, we chosed four fishing villages: Bendar and Sambiroto fishing villages which located near the center of local economic activities were chosen as representatives of the urban fishing com munities. While Puncel and Pecangaan fishing villages which relatively isolated and far from the center of local economic activities were chosen as representatives of the rural fishing communities (See Fig. 1). It is based on the assumption that there are differences between urban and rural villages, particularly in the factors influencing the social-economic condi tions of household fisheries such as alternative jobs available to the household members, or
106° no" 114° Fig. 1. Pati Regency and Location of the Study Areas (Insert is Java Island)
to the household head during off season, transportation and information facilities, opportun ity to get a credit, to buy the means of production, to sell fish production, to get health faci lities, and educational facilities. Therefore, the way of thinking between the fishermen who
live in urban areas may be different from with those who live in rural areas.
Based on the list of fishermen in the KUD uSarono Mino"14\ 260 samples consist of 156
(60%) fishing owner household (FOH) and 104 (40%) fishing labor household (FLH) wereKataoka and Taufiq '. The Familial Economy of Household Fisheries 177
Table 1. General Economic Potential inthe Four Selected Fishing Villages in 1988
Items Urbana r e a s Rurala r e a s
Bendar Sambiroto Puncel Pecangaan
Total area (Ha) 194 183 992 49.5
- paddy field 75 41 106
-- brackishwater pond 102 109 148 40
- dry field 8 25 364 7
- estate and forest - - 371
-- others 9 8 3 2.5 Total population 1,888 3,145 4,980 900 Working population 1,195 2,522 2,827 372 — farmer 36 65 1,092 -- landless farmer - 190 1,133 -— fishermen 843 508 38 366 — businessmen - 82 7 -— industrial labor - 27 87 -- construction labor 4 76 43 -— trader 9 163 245 6 - transportation 2 21 59 -— government official 11 55 42 -- others 290 1,335 81
-Source : Monograph from each village offices, 1989.
chosen. Yahaya and Yamamoto (1988), used the terminology of FOH for the fisher men who
are owner-operators of means of production (boat, engine and gears), and FLH for fishermen
who are working as hired labors in fishing15*. As is known, the fishing community is com
posed of FOH and FLH. The relationship between FOH and FLH is important since the fishing is uncertainty and risky activities, so that their operations always mobilize fishing
crew, particularly to spread the risk of fishing. In addition analysis of their relationship and income is important to estimate probability of exchange of status from FLH to FOH or
other way around. Generally, their status, either as FOH or FLH, reflect on their level of
living standard, position and function in the community.
The primary data was collected through the intensive interview of 34 samples (about 13% of the total samples) and remainders (226 samples) through the questionnaire form. Of the 226 samples, 210 samples were eventually included for analysis. The rest, 16 samples were
unavailable due to either did not send back or incomplete answers. Then number of samples in each village are 44 FOH and 26 FLH for Bendar, 44 FOH and 20 FLH for Sambiroto, 34 FOH and 22 FLH for Puncel, and 30 FOH and 24 FLH for Pecangaan village, respectively. Each sample was initially interviewed to establish basic parameters, such as individual data
(age, marital status, level of education, inhabitant status, experience in fishing activity and previous job), family size and structure, employment, income and expenditure, management of
Particularly to FOH, questions referred to the nature of fishing management, such as pro
duction, fish marketing, and credit facilities.
3. General Condition of the Study Area
1) Pati Regency
Pati Regency, located in the northeastern coast of Central Java, consists of 20
ukecama-tan" (subdistricts), and 405 udesa" (vellages). Based on statistical data in 198816*, the total
area are approximately 149,119 ha. Of which 41% were paddy field, 21% were dryfield/ garden, 18% were buildings and yards, 12% were state forest, 5% were brackishwater pond,
and the rest 3% were plantation, roads, and others. With a total population of 1,050,839
peoples, population density was 705 persons per km2 which is below the average of Central
Java of 740 persons per km2.
Based on explanations of the statistic officer of Pati Regency, working population is mean
from the population who have achieved 10 years old and earn an income. Total working population accounted for 725,757 peoples or 69% of the total population. Of which 452,668 peoples (62%) are working in agricultural sector including brackishwater pond farmers. Constituted about 49% of them are as self-employed peasants, 50% are as landless laborers,
and only 1% are as fishermen. The remainder consists of several professions such as businessmen (2%), industrial labors (3%), construction labors (2%), traders (4%), and the others (army, civil bureaucracy, etc.) which were 27% of the total working population.
In 1986, the Regional Domestic Product (RDP) amounted to Rp. 342,5 million. Contribu tion of agricultural sector is dominant, approximately 52% of the total RDP, followed by trading sector (16%), industrial sector (10%), government sector (7%), housing, transporta tion, construction and other sectors were 4%, 3%, 3%, and 5%, respectively. Fisheries sec tors both marine fisheries and inland fisheries (brackishwater and freshwater fisheries) con
tributed about 6% of the agricultural sector or about 3% of the total RDP. Even though the fisheries sector occupy only a small share of the RDP, they play an important role as a ma
jor source of animal protein, income, and employment, particularly for the coastal villages. Marine fisheries in Pati Regency are dominated by small scale fisheries. From the total number of fishing boats (874 units), more than 95% (834 units) are using outboard engine
and 5% (40 units) are using inboard engine. Motorization program in Pati Regency have been
started since the First Five Year Development Plan (REPELITA I) around the first year of 1970s and was intensified after the "trawl ban" in 1980. The result of these programs shows
that since 1986, there are no sailboats in Pati Regency.
The trammel net is the most dominant fishing gear in Pati Regency. This gear was intro duced since 1978 by the fisheries office of Pati Regency with special purpose to elevate shrimp production and fishermen's income. Until the end of the Third Five Year Develop ment Plan in 1983, almost all of fishing units in Pati Regency are small scale fisheries. Af ter Juwana river which connecting fishing ground and landing place, was deepened in 1984,
Kataoka and Taufiq ' The Familial Economy of Household Fisheries 179
middle scale fisheries had increased gradually, particularly purse seine and gill net. The number of trammel net have also increased rapidly since the modernization program of fishing gears which was done very intensive as a consequences of the "trawl ban" in 1980. In
1988, the number of trammel net was about 45% of the total fishing gears, gill net was 10%,
purse seine was 4%, troll lines was 5% and the remainders (36%) are lempara, denis seine, lift net and other hook and lines. The composition of number of boat : gear : fishermen ratio in 1988 accounted for 836 boats : 1.266 gears : 3.242 fishermen; each boat uses 1.5 gears and was operated by 3.9 fishermen on average.
2) The four selected fishing villages
General economic potential of the four selected fishing villages in 1988 are shown in Table 1. Compared to Pati Regency, the four selected fishing villages are typically of coas tal villages than agricultural villages, except for Puncel village where its land is dominated by estate and forest (37%) and dry field (36%). While the land used in Bendar, Sambiroto and Pecangaan villages are dominated by brackishwater pond accounted for 53%, 60% and 81%, respectively. Especially in Pecangaan village during dry season (April to September) more than 60% of it brackishwater pond are used for salt production which is needed for consumption or preservation of fish. While paddy field in Bendar, Sambiroto and Puncel vil lages were about 39%, 22% and 11% respectively. This percentage are low compared to average 41% paddy fields in Pati Regency.
Except for Pecangaan, each village has utanah bengkok" or land usually in the form of paddy field, brackishwater pond or dry land which is used as incentive income for the mem bers of village office and utanah kas desan or land stored for the villages and used as a source of village income. uTanah bengkok" in Bendar accounted for 28 Ha, in Sambiroto was
18 Ha and in Puncel were 15.5 Ha. While utanah kas desan in Bendar accounted for 1.5 Ha
and in Puncel was 2.6 Ha. Sambiroto village has no utanah kas desa", so they have no village income from its land. As a substitute to the village income, a part of auction fee both from
marine fisheries and brackishwater fisheries is taken. It is also a part of retribution from
Tayu market in Sambiroto village. While income of Pecangaan village is allocated by the local government of Pati Regency, beside a part of retribution of auction fee both of marine and brackishwater fisheries. In addition each villages also have an other source of income from its farmers, particularly from the part of IPEDA (Iuran Pembangunan Daerah or the due for regional development) which are accounted relating to the productive land.
The number of working population in the four selected fishing villages varies ranging
from 41% in Pecangaan village to 80% in Sambiroto village. While Bendar and Puncel vil lages account for 63% and 58%, respectively, compared to Pati Regency which have 69% of
the total population. From the occupational composition shows that the four selected fishing villages are simple communities than Pati Regency as a whole, except for Sambiroto where working population in primary sector (farmers and fishermen) account 30% only, compared to Pati Regency of 62%. Working population in Bendar and Pecangaan villages are relatively
village agricultural sector accounts about 77% of the total working population.
It is true that Bendar is urban area, so they have higher opportunity to work in the other jobs in Juwana or other place, however, based on their opinion, to be a fisherman is better than the other job. For them, fisheries sector is more profitable than the others, every day they can earn cash-money and they have no problem with season, because during off season small scale fisheries can joint with purse seiners. While in Pecangaan village, the simple occupation shows the limiting opportunity of jobs for working population, due to the limiting potential of working population as well as varying the economic activities. On the contrary, in Sambiroto where the occupational composition is the most various than the others. It is a typical urban village with high opportunity of jobs for its citizens.
Table 2 show & the number of boats, fishing gears and fishermen which is based on the data from the KUD uSarono Mind". It is shown that Bendar village have a shortage of fishing crew. As known, each fishing unit of the purse seine usually organizes about 40
crew, gill net about 8 crew and for the trammel net about 3 crew. While number of fisher
men in Bendar village was 1.8 fishermen only for each boat, therefore, the owners of fishing boats also mobilize the crew from other villages, which particularly from Bajomulyo, Doro-payung, Bumirejo villages located close to Bendar village. Each fishing boat in Bendar use
in average 1.1 unit of fishing gears.
The composition of number of boats, fishing gears and fishermen in Sambiroto, Puncel and Pecangaan villages shows typically trammel net fishing unit is handled by 3 or 4 crew. In Sambiroto number of fishing boats accounts for 105 units with 129 gears and 361
fisher-Table 2. Composition Number of Fishing Boats, Fishing Gears and Fishermen in the Four Selected Fishing Villages in 1988
Items Urbanareas Ruralareas
Bendar Sambiroto Puncel Pecangaan
Fishing boat: 354 105 56 113 - inboad : 16 - - -— outboad : 138 105 56 113 Fishing gear : 394 129 41 150 — Purse seine : 40 - - -- Gill net: 55 5 - -— Trammel net : 187 110 35 98 — Seine net: 74 5 - -- Troll line : - 8 3 4 - Others : 38 1 3 48 Fishermen 643 361 210 372
Kataoka and Taufiq '. The Familial Economy of Household Fisheries 181
men or each boat is using 1.2 gears and is handled by 3.4 fishermen. In Puncel each fishing boat is using 1.3 gears and is handled by 3.8 fishermen. While in Pecangaan each fishing boat is using 1.3 gears and is handled by 3.3 fishermen, compared to the Pati Regency as a whole where each fishing boat is using 1.5 gears and is handled by 3.9 fishermen.
4. Economic Potential of Fishing
1) The trammel net fisheries
To analyze the economic potential of fishing here we focused on the trammel net fishing operation, because the majority of household fisheries in the study areas are using this net as a source of their household income. The considered factors are size of boat and engine, number of gears, number of crew, gross earning and variable cost, landing fee, net earning,
depreciation cost, interest of capital and income per crew. (1) Fishing boat and engine
Ordinarily measurement of a fishing boat is expressed by gross tonnage (GT). There are several formula for GT measurement of small fishing boats in existence which are similar in so far as each formula in some way combines several liner measures of the boats'
dimension17*. According to the Indonesian Directorate General of Fisheries (1986), the for
mula used to measure of the Indonesian small wooden fishing boat is as follows :
Table 3. Means of Production, Operating Cost and Earning Distribution per Unit Effort of Trammel
Net in the Four Selected Fishing Villages, August 1988
Items Urban areas Ruralareas
Bendar Sambiroto Puncel Pecangaan
1. Size of boats (GT) 4.1 2.5 2.8 3.3
2. Size of engine (HP) 9.5 5 7 6.3
3. Number of nets (pieces) 35 20 25 20
4. Number of crews (person) 4 3 4 3
5. Gross earning (Rp) 90,750 15,625 20,300 12,500 6. Variable cost (Rp) 4,950 1,950 3,700 1,400 -fuel 2,900 1,200 2,300 1,200 - ice 1,050 250 650 200 - others 1,000 500 750 500 7. Landing fee (Rp) 4,538 781 1,015 625 8. Net earning (Rp) 81,262 12,894 15,585 10,475
9. Depreciation and interest (Rp) 40,631 6,447 7,793 5,238
10. Income/crew (Rp) 10,158 2,149 1,948 1,746
LXBXDXO^
GT~
2.83
where L is length, B is breadth, D is depth, 0.6 is value of coefficient standard for small
wooden fishing boats, and 2.83 is cubic meters enclosed space is considered 1 gross ton18*.
Using this formula the average size of boat for trammel net in Bendar is about 4.1 GT as the biggest boat than the other villages, followed by Pecangaan were 3.3 GT, Puncel were2.8 GT and the smallest is in Sambiroto were 2.5 GT. All of these boats are using outboard
engine. The size of engine in Bendar is 9.5 HP, in Puncel 7 HP, in Pecangaan 6.3 HP and in
Sambiroto 5 HP (Table 3).
Price of boat and engine varies depend on the size and quality of wood. For example, a fisherman in Sambiroto bought a boat sized 2 GT with Rp. 850,000 and Rp. 1,000,000 for engine of 4 HP. He estimates that boat and engine may the usable for 5 to 7 years depending on his maintenance effort to keep his boat and engine.
(2) Fishing gears
Trammel net which is used for catching demersal fish, particularly for shrimp species is
constructed of three sheets of net which consists of small mesh size net hang loosely in the middle and two nets with big mesh sized are hang in both sides.
The size of trammel net in the study areas are relatively similar (length is about 34-37 m, and depth is about 1.5 to 2 m). Usually they buy the nets in Semarang, the capital city of Central Java, particularly if they need more than three pieces. The price is Rp. 26,000 per piece. While if they need only one or two pieces, sometime they buy from the KUD uSarono
Mind" or the traders who come to their village with price of Rp. 28,500 to Rp. 30,000 per
piece. Usually each piece is used for three to five months after many time of repair due to
torn off during the fishing.
The average number of trammel net per unit effort in Bendar, Sambiroto, Pecangaan and Puncel are 35, 20, 20 and 25 pieces, respectively. It is related to the combination of the size of boat, engine, environmental condition such as the river and location of fish landing, and
also the ability of owners. (3) Number of crew
Crew who are involved in fishing operation are relatively flexible both for number and
kinds of members. In a unit of effort it usually consists of household heads as an owner and
also as a skipper simultaneously and one, two or three crew. Usually the crew come from
the own household members or relatives, sometime from the owner's companion, friend or neighborers. Number of crew - including owners - in Bendar and Puncel villages is about 4
persons respectively, while in Sambiroto and Pecangaan villages it is about 3 persons, re
spectively.
(4) Fishing operation
All of the trammel net in the study areas are for one day fishing. They go to fishing ground usually around 5 a.m. and come back to the landing place around noon (11 a.m.—1
Kataoka and Taufiq ! The Familial Economy of Household Fisheries 183
p.m.) to 4 p.m. depending on the season and location. For example, it was dry season during the research study on August 1989; frequently the rivers in Sambiroto, Puncel and Pecan gaan become shallow. Therefore, the fishing boat could not pass through these rivers, parti cularly occurred when the low tide at the day time between noon to 3 or 4 p.m. Therefore, they should come back to the landing place before the low tide, because location of landing place in the study areas is separated about 1-2 km from the sea. On the other hand, there is no problem for the fishermen in Bendar because the river is large and deep, so they can
operate their boats until 2 or 4 p.m.
The main purpose of trammel net is to catch the demersal fish, particularly shrimp spe cies. Usually, at the day time the shrimps dwell in rocky crevices or at the bottom of sand or mud. Therefore, the net is set in zig zag in the fishing ground around some reefs or set in circular shape at the morning. If the fishing ground is sandy or muddy areas, after throw ing the gear, the boat comes back to the place where they started from and take the barrel. Then they pull up the rope which hang between the net and barrel. At the same time the boat moves in a semi circle until the net is completely changed direction. After that, the boat goes to another round and performs the same operation of towing. The operation is conducted many times until the time when they should go back to the landing place. In the dry season the fishermen in Bendar usually conducts 4 or 5 times. While the fishermen in Sambiroto, Puncel and Pecangaan only 2 or 3 times. Sometimes, they join operation of other fishermen to surround the fish in circle by net and force them to the trammel net like as in the operation of encircling gill net.
2) Earning and income distribution
During August 1989, the average gross earning of trammel net in Bendar is the highest of all the villages, accounted for Rp. 90,750 per unit effort per day. While gross earning in Sambiroto accounted for Rp. 15,625, in Puncel were Rp. 20,300 and in Pecangaan were Rp 12,500, respectively. The differences of these gross earnings might be due to the size of their boat and engine, and the time of their operation. In addition, average price of shrimp in Bendar is the highest than the other villages. During August 1989, average price of shrimp in Bendar accounted about Rp. 11,000 to Rp. 13,000/ kg, while in Sambiroto, Puncel and Pecangaan varies from Rp. 7,000 to Rp. 10,000. It might be due to the location of Bendar village which is very close to the center of fish market and almost of the factories of shrimp exporter have a branch in Jawana closcto Bendar village.
The variable costs in trammel net fishing are very simple, such as fuel, ice and other items including tobacco or foodstuff. Fuel consumption varies from 4 to 20 liters depend on the size of engine and period of fishing. The average price of fuel is relatively similar in the study areas accounted for Rp. 240 to 250 per liter. Also ice consumption varies from 5 to 80 kg depend on size of boat and time period of fishing. Average price of ice accounted for about Rp. 30 per kg. The other cost consists mainly of tobacco or foodstuff which are pre pared by the owner; the crewmen never protest whatever the owners prepared and they al ways agree on cost of those stuff during the fishing.
All of fishing units landing and auctioning their production at the TPI (Tempat
Pelelan-gan Ikan - fish landing place) are charged a landing fee accounted for 5% of the total gross
earning. Of which 2% is as fishermen's saving which is used by the KUD"Saroiio Mino" to substitute their economic activities and is given back to fishermen twice a year, usually be fore the uidul fitrf, the muslim festival after one month fasting and before the fishermen's festival for usedekah lauf as a grateful expression to the Almighty God for all of the liveli
hood which is received from the sea.
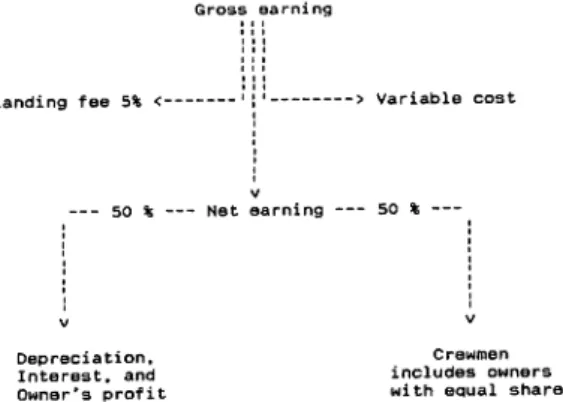
Based on general agreement between owner and crews the depreciation cost of boat, en gine and gears and interest of capital are accounted for at 50% of the net earning. It in cludes the owners profit. The remaining 50% is divided equally among all crewmen, including owner. The chart of earning distribution is described in Figure 2.
The average income of each crew in Bendar in August 1989 almost 5 times (Rp. 10,158) higher than that of other villages, followed by Sambiroto Rp. 2,149 Puncel Rp. 1,940 and
Pecangaan Rp. 1,746. Landing fee 5% <-Depreciation, Interest, and Owner's profit Gross earning -> Variable cost Net earning 50 % Crewmen includes owners
with equal share
Fig. 2. Flow Chart of the Sharing System between Owner and Crewmen in Operating Trammel Nets in Pati Regency
For the investment of a new fishing unit, in Sambiroto the price of new 2 GT boat was Rp. 850,000, engine 4 HP was Rp. 1,000,000, 20 pieces of gears were Rp. 600,000. There fore, the total capital investment is about Rp. 2,450,000. Every four months they should change about 50% of gears. Therefore, during a year they should pay 30 pieces X Rp. 30,000 = Rp. 900,000. If the income that can be saved for new investment is equal to all of the depreciation and interest cost, and the average profit is about Rp. 6,447 per fishing day
or Rp. 1,418,340 and the number of fishing day per year is 220 days, therefore, in a year
they can save Rp. 518,340: Rp. 1,418,340 - Rp. 900,000. If interest rate of capital is 18% per year and inflation is about 8%, the owner can reinvest for the new trammel net fishing
unit in about 6 years. With the similar manner the owners in Bendar and Puncel villages can reinvest in less than 6 years, while in Pecangaan they needs more than 6 years.
Kataoka and Taufiq '. The Familial Economy of Household Fisheries 185
5. Demographic Profile of the Household
1) Classification
The analysis of the socio-demographic profile is focused on the household head alone, be
cause this is closely related to the socio-economic conditions of the household as a whole19*.
The household heads of both FOH and FLH are classified into two categories by age group.
The first group is consisting of 40 years old and more and representing the old generation,and the second group is less than 40 years old representing the young generation. This age
group classification is based on the following assumptions:1. Household size of the household members from the old generation is higher than that of
the young generation. Most of the fishermen in the north coast of Java marry between 20 to 25 years old. Usually at 40 years old they heve decided the number of their children and also the first or second son or daughter become an adult with their potential to help or join in economic activities. On the countrary, the young generation are still in the process deter mining to their household size and all of the children still depend on their parents.2. The economic potential of the wife from the old generation is higher than that of the young generation. Since their son or daughter become adult and self dependent, the task to rear their children would decrease automatically. Therefore they could have opportunity of economic activities to increase their household income. Inversely, the opportunity for the wives of the young generation are limited by task to rear their children. In addition, econo mic potential of the children from the old generation are also higher than that of the young
generation. Therefore, the dependency of household members to the household head from the
young generation are relatively higher than from the old generation.
3. The opportunity to attend an education for the young generation are relatively higher than that of the old generation, and also their basic literacy. Generally the basic literacy affects their aspirations, ability and quickness to innovate. Educated fishermen are able to communicate better with the representatives of the fisheries development agencies than those who have no educational background. Therefore the educated fishermen frequently have greater chance to have the benefit from any development program such as subsidized
loan from the government.
4. The way of thinking of the young generation are relatively more unstable and frequently high mobility than the old generation, both in their business activity and in managing the daily life. In social activity, the old generation are relatively more conservative, while the
young generation tends to be individualistic.
2) Household size
Table 4 shows that the household size of the old generation is relatively higher than that of the young generation. The household size of the old generation in urban areas are
Table 4. Socio—demographic Profile of the Heads of Fishing Owner Household (FOH) and Fishing Labor Household (FLH)
Items Urbana r e a s Rurala r e a s
Bendar Sambiroto Puncel Pecangaan
FOH FLH FOH FLH FOH FLH FOH FLH
Sample size by age group:
-OG: 17 6 16 4 13 6 11 8 - YG: 27 20 28 16 21 16 19 16 Household size: - OG: <5 0 2 4 2 7 2 4 2 5 - 7 14 4 8 2 6 4 4 5 >7 3 0 4 0 0 0 3 1 -YG: <5 10 14 17 14 15 7 7 9 5 - 7 15 6 9 2 6 9 6 5 >7 2 0 2 0 0 0 6 2
Experience in fishing operation: -OG: <10 10 - 20 0 0 1 0 0 0 0 0 >20 2 2 9 1 7 1 3 2 -YG: <10 15 4 6 3 6 5 8 6 10 - 20 4 4 8 10 2 2 4 10 >20 14 13 16 4 15 12 12 4
Kinds of previous jobs : 9 3 4 2 4 2 3 2
- OG: Nothing Farmer 17 2 8 4 7 4 8 8 Labor 0 4 6 0 5 2 3 0 Others 0 0 0 0 1 0 0 0 - YG: Nothing 0 0 2 0 0 0 0 0 Farmer 18 9 13 12 13 10 12 16 Labor 9 3 2 0 6 4 5 0 Others 0 4 6 4 2 2 2 0 Inhabitant status: 0 4 7 0 0 0 0 0 - OG: Native Comer 15 5 9 3 13 4 9 8 - OG: Native 2 1 7 1 0 2 2 0 Comer 18 16 17 14 21 10 16 16 9 4 11 2 0 6 3 0
Note : - OG (Old generation) = 40 years old and more - YG (Young generation) = less than 40 years old Sources : Field research (1989)
relatively higher than that of in rural areas, while the young generation in urban areas are less than that of in rural areas.
The household size of FOH both of the old and the young generations are higher than that of FLH. Generally, this is because the household income of FOH is relatively higher for the extend family. On the other hand, some of the family members of FLH migrate to look for the jobs in urban areas, particularly to Semarang, the capital of Central Java, or to Sura
Kataoka and Taufiq '. The Familial Economy of Household Fisheries 187
planning by the government may also play an important role to control the size of household,
particularly for the young generation in urban areas. The 78% of FLH of the young genera
tion in urban areas have members less than 5 persons and the rest of 22% have member be tween 5 to 7 members.
3) Experience and occupational background
Almost all of the old generation has 10 years experience or more, and half of them ex
perience of more than 20 years. In Sambiroto and Puncel villages were dominated by FOH who have experienced for 10 to 20 years. The young generation, however, are dominated by
the household head with experience for 10 to 20 years, except for FLH in Sambiroto and
Pecangaan villages who has experience less than 10 years.
Experience in fishing activity of FLH from the old generation is relatively higher than that of FOH. The 75% of FLH has experience more than 20 years, while FOH were about
61%. This may be related to their occupational background. FLH from the old generation who are directly involved in fishing was about 75%, while FOH was 70%. It is also indicated that fishing experience has no significant effect to change the status of the fishermen from the labor to the owner.
The kind of previous jobs of the young generation is relatively more various than that of
the old generation, except for FLH in Pacangaan. Both the old and the young generations of
FLH in Pecangaan have no experience with other jobs, because after formal education they directly join in fishing activities. It indicates that alternative jobs was limited. Even though
Bendar and Sambiroto are located in urban areas, the old generation of FOH in Bendar and FLH in Sambiroto also didn't have any experience with other jobs. It might be true that
previously the alternative jobs in urban areas were also limited, but another strongerreason is that most of them thought to be a fisherman is better than to do the other jobs. It is be cause they were already familiar with the fishing activities, and they believe that the fishing can provide the better daily income, even though risky and uncertainty.
4) Inhabitant status
Both the old and young generations in the study areas generally are native fishermen, par ticularly FOH in Puncel and FLH in Pacangaan. There may be no potential to pull new com ers to become FOH in Puncel or FLH in Pacangaan. FLH in Puncel, however, have relative ly higher potential to pull new comers for the young generation than that for the old genera tion and for FOH in Pecangaan it was the contrary.
The potential of fisheries sector in Bendar to pull new comers for the young generation is relatively stronger than that for the old generation. On the contrary, in Sambiroto village the ratio of number of native to new comers for the young generation is relatively lesser than that of the old generation. The previous jobs of the new comers for the young genera tion of FOH in Bendar and the old generation of FLH in Puncel are the farmers. While the young generation of FLH in Puncel is either from farmer or laborer. In this case fisheries
Table 5. Occupational Background of Family Members of Fishing Owner Household (FOH) and
Fishing Labor Household (FLH) in Percentage
Items
Main jobs on the father side :
Fishermen Farmer Trader Labor Others
Mainjobs on the fater in law side:
Fishermen Farmer Trader Labor Others
Main jobson the own'srelatives side:
Fishermen
Farmer
Trader Labor Others
Main jobs on the wife'srelatives side:
Fishermen Farmer Trader Labor Others Urban areas Bendar Sambiroto FOH FLH FOH FLH Rural areas Puncel Pecangaan FOH FLH FOH FLH 77 46 45 35 35 82 100 100 3 15 14 18 29 18 0 0 10 8 9 21 6 0 0 0 5 8 14 14 11 0 0 0 5 23 18 12 19 0 0 0 69 47 32 22 6 18 100 100 13 15 18 14 64 64 0 0 5 15 9 17 12 9 0 0 0 0 9 11 12 0 0 0 13 23 32 36 6 9 0 0 46 53 34 56 48 40 77 67 5 9 16 7 30 33 0 0 0 6 20 9 6 7 0 0 13 23 7 9 5 11 0 0 36 9 23 19 11 9 23 33 24 38 21 25 29 35 56 46 6 18 10 12 37 45 4 5 11 4 8 25 2 10 7 8 21 25 37 21 10 5 0 3 38 15 24 17 22 5 33 38
Sources : Field research (1989)
sector in both urban and rural areas relatively have a potential to pull the new comers from the other profession, particularly from the agricultural sector. There are many cases that
the farmers pushed out from the agricultural sector move to the fisheries sector due to the population pressures in agricultural communities and as causalities from introduction of new
rice production technology which limits employment opportunities20*. In other cases they
move to the fisheries sector through marriage to a fishermen's daughter.
5) Occupation of family members
Occupational background of the respondents can be seen from the occupation of their father and father-in-law. Table 5 shows that main jobs of the father side both in urban and in rural areas are dominated by the fisherman. Occupation of their father in urban areas is relatively is more various than that of in rural areas, except the father of FOH in Puncel
Kataoka and Taufiq ! The Familial Economy of Household Fisheries 189
which is more various than the father of FOH in Bendar.
The main jobs of the father-in-law are relatively more various than that of the father. These are still dominated by the fishermen in Bendar and Pacangaan, but in Puncel was
dominated by the farmers, and in Sambiroto it was the most varied of all.
The main jobs of the respondent's relative and the wife's relative represented the occupa tional structure of the new generation in the study areas. Relatively the occupation of the new generation is more various than that of the previous generation. It shows that the young generation have alternative source of income more than the previous generation. This is re lated to the increasing communication facilities and improving economic from the other sec
tors.
In the study areas there are no special ties for son or daughter to inherit the parent's
occupation. If the son or son-in-law want to involve in fishing activities they must start from
fishing crew. Even though the parent has many fishing units usually the son or the
son-in-law cannot inherit to the own parent automatically. It depends on several factors including
the subjective factors such as attitude, responsibility and capability of the son or the son in
law. In many cases if the son or the son-in-law become an owner, their parent or the parent
in law subsidizes as much as possible or they can borrow the money with guarantee from the
parents. When the parents die without a special message to their children, all of the parent's property are divided for all their children. If they are muslim, usually the son receives 2
times of the daughter's share.
6. Economic Potential of the Household Members
1) Household income
To analyze the potential of the household members are limited, because it is difficult to
quantify all of real potential of the household members, particularly their function as a unit of production and consumption simultaneously. In term of household income, the household members also receive part of their income in noncash form through consumption of their own
production, through barter exchange, or noncash payment for hired laborers21*. Therefore,
analysis of the potential of the household members in this study are limited to the analysisof the dependency of the household head to the fishing sector, contribution of income from the household head side, wife side, and also from the children and additional household mem bers to the total household income.
(1) Dependency on the fisheries sector
The dependency to the fisheries sector by household head of FOH and FLH as a source
of income varies, both in urban and in rural areas. Table 6 shows that the old generation of fishermen generally have higher dependence on fisheries than that of the young generation,
except for FLH in urban areas. The percentage of full time fisherman of FLH in urban
Table 6. Source of Income and Income Contributors of the Member of Fishing Owner Household
(FOH) and Fishing Labor Household (FLH)
Items Urbana r e a s Rurala r e a s
Bendar Sambiroto Puncel Pecangaan
FOH FLH FOH FLH FOH FLH FOH FLH
Income from fishing operation:
- OG : Full-time Part-time major 2 2 6 1 7 4 4 2 Part-time minor 15 4 10 3 6 2 6 6 - YG : Full-time 0 0 0 0 0 0 1 0 Part-time major 4 10 5 5 6 4 10 7 Part-time minor 20 8 22 8 13 12 9 9 Income contributors : 3 2 1 3 2 0 0 0
from husband side:
- OG : > 75% 4 2 3 1 4 2 4 4 50 - 75% 10 3 11 2 9 4 6 4 < 50% 3 1 2 1 0 0 1 0 - YG : > 75% 12 8 11 6 10 9 12 11 50 - 75% 11 10 16 7 11 7 7 < 50% 4 2 1 3 0 0 0 0
from wife side:
- OG : > 50% 4 2 0 1 0 0 3 0 25 - 50% 11 3 7 3 2 2 4 5 < 25% 2 1 9 0 11 4 4 3 - YG : > 50% 4 2 4 2 0 0 2 0 25 - 50% 10 10 16 8 8 4 4 4 < 25% 13 8 1 6 13 12 13 12
from children and additional members side:
- OG : > 25% 0 0 0 0 4 0 0 0 10 - 25% 6 4 7 4 3 2 3 3 < 10% 11 2 9 0 6 4 8 5 - YG : > 25% 0 0 2 0 2 3 0 0 10 - 25% 6 11 6 4 7 6 9 7 < 10% 21 9 20 12 12 7 10 9
Note : - OG (Old generation) = 40 years old and more
- YG (Young generation) = less than 40 years old
Sources : Field research (1989)
Almost all of the household head of FOH and FLH from both the old and young generations
are dominated by part-time major fisherman, except those of FOH from the old generation in Puncel and FOH from the young generation in Pecangaan, which are dominated by the full-time fishermen. While for the young generation there are many household heads of
part-time minor fishermen, particularly in urban areas.
Generally, the dependency of FLH in urban areas are higher than that of FOH. The num
Kataoka and Taufiq ! The Familial Economy of Household Fisheries 191
generation. While FLH accounts for 30% for the old generation and 42% for the young gen eration. On the contrary in rural areas dependency of FOH is relatively higher than FLH. The number of full time FOH in rural areas was 46% for the old generation and 40% for the young generation, while FLH was 43% for the old generation and 34% for the young genera
tion.
(2) Income contribution of the household head
Contribution of household head to the total household income varies both for the old gen eration and the young generation. The old generation both in urban and rural areas contri butes between 50 to 75% of the total household income. While the young generation in rural areas contributes more than 75%, except for FOH in Puncel. In urban areas, however, the
household head who contributes between 50 to 75% is relatively dominant, except for FOH
in Bendar which contributes more than 75% of the total income.
The household head of FOH from the old generation who contributes more than 75% accounts for 26% as compared with the young generation of 47%, while who contributes less than 50% accounts for 11% against the young generation of 6%. The similar goes to FLH
from the old generation who contributes more than 75% accounts for 38% as compared with
the young generation of 50%, while from the old generation less than 50% accounts for 8% and from the young generation is 7%.
(3) Income contribution of the wife.
The wife who contribute more than 50% of the total income in urban areas is relatively higher than in rural areas, and also the wife side contribution from the old generation are higher than that of the young generation. In urban areas both the old and young generations are dominated by the wife who has income between 25 to 50% of the household income. While in rural areas it was dominated by the wife side who contributes less than 25%. Con tribution of the wife side from FLH in urban areas are relatively higher than that from FOH, except for the young generation in Sambiroto. While FLH in Puncel is higher than
that of FOH. On the contrary, FOH in Pecangaan is higher than that of FLH. The higher
income contribution from the wife in urban areas generally shows that the opportunity for jobs as a source of income in urban areas is higher than in rural areas.
More than 50% of a wife's contribution to the household income of the old generation in
urban areas was recorded at 16% as compared to 8% of that in rural areas. The contribution
less than 25% was recorded as 28% in urban areas compared with that in rural areas of 58%. The similar manner of wife from the young generation contributing more than 50% was
recorded as 13% in urban areas against 3% for that of in rural areas. While less than 25% in urban areas was 39% and in rural areas is 69%.
Fisheries activities in Java frequently offer wide opportunities for women to get
money-earning jobs. Most of them prefer to become fish mongers or traders or contributing in fish
processing such as smoked, salted, dried or steamed fish or by making paste and crisps22*.
Some of them are carrying small shop to sell foodstuffs or goods for the daily life.(4) Income contribution of the children and additional members
Contribution of the children and additional household members from the old generation in urban areas is relatively higher than that of the young generation. On the contrary, in rural areas it is lower, particularly in Puncel, where contribution from the young generation is higher than that of the old generation. While contribution of FLH from the old generation in urban areas is higher than that of FOH. Inversely, in rural areas it is lower. For the young generation of FOH both in urban and rural areas it is relatively higher than that of FLH. It is true that the children of the old generation have the higher economic potential than that of the young generation, but almost of the children's income of the old generation, particu
larly in urban areas usually do not contribute to the household income, but to meet their own needs or is saved for their future.
2) The standard of living
(1) Standardization
Frequently household fisheries in the developing countries come across as being the
poorest of the poor rural areas23*. Therefore to analyze their standard of living, it is mea
sured by their distance from the "poverty line". Most of the studies on the "poverty line" isderived from an estimation of the level of income necessary to ensure a minimun diet. Although the case studies differ widely about the standard of minimun diet, however, food consumption is a common indicator of the level of poverty in rural Java. The survey on the economy and social conducted by the Indonesian government or "Sosial Ekonomi NasionaF
(SUSENAS) which investigated the relation of food and income sufficiency, promulgate an assumption that the income equivalent to 240 kg of rice per person per year as the "poverty
line"24*. Because the price of rice is subsidized by the government, the "poverty line" has
changed according to inflation. Martosubroto (1987) notes that the national povertythreshold is originally pegged at 320-480 kg of rice equivalent25*. This national poverty
threshold is more reasonable than the standard of "poverty line", because increasing price ofother food and goods for daily life after 10 years is higher than that of increasing price of
rice. In case of rice, The Indonesian government have commitment to subsidize its price, particularly to control the price both at the producers and consumers' levels.
The percentage of expenditure on food of the total household expenditure, known as the Angel's coefficient, is another important indicator of standard of living. An Angel's coeffi
cient of 50% is sometimes regarded as a dividing line between developing and developed
countries26*. By using the standard of "poverty threshold" and Angel's coefficient, the living
standard of household fisheries in the study areas are figured in Table 7. (2) Income per capita
Table 7 shows that number of household fisheries, both of the old generation and of the young generation under the "poverty threshold" is relatively less than that in the above one, except for the old generation in rural areas where FOH and FLH under the line was 50%
Kataoka and Taufiq '. The Familial Economy of Household Fisheries
Table 7. Income per Capita and Expenditure for Food Consumption in the Four Selected Fishing
Villages
193
Items Urban areas Rural areas
Bendar Sambiroto Puncel Pecangaan
FOH FLH FOH FLH FOH FLH FOH FLH
Sample size: — OG : 17 6 16 4 13 6 11 8
- YG: 27 20 28 16 21 16 19 16
Income per capita * (kg)
- OG : < 320 5 2 7 2 6 4 6 5 320 - 480 4 3 5 2 7 2 5 3 > 480 8 1 4 0 0 0 0 0 -YG: < 320 7 8 8 6 7 5 5 9 320 - 480 9 8 15 8 11 11 14 7 > 480 11 4 5 2 3 0 0 0 Angel's coefficient (%) - OG : > 75 6 4 7 1 7 6 6 5 5 0 - 7 5 8 2 8 3 6 0 5 3 < 50 3 0 1 0 0 0 0 0 - YG : > 75 10 11 8 6 10 7 8 9 5 0 - 75 15 8 19 10 11 9 11 7 < 50 2 1 1 0 0 0 0 0
Note : - OG (Old generation) = 40 years old and more - YG (Young generation) = less than 40 years old
* The national poverty threshold was originally pegged at 320 - 480 kg of rice equivalent
(Martosubroto, 1987). Sources : Field research (1989)
and 64%, respectively. FOH from the old generation in urban areas who live in above the
line and under the line were some as 36%. While FOH from the young generation in urban
villages who live in above the line was 29% and under the line was 27%.Generally standard of living of FOH both from the old and the young generations is re latively higher than that of FLH. FOH from the old generation who live in above the line was 21% as compared with FLH as 4%. While FOH under the line was 42%, FLH was 54%. The similar manner was FOH from the young generation who live in above the line about 20% against FLH at about 9%. While FOH from the young generation who was in under the
line was about 28%, but for FLH it was 41%.
The household fisheries in urban areas have relatively higher standard of living than in
rural areas. The old generation in urban areas in above the line was recorded as 30% com
pared with 0% for that of in rural areas. The old generation in urban villages who live under
the line was accounted for 37% and in rural areas was 55%. The similar goes for the young
generation who live in above the line in urban areas was accounted for 24% and in ruralareas it was 4% only. The young generation in urban areas who lives under the "poverty
threshold" was recorded as 32% and in rural areas it was 36%.(3) Expenditure for food consumption
Angel's coefficient in both of the old and the young generations was dominated by the 50-75% range, except for the old generation in rural areas who is more than 50-75%. FOH of the old generation in rural areas was acconted for 54% while FLH it was 75%. It might be re lated to the income per capita that of FLH of the old generation in rural areas which is re latively lower and poorer than that of other groups.
Almost all of FLH's expenditure for food are more than 50%. All of FOH and FLH in ru ral areas spend more than 50%, while in urban areas many FOH spend less than 50% of
their income.
From these analyses it can be concluded that the standard of living of FOH is higher than
FLH, the young generation is relatively higher than that of the old generation and who live in urban areas are higher than that of those who live in rural areas.
7. Familial Relationship
1) General principles
Since fishermen always face uncertainty during fishing, they need to enter into agree
ments among each others to minimize the risk of starvation. In the study areas these agree ment are thriven as norms of social relationship which not elaborately plan beforehand, but thrives naturally. The norms of social relationship rise as a realization form of social
obligation in fishing communities.
Fishing communities in Pati Regency are still in a stage of transition from a subsistence to an exchange economy. Under these conditions social obligations in the family in its widest sense, and in the community are relatively strong, but contractual obligations of a commer cial type are unfamiliar. The moral principle of the social obligation in the study areas are generally based on the spirit of ukekeluargaann (familial principle). In this spirit, all of mem bers in the community such as the owner of household members, crew, neighborers and the others are qualified as a member of their big family or relatives. Therefore, one should help each others, the rich or the stronger should help the poor or the weaker. On the other hand, the poor or the weaker should help those who help him in the other form or in minimally not to injure them. Transactions among them frequently was carried out in the spirit of devoid
of commerciality. Preferably consisting of sharing, and non-reciprocable giving, and inherit ing from the closest relatives, or borrowing from more distantly related ones.
The spirit of "kekeluargaan" is moving in the motivating force of social justice and is con trolled by the feeling of umalun (shame) and uhutang budf (to owe a favor). According to Mubyarto (1985) social justice concerns the problem of dividing up God's sustenance, ie., the
distribution of income throughout the society27*. There are three basic guidelines which
society may regulate the distribution of income in accordance with the principle of justice:1) rights and responsibilities, 2) reciprocity, and 3) satisfaction of needs28*. With regards to
Kataoka and Taufiq '. The Familial Economy of Household Fisheries 195
the rights and responsibilities, justice will be safeguarded when the rights of the individuals are protected through the rules made by the society itself. In a tradition of reciprocity, peo ple feel they have committed an injustice, when they do not make every efforts to recipro
cate one good turn with another. In satisfaction of needs the society and even the state may be preferred to a macro-version of the family where satisfaction of needs for each member
are needed, even though the needs of each person will be different.
Scott notes that the moral idea involved in the norm of reciprocity is that one should re turn "favors" out of gratitude and that, consequently, equal exchange defines a fair rela tionship. It means that a gift or service received creates, for the recipient, a reciprocal
obligation to return a gift or service of at least comparable value at some future date29*. In
addition, Sahlins points out that there are three types of reciprocity namely:a. Generalized reciprocity: the transaction is at least putatively altruistic, such as among
parent and children.
b. Balanced reciprocity: the return is made straight off and is equivalent in value to the goods received. It is less personal than generalized reciprocity, but more economically. c. Negative reciprocity: transactions opened and conducted toward net utilitarian
advantage.30*.
2) Relationship within household members
Social relationship which thrive among household members in their economic lives usually arise in the form of informal jobs descriptions within household member. All cases in the study areas shows that fishing at the sea is monopolized by men, while women monopolizes domestic tasks such as cooking, weaving, and rearing their children. The women also are able to participate in the secondary process of the production in the shore. While their chil dren, depend on their capacity, can participate on men's or women's works. Boys usually help in fishing, while the girls help in secondary process such as in fish handling, processing or
marketing.
In many cases women work harder than anybody else in the family. For her, there is no more important thing than the security of her family. She have to see that her children are properly trained to do their share toward the building up of the economy in the family. Furthermore, she should also to get involved in direct money-yielding jobs. Most of them prefer to become a fish monger, fish trader or selling foodstuff or the needs of daily life in the small shop. Due to higher competition and availability of the jobs opportunity, the women in urban areas seem to work harder than those who live in rural areas.
There is no commitment to the children, particularly to the son or the son-in-law to con
tinue their father's fishing, both in urban and in rural fishing communities. Nevertheless, in
the rural fishing community, usually the parents hope that their sons or the son-in-law in volved in fishing. It is particularly when the parents became older and the father could not fish any more by alone. They still have chance to participate in the secondary process of their son or son in-law's fishing activity. In urban areas, however, usually the parents hope their son or son in-law engages in other jobs. They feel that the fishing is too risky and
un-certainty, and they could not reach the better life in the future. Therefore, some of them are ambitious to enroll their son in higher education to get other jobs. In case of Bendar,
however, there are many young men who have high educational level involving in fishing ac
tivities, particularly the owner's son or son in-law.
Although the parents could not oblige their children to take care their old age and they
could not longer involved in the economic activity, however, the children mostly aware that
they have an obligation to take care of their parent, resemble as when their parents took
care of them when they still young.
3) Relationship between owners and crew
In case of household fisheries in the study areas, the fishing is carried out by the small boats with out-board engine, and operated by two or three men. Generally the crew are
organized around a core of the family, particularly by the sea-going ownership. For the non-sea-going ownership the crew are organized around a core of neighborhood, friends or others. Reciprocity between owners and crew bases on two types of relationships. General ized reciprocity, if the owners are the own household members or close relative. Balanced
reciprocity if crew are far relatives, friends or neighbor.
A partron-client relationship arises a typical balanced reciprocity which is merely a con venient shorthand for a vertical exchange relationship. In this relationship both owner and crew have rights and responsibilities. It was characterized by a substantial reciprocity and provides wide ranges of economic and social protection to dependents in return for their labors and supports. Owners as a patron, in addition has certain right over his crew as client, also responsible to his crew for providing them aid for their needs, protection from physical harm and other troubles.
4) Relationship within the community
In many cases transactions between two individuals or within a group takes place without professional intermediaries. It is generally embedded in more or less traditional
relationships31*. The transactions between two individuals may range from rather unspeci
fied, such as the provision of labor to the neighbor in case of sick on the utenggang rasa" (mutual understanding) relationship, where the neighbor will reciprocate in the future if re quired, to write an agreement in which the amount of loan and repayment date, for example,are stipulated. In these cases uunsur kepercayaan" (on trust factor) is more important than that of written agreement.
In a sort of way, there are many types of social relationship in fishing communities in
volved in the collection of savings to be spent on specific purposes, such as "arisan" (lottery by neighborhood wives) and the provision of loans in case of emergencies, the payment of ex penses relating to birth, marriage or death, and the costs of religious festivals, etc. The ugotong-royonff is the most popular form of mutual assistance in Java. In the tradition of reciprocity within the fishing community, every service received, solicited or not, demands a
Kataoka and Taufiq '. The Familial Economy of Household Fisheries 197
return, with feeling of umalun and uhutang budf providing the motivating force. General re ciprocity in the four fishing villages in this study is described in Figure 3.
generalized balanced negative
reciprocity reciprocity reciprocity
house
holds
relatives outsiders/
strangers
"tenggang rasa" (mutual understanding)
patron-client
"gotonq royong" (mutual cooperation)
-- degreeof relationship
Fig. 3. General Reciprocity in Fishing Village based on the Spirit of "Kekeluargaan"
8. Conclusion
This study has focused on the investigation of the socio-economic characteristics of household fisheries in the four fishing villages of Pati Regency of the northeastern coast of Central Java, Indonesia. Based on the sociodemographic profile, economic potential and familial relationship of the fishing household, a description of the characteristics of house
hold fisheries was described.
Relatively, the income of FOH and FLH using the trammel nets are influenced by the size of boat and engine, operation time, price of shrimp, location and condition of river which must be passed through from fishing ground to the landing place. Due to these factors fishing conditions in Bendar is better than the other villages, and the average income of each crew in Bendar is higher than that of the other villages. In August 1989, average in come of each crew per unit effort in Bendar was about 5 times higher than that of the other villages. If all of the depreciation and interest cost and profit are saved, the time needed to reinvest in the same fishing unit, FOH in Sambiroto is about 6 years, while in Bendar and Puncel are less than 6 years, and in Pacangaan more than 6 years.
Household fisheries is characterized by the household size of FOH both from the old and the young generation are larger than that of FLH. Generally, it was because the household income of FOH are relatively higher than that of FLH. Therefore, they are able to provide a haven for their members, children and extended families. In other cases, it was shown that some of the family members of FLH migrate to try to look for other jobs in urban areas, particularly in Semarang, Surabaya or Jakarta. The program of family planning from the government also play an important role to control the size of household, especially for the