Does market upgrading benefit farmers? :
market differentiation, contract farming, and
professional cooperatives in China's pork
processing industry
著者
Watanabe Mariko
権利
Copyrights 日本貿易振興機構(ジェトロ)アジア
経済研究所 / Institute of Developing
Economies, Japan External Trade Organization
(IDE-JETRO) http://www.ide.go.jp
journal or
publication title
IDE Discussion Paper
volume
612
year
2016-08-01
INSTITUTE OF DEVELOPING ECONOMIES
IDE Discussion Papers are preliminary materials circulated
to stimulate discussions and critical comments
Keywords: pork processing industry, differentiated demand estimates, value chain,
contract farming, farmers professional cooperatives
JEL classification: Q13 L22 O13
IDE DISCUSSION PAPER No. 612
Does Market Upgrading Benefit Farmers?
Market Differentiation, Contract Farming,
and Professional Cooperatives in China's
Pork Processing Industry
Mariko WATANABE*
August 2016
Abstract This study tested whether contract farming or farmers professional
cooperatives (FPCs) improved the social benefit of pork production and income
of breeding farmers in China. The main concern of this study is whether
institutional arrangement like contract farming or FPCs actually improved the
welfare of farmers as expected. To answer this question accurately, we estimated
the differentiated market demand of pork products in order to quantify the benefit
by transaction types. Our study finds that contract farming or FPCs improved the
benefits of pork products, but farmer's income remained lower than that of
traditional transaction types. This finding is new in terms of quantifying
distribution of the economic values among sales outlets, agro-firms and farmers.
It is more reliable because it explicitly captures impacts from both demand side
and supply side by structural estimation. In practice, we need to keep it mind the
bargaining power of small farmers will not improve instantly even when the
contract farming or FPCs are introduced.
The Institute of Developing Economies (IDE) is a semigovernmental,
nonpartisan, nonprofit research institute, founded in 1958. The Institute
merged with the Japan External Trade Organization (JETRO) on July 1, 1998.
The Institute conducts basic and comprehensive studies on economic and
related affairs in all developing countries and regions, including Asia, the
Middle East, Africa, Latin America, Oceania, and Eastern Europe.
The views expressed in this publication are those of the author(s). Publication does not imply endorsement by the Institute of Developing Economies of any of the views expressed within.
INSTITUTE OF DEVELOPING ECONOMIES (IDE), JETRO 3-2-2, WAKABA,MIHAMA-KU,CHIBA-SHI
CHIBA 261-8545, JAPAN
©2016 by Institute of Developing Economies, JETRO
No part of this publication may be reproduced without the prior permission of the IDE-JETRO.
Does Market Upgrading Benefit Farmers? :
Market Differentiation, Contract Farming, and Professional
Cooperatives in
China’s Pork Processing Industry
∗Mariko Watanabe†.
August 9, 2016
Abstract
This study tested whether contract farming or farmers profeccional cooperatives (FPCs) improved the social benefit of pork production and income of breeding farmers in China. The main concern of this study is whether institutional arrangement like contract farming or FPCs actually improved the welfare of farmers as expected. To answer this question accurately, we estimated the differentiated market demand of pork products in order to quantify the benefit by transaction types. Our study finds that contract farming or FPCs improved the benefits of pork products, but farmer’s income remained lower than that of traditional tranaction types. This finding is new in terms of quantifying distribution of the economic values among sales outles, agro-firms and farmers. It is more reliable because it explicitly captures impacts from both demand side and supply side by structural estimation. In practice, we need to keep it mind the bargaining power of small farmers will not improve instantly even when the contract
∗Acknowledgment: This paper is a result of IDE project titled Study on Industrialization of Rural
Econ-omy and and Agriculture of China (project leader: Hisatoshi HOKEN). Financial support was extended by Institute of Developing Economies, Japan External Trade Organization (IDE-JETRO), but the Institute did not involve in the process of design and implementation of the research. Jimin Wang, Vice President, Rural Development and Agricultural Economics Institute, Chinese Academy of Agricultural Science contributed substantially to the whole process of this study. Wang Zuli and Zhou Hui provided a substantial contribution by implementing surveys in pork -processing firms. The authors appreciate comments from Hisatoshi Hoken, Nanae Yamada and Zhang Xinyuan.
†Gakushuin University, 1-5-1 Mejiro, Toshima, Tokyo 171-8588, Japan. Phone: +81-3-5992-3075, Fax:
farming or FPCs are introduced.
Keywords China, pork processing industry, differentiated demand estimates, value
chain, contract farming, farmers professional cooperatives
1
Introduction
This study attempts to establish whether market differentiation benefits farmers. Whether differentiation and upgrading of the market benefits farmer is a classical and important problem in the literature.This study contributes to this field by extending empirical analysis to capture the structure of demand.
In order to protect the interest of farmers and raise their income, farmers’ professional cooperatives (FPCs) have been promoted by the Chinese government. In additon, the World Bank has cooperated to develope the design of the institution (World Bank, 2006: Xu et.al 2013). Theoretically, securing the rights of farmers and integrating their transactions might strengthen farmers’ bargaining power on transactions and is expected to improve their income and production. Does this really occur in China?
Substantial volumes of fieldwork and surveys on the impact of FPCs have accumulated ( Zhang, 2001: Guo, 2005: Han, ed. 2007: Ikegami et.al 2009: Zhao and Yuan, 2014). The case studies and surveys essentially report favorable results on FPCs in which collaboration between firms and farmers generates win-win relationships. Cooperative membership raised the icome of apple farmers in China. This is confirmed by an endogenous switching regres-sion model (Ma and Awudu, 2016). A case study on the internal management mechanism of FPCs in Hebei Province implies that FPCs are induced to rationalize resource allocation in the village studies. This could imply that FPCs improve the efficiency and value of transactions (Yamada, 2016).
Contract farming is another institutional arrangement expected to enhance the bargaing power of farmers. Contract farming prevails through the initiatives of agro-industry firms. This arrangement exists to improve quality or procurement certainty for firms’ production. In addition, it presumably improves the bargaining power of farmers and improves the value of agro-products. Furthermore, it enhances the benefits of trade and improves the income of farmers and the profits of firms (Miyata, 2009: Abebe et.al, 2013). Due to lack of effective public enforcement mechanisms, contract fulfillment is substantially affected by types of private enforcement mechanism between firms and farmers. Agro-firms are cautious about opportunistic behavior of farmers in China (Guo and Jolly, 2008). This environment may substantially affect bargning power between firms and farmers in China.
mid 2000s mainly due to shortage of rural labor. Farmers preferred working in the non-agricultural sector in urban area over breeding hogs in backyards. The industry underwent a shift from backyard hog farms to intensive commercialized farm alongside with rapid growth in production volumes and specialization. At the same time, the costs for environmental protection of the industry increased drasctically (Zhao and Han 2014 : Jia 2012). Chinese Academy of Agricultural Science (CAAS) surveys, which this study use, also captures a drastic entry and exit numbers as described in Appendix A.
This study aims to quantitatively capture the distribtion of profit between firms and farmers. We first estimate consumer welfare by types of transaction, such as contract farming or FPCs, and then, we statistically tests whether the institutions improved the welfare of farmers. We find that contract farming and FPCs improved economic value of transaction, but do not raise the income of farmers. The approach we employ enables us to capture the whole distribution of the value among the participants of the value chain, that is, firms, consumers and farmers. The case studies or descriptive statistics analysis cannot depict the whole picture of the value distribution. Our approach can complement previous studies’ findings.
The rest of this paper proceeds as follows. Section 2 describes the framework and estimation procedure. Section 4 reports the results of demand function estimation and detailed descriptive statistics on the estimated values of transaction and their distribution, such as consumer surplus, benefits, price cost margin, and costs. Section 5 reports results of statistical test for whether the new transaction institution, such as contract farming or FPCs, contributes to increasing the income of farmers. Section 6 concludes.
2
Research Strategy
2.1 Estimation of Differentiated Market Structure
This study aims to identify whether upgrading of China’s pork market has progressed, whether the upgrading generates higher economic value of transaction and whether this value is distributed to farmers too. In addressing these research problems, we need to quantify the utility of the pork produced and sold, as well as price and cost. Once the data are obtained on the product’s utility, benefits or willingness to pay, the value of transaction,
and distribution of the value along value chain can be quantified.
V alue of transaction = Bproductconsumer− Pproduct+ Pproduct− Cproduct (1)
Here, Bproductconsumer−Pproductrepresents a fraction of value that distributed to the consumer,
whereas Pproduct − Cproduct belongs to the suppliers. This empirical study attempts to
quantify the value of transaction in in China’s Jilin and Henan provinces pork markets and then tests the impact of contract farming or FPCs on their value.
2.1.1 Model for demand estimation
To estimate Bproductconsumer in equation (1), we follow Berry(1994) and the Berry-Levinson-Pakes (BLP) literature of the estimation of a differentiated market. Details of the model are developed in Appendix B. Here, we provide a simple description of the basic estimation idea.
Assume a consumer has a choice to buy pork from firm A or firm B. The consumer will buy pork from firm A when his or her utility of firm A’s products is higher than the product of firm B: otherwise, he or she would not buy it, denoted as “Not buy.” The utility of pork from firm A can be described as follows:
uA = −αipA+ βXA+ error≥ uB ≥ uN otbuy
If we further assume that the probability of buying pork from firm A follows logit forms. Then,
P robBuyA = exp(−αi
pA+ βXA+ error)
exp(UA) + exp(UB) + exp(UN otbuy)
An point of assumption taken from Berry(1994) is that the probability of buying pork from firm A is equal to the market share of pork A, sA , where the denominator includes
the share of potential buyers, not only actual buyers.
Under these assumptions, market share sA can be described as follows:
sA =
Sales quantity of product A
Sales quantity of product A + Sales quantity of product B + P otential demand
= exp(−αipA+ βXA+ error)
exp(UA) + exp(UB) + exp(UN otbuy)
Here, another wise treatment of the BLP procedure is to assume UN otbuy = 0. If this
holds, exp(UN otbuy) becomes exp(0) = 1 and exploits its nature. Under this assumption,
the market share of ”Not buy” becomes
sN otbuy =
exp(0)
exp(UA) + exp(UB) + exp(UN otbuy)
= 1
exp(UA) + exp(UB) + exp(UN otbuy)
. (3)
Combining equations (2) and (3) yeilds the following relationship.
sA
sN otbuy
= exp(−αipA+ βXA+ error).
Taking the logarithm of this equation, this becomes;
ln(sA)− ln(sN otbuy) = −αipA+ βXA+ error. (4)
This is the estimation equation of the demand function in this study. The consumer surplus of pork from firm A can be derived from the right-hand side of equation (3)
CSA = −αi
pA+ βXA
αi
The consumer surplus, benefits and price from firm pork A have the following relation-ship.
CSA= BAconsumer− PA1 (5) 2.1.2 Empirical Procedure
The empirical procedure of this study is as follows. First, we define the markets so as to set the total market size. We set the boundary of a prefectural-level city as the unit of the market.2
In the second step, we assume “potential total demand”is population multiplied by 10 kg. Actual per capita consumption of pork of the whole nation in 2012 was 5 kg; however, 1For simplicity of description, we assume there is only one consumer in the market. In the real world, the consumer surplus of pork from firm A is the sum of the benefits of pork from firm A to those who actually choose it.
2The CAAS surveys have information about location of customers, according to the types of sales outlet. However, we do not fully utilize this information in this study. Extension and elaboration of this market definition will be a challenge for a future study.
European consumed 10kg per capita in the same year, and thus, we employ 10 kg as the potential consumption demand.
In the third step, we define independent variables in the estimation equation. A survey of CAAS whose data we use in this study, has information of each transaction with several types of sales outlets and procurement sources including price, quantity and characteristics of products. We use these transactions as the unit of observation. We obtain quantity (kg) and price (RMB/kg) and compute each product’s market share. Then, we compute the share of “Not buy” by potential market consumption minus the total quantity of pork sold by the surveyed firms in respective markets.
The fourth step is the estimation. We estimated the demand parameters using gen-eralized method of moment (GMM) procedures. Identification is an important topic, We provide details in the following Subsection 2.1.3.
The demand function takes a nested logit form, which is described in equation (15). As
ρ is close to 1, it implies that the market is more closed to complete homogenization. Here,
we can compute the consumer surplus and benefits of each transaction’s products.
The fifth step is to compute price elasticities and price cost margin. Once the demand function parameters are obtained, particularly, the coefficient αi on price in equation (3),
we can derive the own price elasticity of product j and the cross price elasticity between products j and k from logit demand form as the following relationship:
own price elasticity = αi∗ pricej ∗ (1 − sharej)
cross price elasticity = −αi∗ sharej∗ sharek
The (marginal) cost is computed from the equation: pjt− mcjt =−qjt.∂q∂pjtjt where ∂p∂qjtjtqpjtjt is
the estimated price elasticities.
The seventh step is to test the relationship between these market structure variables and contract farming, FPCs or other institutional setting.
2.1.3 Identification
In the demand estimation, the appropriate choice of instrument variables (IVs) is the key to obtain consistent parameter of αi. As textbooks of econometrics often describes price
between demand and supply. Here, we need to obtain demand parameters by eliminating supply or cost factors.
We employ the average price of other sales outlets of the same firm. The rationality and assumption behind this choice is that prices of the same firm at different sales outlets is correlated only with cost factors, not demand factors. As is observed easily, the pork market is very competitive, and firms can set the price as only cost plus individual market’s demand factors. We assume that a firm cannot afford to set cross-pricing across different sales outlets as competition is very intensive. As described in the following section, this assumption holds and the IV works ideally. The variables pass the endogeneity test or over identification test. The partial R square is not low.
2.2 Data
The CAAS conducted a series of pork market surveys in 2008, 2010 and 2015 to docu-ment the rapid transformation of the industry. The surveys were impledocu-mented among hog slaughtering firms in Henan and Jilin provinces. Wang and Watanabe (2008) summarized the results of the 2008 survey. This study utilizes 2008, 2010 and 2015 surveys. Between 2008 and 2015, the pork industry in China experienced a big transformation from scat-tered pig-raising to concentration of big farms. This occurred alongside a hike in wage costs caused by labor shortage that developed from the mid 2000s, which also resulted in transformation of the production system. The survey provides a good base for tracing the transformation process.
2.2.1 Survey Implementation
The firm survey was conducted in two provinces of CAAS in each province from March to June 2008, November to December 2010, and November to December 2015. In each province, more than 100 firms were interviewed. The questionnaire was prepared by the authors of this report in consultation with local statistical officers as well as livestock experts in the CAAS. A total of 208 firms in 2008, 208 firms in 2010 and 196 firms in 2015 were surveyed in Jilin and Henan provinces. The accumulated actual number of firms surveyed is 516.
The firm questionnaire included detailed questions primarily on the characteristics, fi-nance, investment plan, cash management, transactions with financial institutions,
market-ing, procurement, and transaction with contract farmers. The questionnaire was drafted by the authors, pre-tested by local enumerators, checked by the field supervisor and then revised in 2008. We finalized the questionnaire according to the results of the pilot surveys and the feedback from the enumerators.
The firm survey was conducted in Jilin and Henan provinces. These provinces were chosen because production of porks of these provinces in both ranked high in China. The interviewed firms were selected by stratified random sampling from the list of firms ob-tained from the local government statistical offices. Stratified by number of slaughtering, we interviewed small- medium, and large firms.
2.2.2 Survey Structure
The objective of the survey was to obtain information, such as price, quantity, and other related transaction issues, of hog slaughtering and processing firms. All pork marketed to consumers in China follows a very similar procedure set down by the government. Hogs are bred and produced by farmers, then become pork by slaughtering firms and are then mar-keted to the consumers. The slaughtering firms are located between farmers and consumers and are related to entire pork supply chains, thus information from this phase of the process is ideal for capturing an overview of the pork product chain. In addition, we are interested in industry transactions with financial institutions. Surveyed firms were asked to choose one concrete customers transaction partner among wholesalers, restaurants, supermarkets, and wet markets, and then from intermediary, contracted farmers, and independent farmers. After firms made their choices, they were asked to answer a number of questions related to pricing, quantity, and other transaction conditions with these partners. In addition, the surveyed firms were asked to provide answers regarding historical transaction records with financial institutions and basic information on firms’ characteristics.
2.3 Market definition
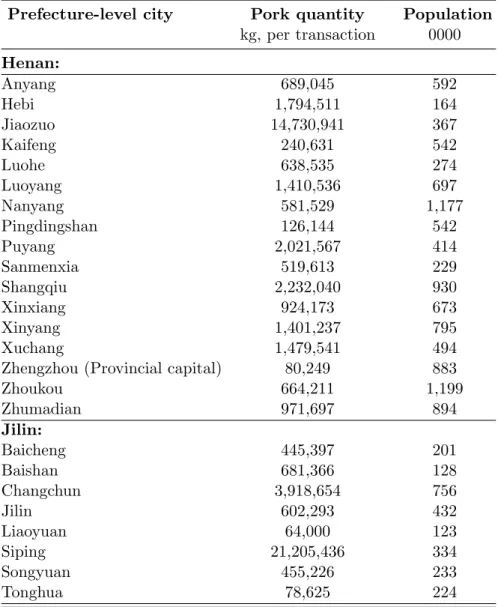
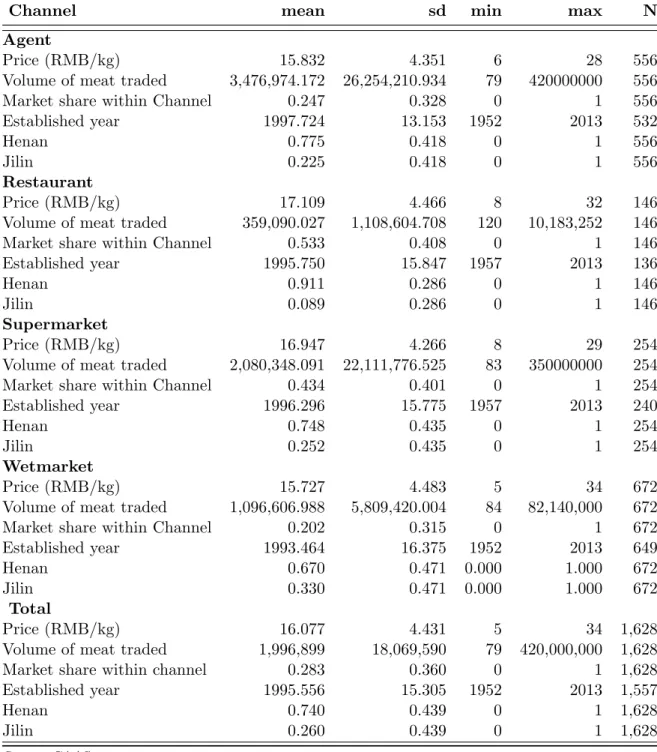
We set out the prefecture-level city as the boundary of the market in this study. Table 1 lists the names of cities and their basic sizes. Table 2 summarize profiles of the markets sorted by type of sales channel. In this study, thie sales channel is regarded as a source of differentiation of products. Among four channels, agents and wet market account for the larger propotion of sales targets than the other two channels.
Table 1: Size of Markets Defined (Mean, 2005 to 2010, 2013 to 2015)
Prefecture-level city Pork quantity Population
kg, per transaction 0000 Henan: Anyang 689,045 592 Hebi 1,794,511 164 Jiaozuo 14,730,941 367 Kaifeng 240,631 542 Luohe 638,535 274 Luoyang 1,410,536 697 Nanyang 581,529 1,177 Pingdingshan 126,144 542 Puyang 2,021,567 414 Sanmenxia 519,613 229 Shangqiu 2,232,040 930 Xinxiang 924,173 673 Xinyang 1,401,237 795 Xuchang 1,479,541 494
Zhengzhou (Provincial capital) 80,249 883
Zhoukou 664,211 1,199 Zhumadian 971,697 894 Jilin: Baicheng 445,397 201 Baishan 681,366 128 Changchun 3,918,654 756 Jilin 602,293 432 Liaoyuan 64,000 123 Siping 21,205,436 334 Songyuan 455,226 233 Tonghua 78,625 224
Table 2: Summary Statistics
Channel mean sd min max N
Agent
Price (RMB/kg) 15.832 4.351 6 28 556
Volume of meat traded 3,476,974.172 26,254,210.934 79 420000000 556
Market share within Channel 0.247 0.328 0 1 556
Established year 1997.724 13.153 1952 2013 532
Henan 0.775 0.418 0 1 556
Jilin 0.225 0.418 0 1 556
Restaurant
Price (RMB/kg) 17.109 4.466 8 32 146
Volume of meat traded 359,090.027 1,108,604.708 120 10,183,252 146
Market share within Channel 0.533 0.408 0 1 146
Established year 1995.750 15.847 1957 2013 136
Henan 0.911 0.286 0 1 146
Jilin 0.089 0.286 0 1 146
Supermarket
Price (RMB/kg) 16.947 4.266 8 29 254
Volume of meat traded 2,080,348.091 22,111,776.525 83 350000000 254
Market share within Channel 0.434 0.401 0 1 254
Established year 1996.296 15.775 1957 2013 240
Henan 0.748 0.435 0 1 254
Jilin 0.252 0.435 0 1 254
Wetmarket
Price (RMB/kg) 15.727 4.483 5 34 672
Volume of meat traded 1,096,606.988 5,809,420.004 84 82,140,000 672
Market share within Channel 0.202 0.315 0 1 672
Established year 1993.464 16.375 1952 2013 649
Henan 0.670 0.471 0.000 1.000 672
Jilin 0.330 0.471 0.000 1.000 672
Total
Price (RMB/kg) 16.077 4.431 5 34 1,628
Volume of meat traded 1,996,899 18,069,590 79 420,000,000 1,628
Market share within channel 0.283 0.360 0 1 1,628
Established year 1995.556 15.305 1952 2013 1,557
Henan 0.740 0.439 0 1 1,628
Jilin 0.260 0.439 0 1 1,628
Figure 1: Transaction Structure of Surveyed Firms: 2010
Source: CAAS survey
Note: “Hotel” includes sales to “Hotel and Restaurants.”
3
Estimation Results
3.1 Demand estimates
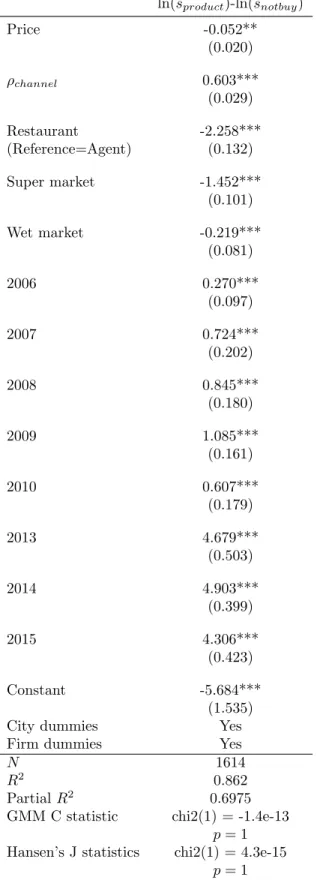
Estimated demand parameters are presented in Table 3. In these estimates, we regard different sales outlets (indirect sales via agent, and direct sales to restaurant, supermarket and wet market.). Identification by IV is successful, as the GMM c statistics does not reject the exogeniety assumption of IVs. Hansen’s J statistics does not reject the result as an appropriate identification, and nor are any of the IVs is exogenous. The partial R square reached 0.6975, which is a satisfactory level.
As consistency of the parameters was not violated, we can interpret the parameters as a description of a real market structure. Here, we have three main findings: (1) differentiation of pork products of firms in Henan and Jilin are progressed. Size of consumer surplus of the buyer (i.e., benefit minus price) is in the following ascending order; direct sales to restaurant, supermarket, wet market and indirect sales via agent. (2) A certain level of
homogeneity within the each differentiated cluster is observed. This is implied by nesting parameters ρ, which is 0.603. This is not low but it is not extremely high. (3) Coefficients of year dummies increased progressively. This implies that the consumer surplus of pork among the surveyed firms improved over time. Upgrading of pork processing industries is also observed from other information. We discuss this in the next subsection.
4
Findings on market structure
4.1 Market Upgrading
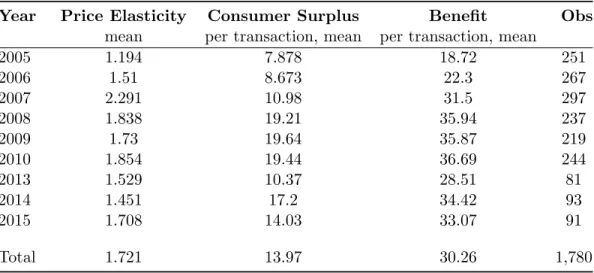
As mentioned already, market upgrading is defined in this study as increased value of transacation, that is consumer welfare plus firms’ profit. Estimated demand parameters show the structural parameters of consumer surplus. Positive and increasing coefficients of year dummies indicate total improvement of consumer surplus took place during the estimation period3. In addition to positive and increasing coefficients of year dummies in the demand function, development of price elasticity of demand indicate technical progress and increasing evaluation by the consumer of the industry’s products. Own price elasticity of demand indicates consumers will buy more if the price decreased as revenue of sellers will increase. This occurs when the price elasticity of demand is higher than 1: the larger the elasticity is, the more sensitive to price is the demand for products. As summarized in Table 4, the elasticity increased as time passes. It was only 1.1 initially, increased to 2.2 and stay around 1.5 or higher thereafter. During this period, price hike due to supply-side effect, such as pig cycles, is observed. However, price elasticity indicates a consumer preference against price increased. A consistent increase implies that an increase of consumers’ evaluation of products supplied by the industry took place. These results indicate a steady market upgrading took place in the pork processing industry between 2005 and 2015.
In addition to the year dummies parameter, price elasticity, the estimated size of con-sumer surpluses, and benefits increased. These provide evidences of an upgrading of the industry.
3
This interpretation is an analogy of total factor productivity. Technical progress, which is a factor other than an increase of input factors, is captured as residuals or year dummies. Market upgrading, an increase of total consumer surplus attributable to a factor other than price and characteristics of the products can be interpreted as captured by the year dummies.
Table 3: Estimates of Demand Function: Jilin and Henan in 2005 to 2010, 2013 to 2015 ln(sproduct)-ln(snotbuy) Price -0.052** (0.020) ρchannel 0.603*** (0.029) Restaurant -2.258*** (Reference=Agent) (0.132) Super market -1.452*** (0.101) Wet market -0.219*** (0.081) 2006 0.270*** (0.097) 2007 0.724*** (0.202) 2008 0.845*** (0.180) 2009 1.085*** (0.161) 2010 0.607*** (0.179) 2013 4.679*** (0.503) 2014 4.903*** (0.399) 2015 4.306*** (0.423) Constant -5.684*** (1.535) City dummies Yes Firm dummies Yes
N 1614
R2 0.862
Partial R2 0.6975 GMM C statistic chi2(1) = -1.4e-13
Table 4: Market Upgrading
Year Price Elasticity Consumer Surplus Benefit Obs
mean per transaction, mean per transaction, mean
2005 1.194 7.878 18.72 251 2006 1.51 8.673 22.3 267 2007 2.291 10.98 31.5 297 2008 1.838 19.21 35.94 237 2009 1.73 19.64 35.87 219 2010 1.854 19.44 36.69 244 2013 1.529 10.37 28.51 81 2014 1.451 17.2 34.42 93 2015 1.708 14.03 33.07 91 Total 1.721 13.97 30.26 1,780
Source: Estimates by authors from CAAS survey
4.2 Value of Transaction by Sales Outlets, and Procurement Sources
Table 5 presents the estimated value of transaction, which was described in equation (1), estimated benefit (B), cost (C), price cost margin (PCM), consumer surplus (CS ) and sur-veyed price (P). Notable findings here are as follows. (1) Jilin’s median values of transaction value and benefit are higher in all types of sale outlets than their counterparts of Henan, although the actual average price is almost the same. (2) Restaurants and supermarkets generate higher values and benefits. The price cost margin and firm profit are not lower than those of other sales outlets. However, the cost of hog, that is the income of farmers, is observed as no higher than the income of other sales outlets. (3) On the procurement side: procurement from contractors generates higher value, and benefits in Jilin. Organizing own procurement team generates higher cost of hogs, that is income of farmers. (4) Transactions with FPCs definitely contributed to raising the value of transaction, benefits and profit of firms. The cost of hogs, that is, the income of farmers, is observed to be lower than that of non-cooperatives.
4.3 Geographical Distribution
Geographical distribution might have involved a systematic difference in utilizing contract farming or cooperatives. Therefore, we sort price, PCM and cost computed by source of procurements and by provinces in Table 5.
Indirect procurement via agent has a substantial share of overall procurement in both Jilin and Henan provinces. The price cost margins from these types of procurement are around 8.5 RMB for both provinces. There are no big outliers when sorting by cities. On the other hand, procurement from contract farmers generates higher price cost margins than the other procurement sources. Comparing Jilin and Henan, Jilin generates higher PCM from procurement from contract farmers.
Table 5 also shows the median price cost margin between firms who trade with FPCs and those who do not, and by provinces According to this table, average price cost margins for firms that utilize FPCs are higher than those who do not for both Jilin and Henan.
Table 6 shows the median price cost margin between firms who procure hogs from contractor by city. Here, we can observe that a large difference among cities in terms of price cost margin, that relies on transaction with contractors.
5
Test: Differentiated Market and Contract Farming/Cooperatives
This study is interested in whether market upgrading and institutional setting affect theprofits of farmers. The observation of distribution of value in Section 4 implies that contract farming and cooperatives contribute positively to increase the value of transaction, but the cost of hog, that is, the income of farmers are maintained at the same level as other types of procurement source.
Tables 7 and 8 shows the results of the t-test on whether the mean of each groups is significantly different from each others. Firms that procured hogs from contractors and own farm generate higher benefits and consumer surplus than transaction with agent, own team and independent firms. Their transaction prices with customers are higher than independent farmers, but are no higher than that of their counterparts, own farm, own team and agent. It is noteworthy that the cost of hog, or the purchase price from contractor farmers is lower than when the farmer sells to the agent or the procurement team organized by firms. Although the contractor farmers appear to have improved economic value from
trade, farmers do not actually enjoy increased income.
Table 8 shows a similar t test on the difference in the mean between firm that trades with FPCs and those that do not trade with. The results again show a less ideal results: the estimated cost and price cost margins of hog, the income of farmers who trade via FPCs, is no higher than for those who do not trade via FPCs, although FPC contributed to improving the benefit, consumer price and price.
6
Conclusion
This study quantified the value of transaction of hog and its distribution among their sales outlets and procurement partners. The main findings of this study are as follows. (1) The pork-processing industry in Henan and Jilin provinces are successful in upgrading the industry between 2005 and 2010 in terms of the size of welfares provided to society. (2) Firms that utilized contract farming or FPCs succeeded in upgrading benefits and consumer surpluses, and their own price cost margins. (3) However, farmers, who produced hogs for processing did not benefit from the upgrading of the industry as a whole.
Demand estimation enable us to quantify the distribution of value among firms, farmers and customers explicitly. This is the main contribution of this study.
We confirmed that contract farming and FPCs contributed to upgrading the economic value of the industry. In this positive sum environment, it would be feasible to increase profit distribution to farmers. However, the observations here show the opposite results. Further study is required to investigate the factors that hinder, such a win-win distribution relationship between farmers and firms.
A limitation of the current study is as follows. In order to confirm the validity of our findings, we need to test the robustness of the estimated cost and price cost margins based on different information. The CAAS survey contains information on actual prices between farmers and firms, and the attributes of transactions, such as type of meat processing, safety investigation points, species or size, and feeding days of hogs. Comparing the estimated procurement prices of hogs with the actual prices would confirm the distribution of the value between firms and farmers. The attributes of traded hogs between farmers and customers would yield richer information about which factors affect the distribution of value between firms, sales outlets and farmers.
Table 5: Distribution of Value per Transaction: RMB, median
Sales outlets Value Benefit CS Price PCM Cost Obs Henan Agent 17 23 7.9 16 8.2 6.1 432 Restaurant 20 25 7.9 17 12 3.7 135 Supermarket 19 26 8.2 17 9.8 4.8 189 Wet market 17 24 8.3 16 7.8 6.9 448 Total 18 24 8.2 16 8.2 6.1 1,204 Jilin Agent 22 30 12 16 8 6 125 Restaurant 62 63 42 16 9 5 13 Super market 28 36 19 16 9 6 64 Wet market 21 28 12 16 8 6 222 Total 22 30 13 16 8 6 424
Procurement source Value Benefit CS Price PCM Cost Obs Henan Agent 18 25 9 16 9 6 565 Contractor 16 21 4 15 9 5 147 Independentfarme 18 20 5 15 10 5 80 Ownfarm 23 29 10 19 12 4 33 Ownteam 18 26 9 16 8 6 364 Total 19 25 9 16 9 6 1,189 Jilin Agent 21 29 12 16 8 7 292 Contractor 94 103 86 16 9 6 36 Independentfarme 14 22 6 12 8 3 49 Ownfarm 21 40 29 13 8 3 11 Ownteam 63 104 86 16 8 8 36 Total 22 30 13 16 8 6 424
Cooperative Value Benefit CS Price PCM Cost Obs Henan No trade with FPC 18 26 8 16 8 7 503 Trade with FPC 25 28 9 18 16 4 108 Total 19 26 9 16 8 7 611 Jilin No trade with FPC 50 57 42 16 8 8 98 Trade with FPC 95 103 86 16 9 8 13 Total 50 58 42 16 8 8 111
Source: Estimates by authors from CAAS pork processing industry survey Note (1) Value =benefit - cost. Consumer Surplus (CS) = benefit - price.
Price Cost Margin (PCM)= price -cost.
Note(2) Cost here is estimated based on the assumption that pork processing firms have sufficient bargaining power with their procurement source to maximize their revenue from the transaction. If the bargaining power of farmer, procurement sources were large, actual cost would
Table 6: Price Cost Margin (PCM) of Firms that Procures Hogs from
Contrac-tor Most : Median by Cities
City Price Estimated PCM Estimated Cost
Hebi 19.3 19.6 0.4 Kaifeng 15.0 8.0 6.6 Luohe 14.8 21.2 -6.0 Luoyang 16.5 12.0 5.2 Nanyang 12.0 8.2 2.2 Pingdingshan 16.0 10.5 6.4 Puyang 11.0 12.5 -1.5 Shangqiu 16.1 7.7 8.4 Xuchang 13.0 9.3 2.7 Zhengzhou 18.0 7.8 10.0 Zhoukou 19.0 7.7 11.3 Provincial Total 15.0 8.8 5.4 Baishan 20.0 8.2 11.8 Changchun 13.9 14.1 -1.1 Liaoyuan 14.0 12.8 0.7 Siping 16.0 8.5 6.4 Songyuan 22.0 19.7 2.3 Provincial Total 15.9 9.4 5.7
Table 7: T test on Mean Differences of CS, Benefit and Price among Procure-ment Channels
Benefit Agent Contractor Independent F Own farm Own team
Agent 0
Contractor -6.419*** 0
Independent farmer 5.296*** 11.715*** 0
Ownfarm -13.387*** -6.968* -18.683*** 0
Ownteam -2.718** 3.701 -8.014*** 10.669*** 0
CS Agent Contractor Independent F Own farm Own team
Agent 0
Contractor -7.135*** 0
Independent farmer 3.676*** 10.811*** 0
Ownfarm -12.369*** -5.234 -16.045*** 0
Ownteam -2.262** 4.872** -5.938*** 10.107*** 0
Price Agent Contractor Independent F Own farm Own team
Agent 0
Contractor 0.716** 0
Independent faremer 1.620*** 0.905** 0
Ownfarm -1.017 -1.733** -2.638*** 0
Ownteam -0.455 -1.171*** -2.076*** 0.562 0
PCM Agent Contractor Independent F Own farm Own team
Agent 0
Contractor -1.313** 0
Independent farmer -0.590 0.723 0
Ownfarm 3.522 4.835 4.111 0
Ownteam -0.505 0.808 0.085 -4.027 0
Cost Agent Contractor Independent F Own farm Own team
Agent 0
Contractor 2.029*** 0
Independent farmer 2.210*** 0.181 0
Ownfarm -4.539 -6.568 -6.749 0
Ownteam 0.049 -1.979** -2.160** 4.589 0
Standard errors are not displayed, Tested differences are defined as column-line * p < 0.1, ** p < 0.05, *** p < 0.01
Table 8: T test on Mean Differences of CS, Benefit, Price and Cost between Cooperative/Non-cooperative Non-nooperative Benefit Cooperative -6.323** CS Cooperative -5.342** Price Cooperative -0.981*** PCM Cooperative -2.591 Cost Cooperative 1.610
Standard errors are not displayed. Tested differences are defined as column-line * p < 0.1, ** p < 0.05, *** p < 0.01
References
Abebe, Gumataw K., Jos Bijman, Ron Kemp, Onno Omta, and Admasu Tsegaye (2013). ”Con-tract Farming Configuration: Smallholders’Preferences for Contract Design Attributes.” Food Policy 40 : 14-24.
Ackerberg, Daniel A. and Gregory S. Crawford (2009), “Estimating Price Elasticities in Differ-entiated Product Demand Models with Endogenous Characteristics,” mimeo, 2009.
Berry, Steven (1994) “Estimating Discrete-Choice Models of Product Differentiation” Rand
Jour-nal of Economics, 25 (2) 242-262
Berry, Steven, James Levinson and Ariel Pakes (1995) “Automobile Prices in Market Equilib-rium” Econometrica, 63 (4): 841-890.
Grigolon, Laura and Franc Verboven (2011) “ Nested Logit or Random Coefficient logit? A Com-parison of Alternative Discrete Choice Models of Product Differentiation” Center for Economic Studies, Discussion Paper Series 11-24.
Guo Hongdong (2005) Contract Arrangement and Enforcement between Agribusiness Leading
Firms and Smallholders, China Agricultural Publishers. Beijing.
Guo, Hongdong, and Robert W. Jolly (2008) ”Contractual Arrangements and Enforcement in Transition Agriculture: Theory and Evidence from China.” Food Policy 33, no. 6 : 570-75.
Han Jun, ed., (2007) Survey on Farmer’s Coooperatives in China, Shanghai Far East Publisher. Shanghai.
Hausman, Jerry (1996)“Valuation of New Goods under Perfect and Imperfect Competition,” in The Economics of New Goods, ed. by T. Bresnahan, and R. Gordon. University of Chicago Press. Chicago.
Ikegami Akihide and Hisatoshi Hoen ed., (2009), Rural Reform in China and Industrialization of
Agriculture, Institute of Developing Economies, Modern China Analysis Series 3. Chiba.
Ivaldi, Marc and Frank Verboven (2005), “Quantifying the Effects from Horizontal Mergers in European Competition Policy” International Journal of Industrial Organization 23 :
Jia, Xiangping, Huang, Jikun Xu, Zhigang (2012) “Marketing of farmer professional coopera-tives in the wave of transformed agrofood market in China.” China Economic Review 23(3): 665-674.
Ma, Wanglin and Awudu Abdula (2016)“Does cooperative membership improve household wel-fare? Evidence from apple farmers in China” Food Policy 58: 94-102.
Miyata, Sachiko, Nicholas Minot, and Dinghuan Hu (2009). ”Impact of Contract Farming on In-come: Linking Small Farmers, Packers, and Supermarkets in China.” World Development 37, no. 11: 1781-90.
Nevo, A. (2001)“Measuring Market Power in the Ready-To-Eat Cereal Industry,”Econometrica,
69(2), 307–342.‘
Vervobern, Frank (1996) “International Price Discrimination in the European Car Market’, AND Journal of Economics, 27.
Wang Jimin and Mariko Watanabe (2008), Pork Production in China -A Survey and Analysis of the Industry at a Lewis Turning Point - ASEDP No.77, Institute of Developing Economies, Japan. (http : //www.ide.go.jp/English/P ublish/Download/Asedp/077.html)
World Bank, EASRD (2006) China- Farmers Professional Associations Review and Policy
Rec-ommendations. August 2006. Washington DC.
Xu, Xuchu, Shao Ke, Liang Qiao, Guo Hongdong, Lu Jia, Huang, Zuhui (2013) “Entry of Chi-nese Small Farmers into Big Markets: From Enterprise-Led Structures to Farmer Coop-eratives.” Chinese Economy 46(1): 7-19.
Yamada, Nanae (2016) “Dilemmas between Efficiency and Equity in Large-scale Farming: Ev-idence from Land Shareholding Cooperatives in Hebei Province, People ’s Republic of China,” IDE-Discussion Paper.
Zhao, Liange and Han Hongyun (2014). “Structural Changes of Hog Farming in China: Good or Bad? A Case Study of Wuxue City in Hubei Province.” Agricultural Economics Review 15, no. 1 (2014): 25-42.
Zhao, Liange. and Yuan Peng (2014). “Rural Cooperatives in China: Diversity and Dynamics.”
Chinese Economy 47(4): 32-62.
Zhang Xiaoshan ed., (2001), Connecting Farmers and Markets: A Study on Intermediary
A
Profiles of CAAS Survey Results
Discussion: Henan versus Jilin/ 2008 versus 2010 and 2015 Here we focus on the quality control of products of pork processing firms in Henan and Jilin. We find a clear difference between Henan and Jilin in 2008 to 2010. Between 2008 and 2010, there was a serious pork shortage due to wage increases and epidemic problems. In this time, Henan increased reliance on agent-brokers for marketing, and firms conducted quality and safety inspections by themselves. Firms bore the cost of quality control, while marketing and procurement functions were outsourced. This might have been motivated in order to improve the quality of products and maintains costs low as much as possible. In 2015, there was a big structural change, and a decrease of firm numbers became apparent in the data. This is reported partly because of market saturation, and partly because of strict enforcement regarding environmental and food safety regulations.
The dataset has information about each transaction with price, quantity and quality information. By estimating a differentiated product demand model, we can observe what kind of strategy the surveyed firms took so as to tackle the increasing demand for safe and high quality meat at low prices. This statistical analysis is the next step of this research.
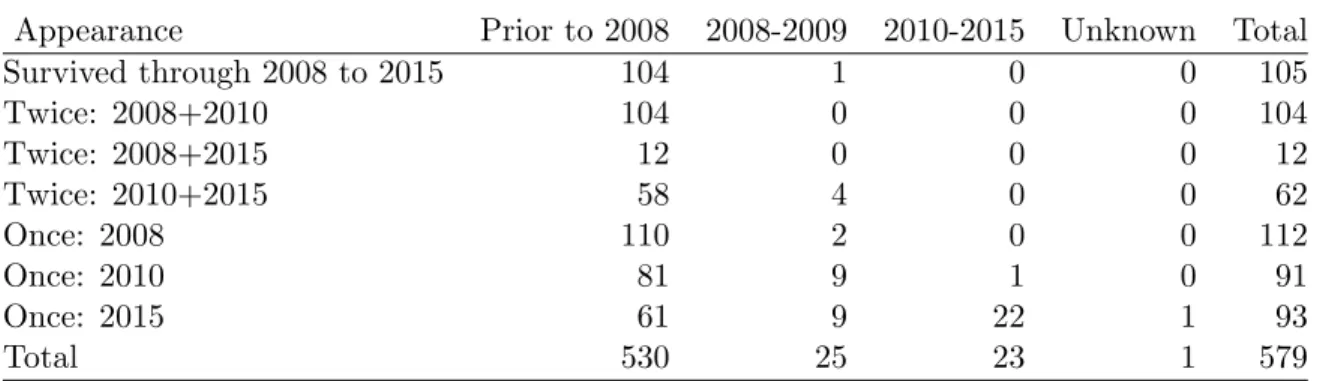
Entry and Exit between 2008, 2010 and 2015 The CAAS conducted repeatedly a similar survey in 2008, 2010 and 2015, The surveys enabled us to observe the entry and exit situation in the industry, In 2015, there was a massive exit of small processing firms from the industry because the government tightened market entry regulations so as to improve safety and environmental protection level. However, the data indicate that relatively old firms were still active: 18 per cent all firms appeared in all three surveys, as shown in Table A.1, On the other hand, there was vigorous entry of firm that entered the market between 2008 and 2009, which was a boom period after pork price hikes.The probability of exits of firms that entered in this period (7 per cent) was definitely higher than the probability of firms that entered prior to 2008 (1 per cent) as shown in Table A.3. Between 2010 and 2015, a relatively significant number of firms entered the market. It is necessary to confirm whether this vigorous entry and exit of firms improved the benefits and welfare that the industry offers to society, which is tested in the future study.
Table A.1: Appearances of firms: 2008, 2010, and 2015 surveys
Appearance Number Per cent
Three times: 2008, 2010 and 2015 105 18
Twice: 2008+2010 104 18 Twice: 2008+2015 12 2 Twice: 2010+2015 62 11 Once: 2008 112 19 Once: 2010 91 16 Once: 2015 93 16 Total 579 100
Source: CAAS prok processing industry survey
Table A.2: Appearance of the Survey and Established Period
Appearance Prior to 2008 2008-2009 2010-2015 Unknown Total
Survived through 2008 to 2015 104 1 0 0 105 Twice: 2008+2010 104 0 0 0 104 Twice: 2008+2015 12 0 0 0 12 Twice: 2010+2015 58 4 0 0 62 Once: 2008 110 2 0 0 112 Once: 2010 81 9 1 0 91 Once: 2015 61 9 22 1 93 Total 530 25 23 1 579
Source: CAAS pork processing industry survey
Table A.3: Entry Period of Surviving and Exit Firms in 2015
Year of entry Survived in 2015 Exit in 2015 (Prob of exit) Total
Prior to 2008 530 7 (1.3 %) 537
2008-2009 25 2 (7.4 %) 27
2010-2015 23 0 23
Unknown 1 22 23
Total 579 31 610
B
Demand Estimation
B.1 Estimation Model of Demand
Here, we develop a model for demand estimation. Consumer demand is modeled using a discrete-choice formulation. This model describes a process by which a consumer chooses a product according to the size of his or her utility. On the supply side, we assume competition between several brands in different geographical markets at different timings.
B.1.1 Utility and Demand
First, we describe the utility of consumer i which consists of the benefit product j. Con-sumers chose a brand j in a given market (=city and year, here) to maximize their utility. We view a product as a particular brand sold in a city market m = 1, 2, ...M .(we delete m hereafter simply for convenience). The indirect utility Uijt of consumer i from purchasing
brand j = 1, 2, ...J at time t = 1, 2, ....T is,
uijt=−αipjt+ βXjt+ ξjt+ ϵijt. (6)
pjt denotes the price of brand j in market m in time t. Other factors affect product
choice, such as the features of product xjt. ξjtis a product-market specific unobservable. ϵijt
is the random unobservable error. To predict consumer surplus as appropriately as possible, we need to capture difference of elasticity of price for the same product by attributes of consumers. We need some random coefficient of the price. The random coefficients of price in this paper are defined as αi = α/Yi , whereas Yit is the observed income4.
The mean utility of product5 j can be rewritten as,
δjt =−αipjt+ βXjt+ ξjt, (7)
where ξjt represents unobservable and time specific characteristics. Each consumer i in
market m will chooses product j to maximize his or her utility. Therefore, the aggregate market share for product j in market m is the probability that product j yields the highest 4We used average income of each city-year segments in this study because we do not have data of individual income. That means Yi = Ymt =
∑
Yi/Imt and αi = αmt = α/Ymt. Imt is the population at
market m and time t in this study. We do not presented it as demand estimates because we could not obtain a consistent parameters. Instead, we used non-random coefficient parameters in this study.
5
Because this is the mean of utility, unobserved independent error ξjtin equation (6) can be regarded as
utility across all products including outside goods 0. Therefore, the predicted market share of product j = 1, ....J , sj is a function of mean utility δjt and parameter vector θ =
(α, β, ρ6 ). If the unobserved error, ϵijt in the equation (6) follows independently and
identically distributed (i.i.d.) extreme value, this relationship can be rewritten as a logit choice probability as follows.
Pjt = sjt(δjt, θ) = e ujt ∑ keukt = e −αipjt+βXjt+ξjt+ϵijt. 1 +∑ke−αipkt+βXkt+ξkt+ϵikt (8)
Here, 1 in the denominator in equation (8) represents the value of outside option, be-cause exp(u0) = exp(0) = 1. The remaining variables in the denominator are the sum of
exponential utilities of all of the choices in every market.
Under this logit assumption, consumer surplus CSifor consumer i, previously indicated
by B− P , takes the following closed format.
E(CSi) =
1
αi
E[M ax(ujt)] (9)
The expectation is over all possible values of error ϵijt. Here, expected consumer surplus
for individual i or product j can be written as follows.
E(CSi) = 1 αi ln( J ∑ j=1 euijt) + C.7 (10) E(CSj) = I ∑ i=1 1 αi ln(euijt) + C (11)
The absolute value of the consumer surplus is meaningless because of the unknown C. However, the difference between several states of consumer surplus as a figure generated from the structure. This study focuses on the difference between two different agents, for example, agent h or ownership type h compared to agent k or ownership type k, the difference of the sum of consumer surplus of products supplied by firm k and firm h. This
can be written as follows: ∆CShk = [ J|h ∑ j=1 1 αi ln(euijt)− J|h ∑ j=1 1 αi ln(euijt)] (12)
Once CSj for product j is obtained from the above-mentioned estimates, we can compute
the value of benefits of product j, Bjt.
Benef itj = CSj + P ricej (13)
Here, we can observe the relative size of the benefits of the product in the same way as we do for the consumer surplus.
B.1.2 Nested Logit Model and Identification
The logit-based utility model provides an estimating equation of utility in the following form. Based on the model, we estimate the demand parameters following Berry (1994) and Nevo (2000) and other BLP literature.
Our estimation equation is,
ln(sjt)− ln(sot) =−αipjt+ βXjt+ ρln(sjt|g) + ξjt. (14)
Here, we set the outside option as the difference between population and total number of air conditioners for an individual market in a year, which represents number of potential buyer of the products. sjt|g is the share of product j withing group g.
The parameters of this demand can be identified as the previous empirical industrial organization literatures has claimed (see Ackerberg and Crawford (2009)). Identification of price parameters, which is critical for our benefit computing, relies on the fact that the unobserved determinants of demand are uncorrelated with input prices. To account for this potential endogeneity of prices, which may be caused by the presence of changes in unobserved attributes, we use the GMM estimator with either type of IVs discussed in Appendix B.2.
To account for the degree of preference correlation between products of the same group, We imposed a further assumption on the error term, ϵijt of equation (6).
ρ is a “nesting parameter” , 0≤ ρ ≤ 1 which captures the correlation between preference
and product characteristics. ϵijt¯ is independently distributed error for consumer, products and timing.
When demand function parameters are estimated based on the nested logit model, consumer surplus will be computed as follows (see Ivaldi and Verboven, 2005:677 ?).
E(CSi) = 1 αi ln(1 + J ∑ j=1 D1g−ρ) + C. (16) Dg = Gg ∑ k=1 exp(δjt/(1− ρ)) (17) B.2 Instruments
The estimation of the models employed here is typically performed using IV or GMM using instruments for pjt and nested variables. Instruments zjt are correlated to pjt but
are independent of ¯ϵijt or ϵijt . In this case, candidates of instruments here mainly come
from the following four sources: (1) cost shifters. (2) prices of the same products of the same brand in other cities.( here, we assume that price differences for the same products across cities reflects only demand factors, and the prices of the same products in other cities are correlated with price via cost factors only, as per. Berry, Levinson and Pakes, 1995; Hausman, 1996; Nevo, 2001). (3) price of the same type of products by competitor brands in the same city (Berry, Levinson and Pakes, 1995), and (4) characteristics of products ( it is natural to assume that characteristics of products are designed and planned in advance, before the price is fixed.) Exploiting this natural assumption, we use the characteristics of products as instruments that predetermin the price. Any of four types of instruments were tried. (i) the first type of “quality” dummies are sum of index of characteristics within the own brand. (ii) The second type of this category’s IV is sum of the characteristics of other products of rival firms, and (iii) the third one is sum of the characteristics of other products of own firms (see Grigolon and Verboven, 2011; Verboven,1996). (iv) The fourth type is the average index of the characteristics of a competitor.
The Hausman instrument approach (2) relies on the assumption that prices in two differ-ent markets be correlated via common cost shocks and not via common demand side shocks such as nationwide demand shock. If a situation occurs such as the market demand of two
particular market’s shrink owing to a common shock between the two particular markets, the instruments are invalid. However, in our estimation case, this IV works effectively.