Page 1 of 28
Experimental evaluation of response functions of a CdTe
detector in the diagnostic region with the aim of carrying
out a basic experiment concerning a next generation photon
counting system
Poster No.: C-0006
Congress: ECR 2016
Type: Scientific Exhibit
Authors: H. Hayashi1
, H. Okino1, K. Takegami1, N. Kimoto1, I. Maehata1, Y. Kanazawa1, T. Yamakawa2, S. Yamamoto3; 1Tokushima/JP,
2
Osaka/JP, 3Kanagawa/JP
Keywords: Quality assurance, Dosimetric comparison, Radiation effects, Physics, Experimental, Radioprotection / Radiation dose, Radiation physics
DOI: 10.1594/ecr2016/C-0006
Any information contained in this pdf file is automatically generated from digital material submitted to EPOS by third parties in the form of scientific presentations. References to any names, marks, products, or services of third parties or hypertext links to third-party sites or information are provided solely as a convenience to you and do not in any way constitute or imply ECR's endorsement, sponsorship or recommendation of the third party, information, product or service. ECR is not responsible for the content of these pages and does not make any representations regarding the content or accuracy of material in this file.
As per copyright regulations, any unauthorised use of the material or parts thereof as well as commercial reproduction or multiple distribution by any traditional or electronically based reproduction/publication method ist strictly prohibited.
You agree to defend, indemnify, and hold ECR harmless from and against any and all claims, damages, costs, and expenses, including attorneys' fees, arising from or related to your use of these pages.
Please note: Links to movies, ppt slideshows and any other multimedia files are not available in the pdf version of presentations.
Page 3 of 28
Aims and objectives
X-ray examinations in the medical field are now widely available, and they are carried out routinely in clinics and hospitals throughout the world. If an innovative technique is developed to improve examinations using standard diagnostic X-ray equipment, it will have a meaningful contribution to improve our quality of life.
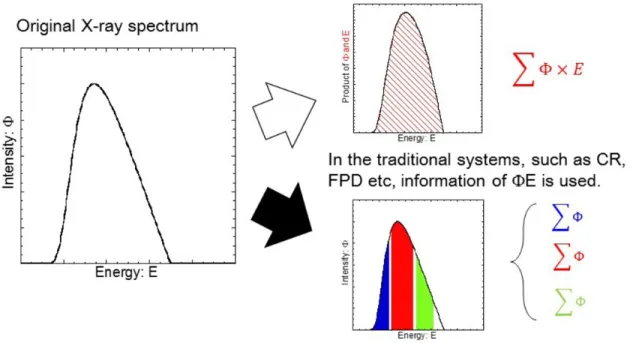
The traditional X-ray detection systems, such as X-ray film, computed radiography (CR) system using a phosphor plate, and digital radiography systems based on the flat panel detector (FPD), just use information derived from the X-ray spectrum; namely, the value of product of fluence and energy as shown in upper right graph of Fig. 1. In contrast, a photon counting technique can measure fluence based on the different energy bins as shown in lower right graph of Fig. 1, and it has possibilities to derive precise information by analysis of the X-ray spectra. A photon counting technique can derive the energies of the X-rays, meaning that the technique can provide information about material identification. We believe that this technique may be a breakthrough to improve X-ray radiography for medical diagnosis.
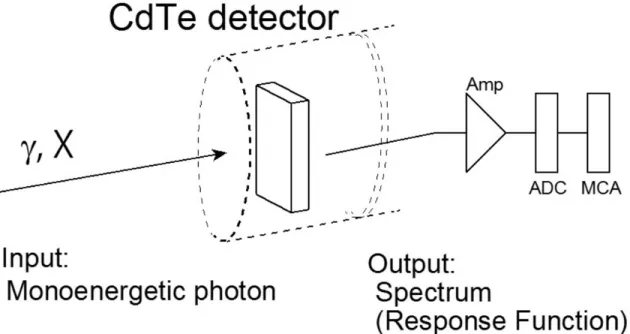
Currently in the world photon counting detectors and their techniques have been progressing [1]. A CdTe detector [2] is widely used to measure the X-ray spectrum as shown in Fig. 2, and is considered to be a feasible detector to construct a photon counting system. This detector has a high detection efficiency which is read by high density and high atomic number substances of cadmium (Cd:48) and tellurium (Te:52). However, there is a problem of insufficient energy absorptions caused by characteristic X-ray escape and/or Compton scattering X-rays. Figure 3 indicates the concept of a response function; the response function is defined by an obtained spectrum when monoenergetic photons are introduced to the detector. The effect of insufficient energy absorption is presented in the spectrum (response function). It's important to evaluate the response function precisely.
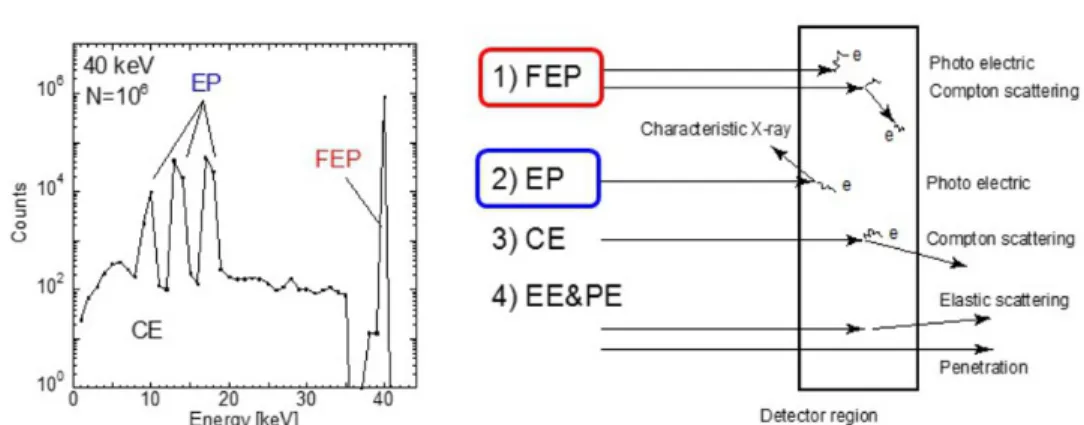
The origin of response functions can be understood by considering the interactions between X-rays and the CdTe detector. As shown in Fig. 4, there are four outcomes in the spectrum; 1)FE: full energy peak, 2)EP: escape peaks, 3)CE: Compton escape, and 4)EE&PE: escape caused by elastic scattering and penetration. The aim of this study is to evaluate the response function of the CdTe detector from the experiment and
simulation. We especially focused our attention on FE and EP, because they are large contributions in the response function. In order to develop an evaluation system using the standard medical X-ray equipment, we newly propose an experimental procedure to measure response functions experimentally.
Images for this section:
Fig. 1: Relationship between X-ray spectra and detectors used in the creation of medical
images.
Page 5 of 28 Fig. 2: CdTe detector to measure X-ray spectrum.
Fig. 3: Concept of the response function.
Page 7 of 28 Fig. 4: Relationship between the response function (left) and interactions between
X-rays and CdTe detector (right).
Methods and materials
Figure 5 shows lists of materials used in the present study. In the experiment, we used
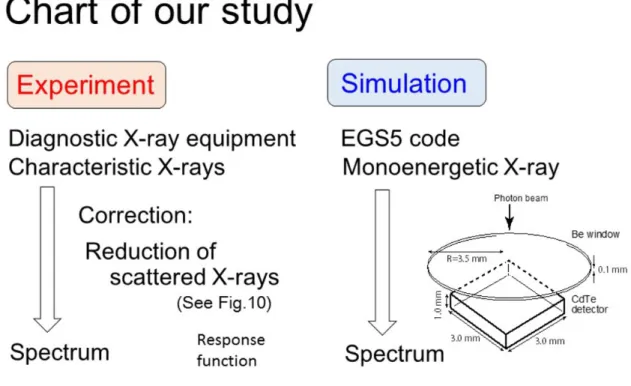
commercially available X-ray equipment (MRAD-A 50S; Toshiba Medical Systems Co., Nasu, Japan) and a CdTe detector (EMF123; EMF Japan Co., Ltd., Osaka, Japan), combined with an originally constructed experimental apparatus [3]. In the simulation, EGS5 code (electron gamma shower ver.5, KEK, Tsukuba, Japan) [4,5] installed in a personal computer was used. Figure 6 shows the chart of our study. We evaluated the response function of the CdTe detector from both the experiment and simulation.
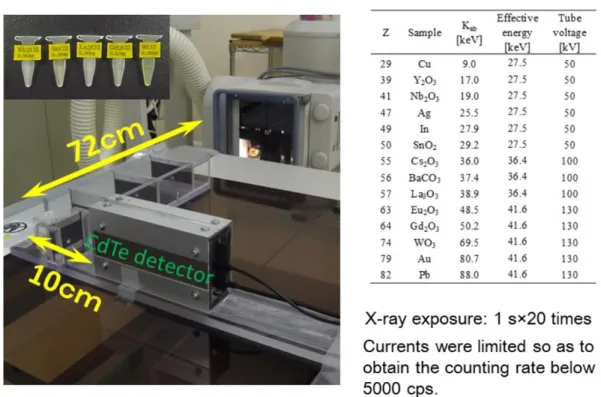
In the experiment, we irradiated powdered metallic samples with chemical forms of elemental substances, oxide, and carbon oxide. The irradiated metallic samples emit "characteristic X-rays". The atomic number of metals ranged from 29 to 82 and corresponds to the characteristic X-rays of 8.1 keV to 75.5 keV. The proper tube voltages of the X-ray equipment were set in order to produce the photo electric effect efficiently. A photograph of the experimental setup is shown in Fig. 7. The X-ray equipment is seen in the back. The apparatus made from acrylic has collimators, a sample irradiation port and a guide to set the detector; samples were inserted in a small tube, irradiated with collimated X-ray beams. The CdTe detector was set perpendicular to the beam axis. Precise description of the apparatus was previously reported by Fukuda et al. [3]. Figure
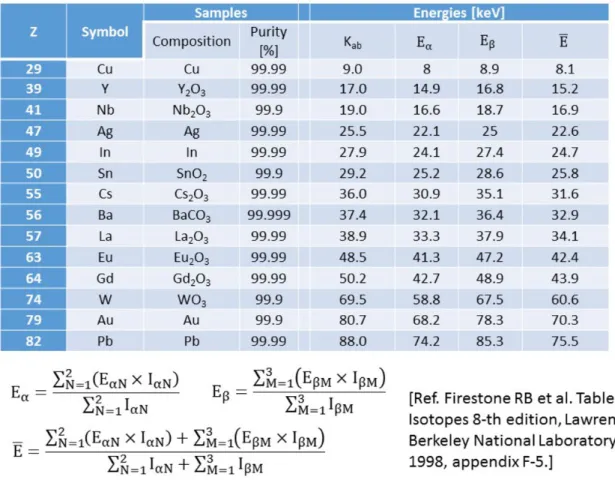
8 summarizes properties of irradiated samples; atomic number, symbol, composition
and purity of the sample, energies of K absorption edge, K-alpha rays, K-beta rays and effective energy are listed. The data were calculated by equations in Fig. 8 based on a well evaluated data base [6].
In the simulation, we calculated the response functions of monoenergetic photons having energies of 20-140 keV. In order to reduce statistical fluctuations, 1 mega incident photons were introduced to the detector. Here we consider two conditions; one is a narrow beam, and the other is a broad beam. In the results section, they will be compared with the experiments.
Page 9 of 28 Fig. 5: Lists of materials used in the present study.
Fig. 6: Chart of our study. We compare two spectra; one is measured with CdTe detector,
and another is calculated by Monte-Carlo simulation.
Page 11 of 28 Fig. 7: Photograph of the experimental setup and list of irradiation conditions.
Fig. 8: Properties of irradiated samples.
Page 13 of 28
Results
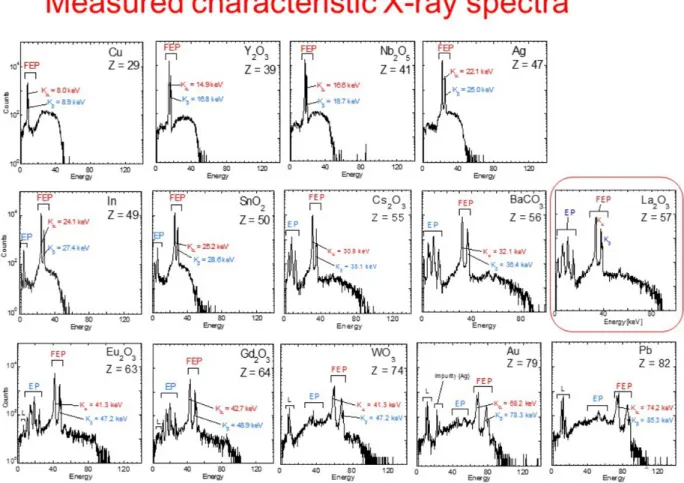
Figure 9 shows characteristic X-ray spectra measured with the CdTe detector. In the
upper row, the spectra of Cu, Y, Nb and Ag have relatively simple constructions in which FEP of K-alpha and K-beta rays are clearly observed. In contrast, the spectra of In, Sn, Cs, Ba and La in the middle row are more complex, namely the EP appears in addition to the FEP. Additionally, the spectra of Eu, Gd W, Au and Pb in the lower row show L series X-rays in the low energy region in addition to the EP and FEP.
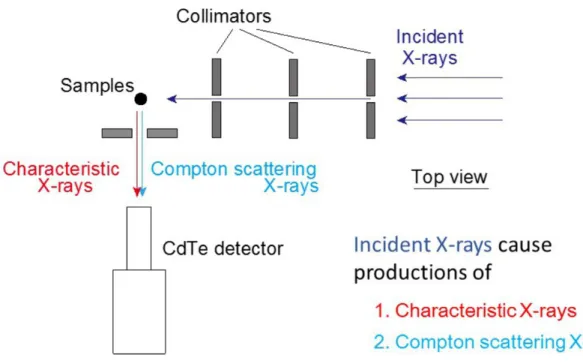
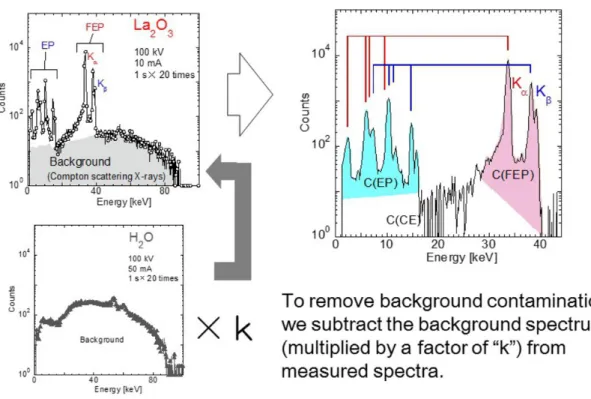
In fact, the background component caused by the Compton scattering of the incident X-rays is superimposed to the characteristic X-X-rays. Figure 10 represents this phenomena. The red arrow in Fig. 10 indicates the characteristic X-rays that are generated by the samples. The blue arrow shows Compton scattering X-rays that become an unnecessary background component. In our experiment as shown in Fig. 7, we set the detector perpendicular to the beam axis to reduce the background component. We do this because the intensity of Compton scattered X-rays at 90 degree is relatively low according to the Klein-Nishina formula [7,8]. Here, we propose a new methodology to remove the Compton-scattering X-rays in the measured spectrum. Using the measured spectra of La shown in Fig. 11, we exemplify the methodology of background reduction. During the experiment, we also measured the spectrum of water. Because water is composed of hydrogen and oxygen (low Z atoms), the characteristic X-rays from them are negligibly small. In the theoretical consideration of the Compton scattering, the distribution of the scattered X-rays were not depend on the atomic number. Therefore, we assumed that the spectrum only consisted of the background component. Then, we subtracted the background spectrum (water) from the measured spectrum of La. At that time, the factor of "k" was multiplied by the background spectrum so as to agree with the background component in the La spectrum. The right figure in Fig. 11 represents the background subtracted La spectrum, which is an experimentally derived response function. Although the FEP of this response function consists of K-alpha and K-beta rays, we assume these X-rays as a composite peak having an effective energy as represented in Fig. 8.
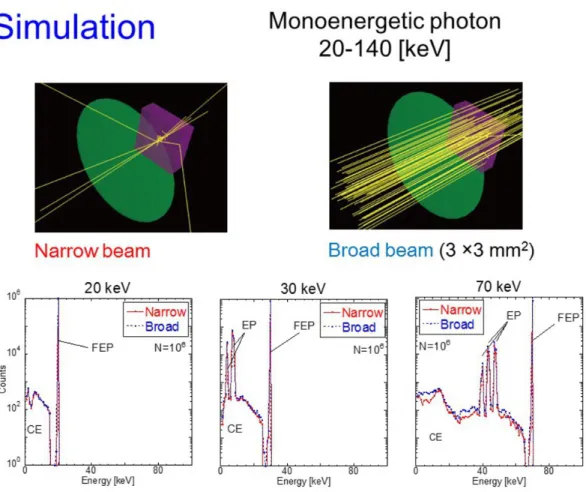
Typical simulated spectra were presented in Fig. 12. The upper images (computer graphics) show simulated tracks; the yellow lines indicate X-rays, and a green circle and purple cube show the Be window and CdTe detector, respectively. The image is created by "CG-view" which is software to display the simulated results of EGS5 [4,5]. The lower figures show the response functions simulated by EGS5, in which the FEP, EP and CE components are clearly observed. In the simulation, the number of incident photons was known, therefore the EE&PE components could be calculated. Figure 13
shows energetic dependence of the components. It is difficult to evaluate the EE&PE values in the experiment. Therefore, we focused attention on the two values, FEP and EP, and then the ratio of the two values from experiment were calculated and compared with the simulation.
Using Fig. 14, we discuss the identification of the EP. When a photoelectric effect occurs in Cd atom, characteristic X-rays of 23 keV (K-alpha) or 26 keV (K-beta) are emitted and some of them escape from the detector. In this case, escape peaks appear as indicated by "A" and "B" in the lower right figure of Fig. 14. In the similar way, when photoelectric effect occurs in the Te atom, characteristic X-rays of 27 keV (K-alpha) or 31 keV (K-beta) are emitted and formed escape peaks of "B" and "C". Energies of alpha of Te and K-beta of Cd are similar, so they become the doublet peaks "B". Consequently, there are three EP of "A", "B" and "C" in the response function as represented by lower right figure in Fig. 14. In contrast in the measured response function as shown in left figure of Fig.
14, there are two incident X-rays, K-alpha and K-beta of the metallic atom. The blue and
red solid lines in the graph indicate a relation between the FEP and EP. Although the EP in the measured spectrum is complexed, we can identify all peaks based on the analysis described above.
In order to evaluate the simulated response function, we calculate the ratio of EP to the FEP, and compared those with the experimental values. A schematic drawing is presented in Fig. 15. Figure 16 shows the comparison between the measured EP/FEP and simulated data. The experimental values of EP/FEP are in good agreement with the simulated values. This fact can be interpreted as the EGS5 code being able to produce the response function of the CdTe detector. The X-axis error of the experimental data is defined by the range between the minimum and maximum energies of the characteristic X-rays. In the next paragraph, we described the Y-axis error.
The error of the EP/FEP are evaluated by considering the systematic and statistical uncertainties as shown in Fig. 17. The systematic uncertainty originated from the subtraction of the background. So we estimate the accuracy to determine the factor of "k" and the effect on EP/FEP is evaluated. For the EP/FEP, effect of the statistical uncertainty caused by the Poisson distribution is also estimated. Then, total error of the EP/FEP is
Page 15 of 28
Finally, we present the application of the response functions calculated by EGS5. One of the important applications of the response functions is to unfold the measured spectra. The spectra measured with the CdTe detector has distortions caused by EP as well as other things. Therefore the spectra should be unfolded with the response function. Based on the simulated response functions, we made a program for unfolding in which a stripping method has been applied [9]. Figure 18 shows a comparison between the unfolded spectra and Birch's formula, which is widely used as a standard X-ray spectrum
[10]. The unfolded spectra for 60 kV and 80 kV X-ray spectra are in good agreement
with Birch's formula. This fact is consistent with the present study; the response function calculated by the EGS5 is available to analyze the spectra measured with the CdTe detector.
Images for this section:
Fig. 9: Characteristic X-ray spectra measured with the CdTe detector. FEP is clearly
observed for all samples. For samples having high atomic number, there are EP and L-rays in addition to the FEP.
© Health Biosciences, Tokushima University - Tokushima/JP
Fig. 10: Schematic drawing to explain the generation of the characteristic X-rays and
Compton scattering X-rays.
Page 17 of 28 Fig. 11: Example of the background subtraction in La. We assumed that the water sample
spectrum is only composed of the Compton-scattering X-rays. Then, the background spectrum was subtracted from the measured spectrum of La.
Fig. 12: Response functions simulated by EGS5.
Page 19 of 28 Fig. 13: Energy dependence of the ratio of FEP, EP, CE and EE&PE of the simulated
spectra.
Fig. 14: Identification methodology of the escape peaks. © Health Biosciences, Tokushima University - Tokushima/JP
Page 21 of 28 Fig. 15: Schematic drawing of the analysis. The ratio of EP to FEP is calculated. © Health Biosciences, Tokushima University - Tokushima/JP
Fig. 16: Comparison of EP/FEP; experimental and simulation. © Health Biosciences, Tokushima University - Tokushima/JP
Page 23 of 28 Fig. 17: Error estimation of the measured EP/FEP. The systematic and statistical
uncertainties are taken into account.
Fig. 18: Comparison between unfolded spectra and Birch's formula. © Health Biosciences, Tokushima University - Tokushima/JP
Page 25 of 28
Conclusion
In this study, we newly proposed the experimental method to evaluate the response functions of the CdTe detector. In our method, metallic samples were irradiated with diagnostic X-rays. The CdTe detector was exposed to characteristic X-rays caused by the photoelectric effect. In the EPOS, experimentally measured spectra of samples having atomic numbers of 29-82 were presented. Additionally, using the Monte-Carlo simulation code (EGS5), response functions were calculated. In order to evaluate the simulated response functions, all of observed peaks were identified and the ratio of escape peaks to the full energy peak (EP/FEP) was derived. The ratio derived from simulation was in good agreement with that of the experiment. Therefore, we conclude that the response functions calculated by EGS5 are valuable to evaluate interactions between X-rays and the CdTe detector. Recently, developing a photon counting technique is in progress, and the CdTe detector is considered to be used for the photon counting technique. Our present data and the proposed methodology are valuable to the advancement of this research (see Fig. 19).
Fig. 19: Summary of the present study.
Page 27 of 28
Personal information
Hiroaki Hayashi, Ph.D Assistant Professor
Tokushima University, Japan [email protected]
References
[1] K. Taguchi, JS. Iwanczyk. Vision 20/20: Single photon counting x-ray detectors in medical imaging. Medical Physics 40, 100901, 2013.
[2] EMF Japan, http://www.emf-japan.com/
[3] I. Fukuda et al., Development of an Experimental Apparatus for Energy Calibration of a CdTe Detector by Means of Diagnostic X-ray Equipment. Japanese Journal of Radiological Technology 69(9), 952, 2013.
[4] H. Hirayama et al. The EGS5 Code System. SLAC Report number: SLAC-R-730. KEK Report number: 2005-8., 2013.
[5] EGS5 community HP in KEK, http://rcwww.kek.jp/egsconf/
[6] RB Firestone, et al. Table of Isotopes 8-th edition, Lawrence Berkeley National Laboratory, 1998, appendix F-5.
[7] H. Hayashi et al. Development of new educational apparatus to visualize scattered X-rays. European Congress of Radiology 2015 (EPOS_C-0073), 2015.
[8] GF Knoll. Radiation Detection and Measurement. New York: John Willy and Sons, Inc., 2000.
[9] N Tsoulfanidis. Measurement and Detection of Radiation. Japanese translation rights arranged with McGraw-Hill Book Company through Tuttle-Mori Agency, Inc., Tokyo, 1983.
[10] R. Birch et al. Computation of bremsstrahlung Xray spectra and comparison with spectra measured with a Ge(Li) detector, Phys. Med. Biol. 24(3), 505, 1979.