Developing a quantification methodology for
the ecological status of benthic invertebrate
community using environmental DNA -A case
study in Natori River Basin-
著者
NORIKO UCHIDA
学位授与機関
Tohoku University
学位授与番号
11301甲第19288号
Doctoral Dissertation
Developing a quantification methodology for the ecological status of
benthic invertebrate community using environmental DNA
– A case study in Natori River Basin –
環境 DNA による河川の底生動物相の把握と定量化手法の開発
-宮城県名取川水系をモデルとして-
Supervisor So KAZAMA
Water-environmental system laboratory
Faculty of Engineering, Department of Civil and Environmental Engineering,
TOHOKU University
Noriko UCHIDA
February, 2020
Abstract
Monitoring benthic invertebrate community is key to assess the impacts of anthropogenic and climate change to freshwater ecosystem. However, conventional ecological surveys have considerable drawbacks, e.g., they are time-consuming, require human effort, and have difficulties in taxonomic identification of organisms, therefore conducting long-term and high frequent monitoring is not feasible. Thus, another ecological monitoring option is required. This dissertation aimed to explore the utility of environmental DNA (eDNA) for river benthic invertebrate communities in order to reveal the ecological and environmental status. Specifically, detectability of benthic invertebrate taxa at family level using eDNA, revealing a succession of community structure and quantitative potential using eDNA were investigated.
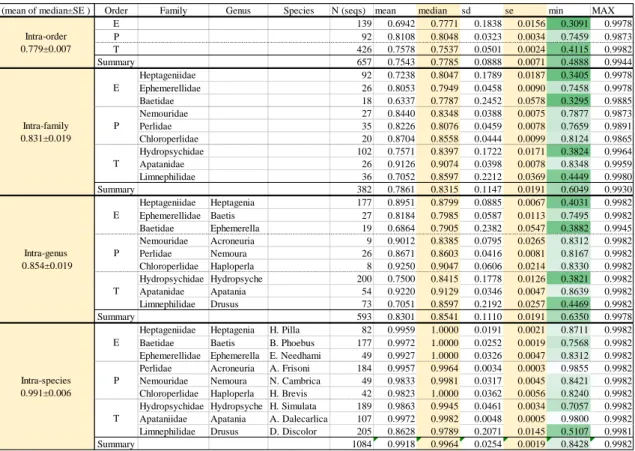
This dissertation used mainly two types of observed data: eDNA data extracted from surface river water and aquatic insect data identified morphologically. The field samplings were conducted once per a month from May to December in 2016 at Hirose River and Natori River in Miyagi Prefecture, Japan. The series of eDNA samples were subjected to metabarcoding to identify members of the aquatic insect communities from the sequences. Furthermore, to quantify DNA concentration, quantitative PCR (qPCR) was conducted. The two assays targeted the same DNA region, mitochondrial gene cytochrome c oxidase subunit I (COI). The thresholds for sequence assignation against reference database at each taxonomic classification level were investigated using a subset of Ephemeroptera, Plecoptera and Trichoptera sequence data registered in National Center for Biotechnology Information (NCBI, US) database. As a result, 85% identity was employed as the threshold for sequence assignation at family level against reference database in bioinformatics part of this dissertation. The target taxa were Ephemeroptera, Plecoptera, Trichoptera, Diptera, Coleoptera, Odonata, Hemiptera and Megaloptera, which mainly constitute a benthic invertebrate community in freshwater. Benthic invertebrates were collected using Surber net and identified morphologically, and measured number of individuals and dried-biomass.
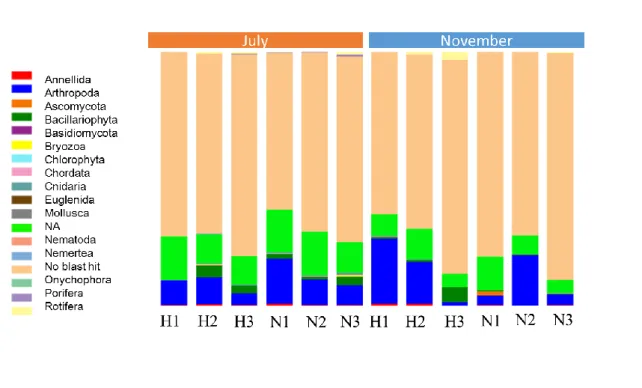
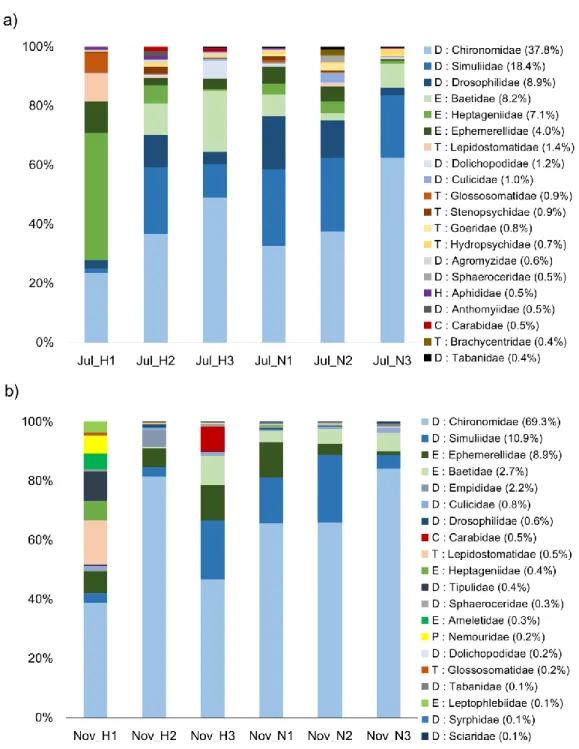
To investigate what kind of benthic invertebrate taxa can be detected by eDNA, eDNA samples of six reaches from upland- to lowland-domains along the two rivers taken in July and November were used. As a result of eDNA metabarcoding, 8.1% of the total sequence was assigned to aquatic insect taxa. The aquatic insects identified from all 12 eDNA samples were 93 families. Of these, 30 families were common with Surber net sampling results but five families could not be detected by
eDNA. Community dissimilarities were visually clustered by seasonal differences (R2 = 0.81, p-value
=0.001). In addition, the ordination of communities was correlated with total nutrient concentration, which was proxy of water pollution (R2 = 0.51, p-value =0.046).
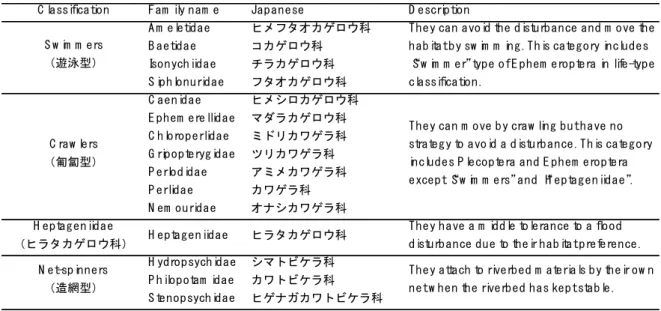
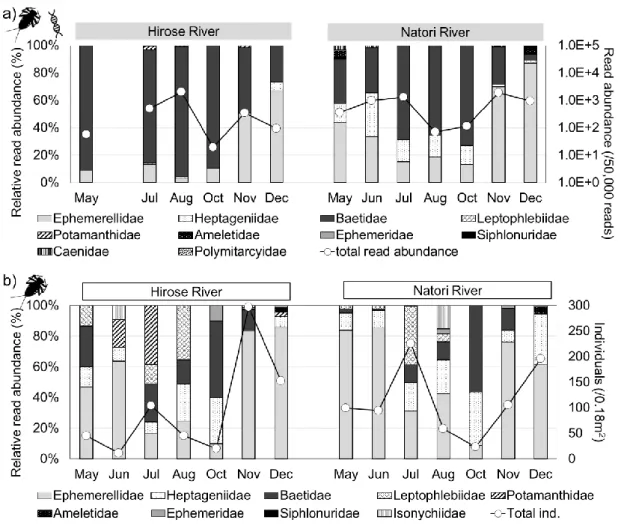
The time-series change during May to December in 2016 of the community structures of aquatic insects were observed using eDNA metabarcoding and a conventional Surber net survey. As a result, the rate of time-series change of taxa richness were consistent between eDNA and Surber net survey. In addition, community structures revealed by relative abundance from eDNA metabarcoding and the Surber net survey showed the same transition pattern after a flood disturbance, i.e. the ratio of swimmers increased immediately after the disturbance and the ratio of crawlers increased later. These results supported that the temporal change of community composition could be revealed by relative abundance of sequence reads from eDNA, while the read counts could not fully recover the actual community due to primer bias.
The dissertation examined the methodology to calculate the concentration of invertebrate species DNA by combination of qPCR and metabarcoding analysis. DNA concentrations targeting universal region in COI gene were quantified by qPCR and the proportion of each benthic invertebrate were calculated from relative read counts derived by metabarcoding. Finally, eDNA concentrations of each taxonomic groups were calculated by multiplying the proportion of each taxonomy and the quantified invertebrate DNA concentration. As a result, COI-DNA concentrations displayed significant positive correlations with total population of benthic invertebrates collected by the conventional Surber net sampling (Spearman’s rank correlation = 0.74, p-value = 0.002). Furthermore, positive correlations were shown between the population densities and eDNA concentrations for orders Ephemeroptera, Plecoptera, and Dipetra. These results indicate that the combination of eDNA metabarcoding and qPCR can be an effective methodology to estimate the abundance of stream insect. The dissertation demonstrated that eDNA can reveal the community status of richness, composition, and abundance in natural river system. A remarkable contribution of this dissertation was expanding utility of eDNA not only presence-absence data but also quantitative data with eDNA metabarcoding data for benthic invertebrates in the river system. Hereafter, eDNA will be a new choice of tools to monitor the ecological status of benthic invertebrate communities with minimum sampling effort.
ACKNOWLEDGEMENTS
I would like to express the deepest appreciation to my committee chair Professor So KAZAMA, a professor at Department of Civil Engineering, Graduate School of Engineering, Tohoku University: he constantly provided me fruitful education and chances to tackle this challenging research topic, and demonstrated to me the attitude and substance as a researcher of engineering.
I would like to thank my committee members, Professor Hitoshi TANAKA, Professor Fumihiko IMAMURA and Associate Professor Daisuke KOMORI at Department of Civil Engineering, Graduate School of Engineering, Tohoku University for constructive discussions and comments on the dissertation.
I express my sincere thanks to Associate Professor Kengo KUBOTA, an associate professor at Department of Civil Engineering, Graduate School of Engineering, Tohoku University: he substantially helped me learn what I need throughout research works, including laboratory experiments, knowledge of molecular biology, and scientific writing. Without his guidance and persistent help, this dissertation and publications would not have been possible.
In addition, a thank you to Professor Shunichi KOSHIMURA, Associate Professor Makoto UMEDA, Associate Professor Keiko UDO, Associate Professor Suppasri ANAWAT, Assistant Professor Nguyen Xuan TINH, Assistant Professor Masakazu HASHIMOTO, Assistant Professor Eric MAS, and Assistant Professor Yoshiya TOUGE at Department of Civil Engineering, Graduate School of Engineering, Tohoku University, for providing me discussions and comments from various aspects in seminars.
I thank Mr. Shunsuke Aita at Technical Division, School of Engineering, Tohoku University, who gratefully helped me with field observation and conducted morphological identification results of larvae carefully. I thank the past and present members of our laboratory for helping field surveys.
I am grateful to Assistant Professor Kei NUKAZAWA in Department of Civil and Environmental Engineering, University of Miyazaki, who brush up the study design and manuscript. I appreciate Associate Professor Yasuhiro TAKEMON in Disaster Prevention Research Institute, Kyoto University, who demonstrated the attitude and substance as a researcher of ecology and civil engineering. I gratefully acknowledge Professor Kozo WATANABE at Ehime University, Assistant Professor Sakiko YAEGASHI at Yamanashi University for fruitful and constant information exchange about environmental DNA. In addition, a thank you to Dr. Masahiro RYO at Free University of Berlin in Germany, who introduced me to statistics and how to survive the academic world.
I would also like to thank the financial support by Japan society for the Promotion of Science (JSPS) Research Fellowship (grant no. 17J02158, Noriko Uchida) and through the Program for Leading Graduate Schools, “Inter-Graduate School Doctoral Degree Program on Global Safety” and by the Ministry of Education, Science, Sports and Culture through a Grant-in-Aid for Scientific Research (grant nos. 16H02363, So Kazama).
vi
Contents
Chapter 1. Gener al introduction ... 1
1 . 1 B i o m o n i t o r i n g f o r g l o b a l e n v i r o n m e n t c h a n g e . . . 1 1 . 2 P r o s a n d c o n s o f e n v i r o n m e n t a l D N A . . . 3 1 . 3 R e s e a r c h g a p i n u t i l i t y o f e D N A f o r b e n t h i c i n v e r t e b r a t e i n r i v e r s y s t e m . . . . 6 1 . 4 T h e p u r p o s e a n d s t r u c t u r e o f t h e d i s s e r t a t i o n . . . 8 R e f e r e n c e s . . . 11
Chapter 2. Study field and target gene region ... 16
2 . 1 S a m p l i n g s i t e i n N a t o r i R i v e r b a s i n . . . 1 6 2 . 2 Ta rg e t D N A r e g i o n . . . 1 7 R e f e r e n c e s . . . 2 6
Chapter 3. M ateri als and Methodologies ... 28
3 . 1 I n t r o d u c t i o n . . . 2 8 3 . 2 e D N A s a m p l i n g a n d e x t r a c t i o n . . . 2 8 3 . 3 L i b r a r y p r e p a r i n g f o r e D N A m e t a b a r c o d i n g . . . 2 9 3 . 4 B i o i n f o r m a t i c s f o r e D N A m e t a b a r c o d i n g . . . 3 0 3 . 5 T h e c o n v e n t i o n a l S u r b e r - n e t s a m p l i n g ( N e t s a m p l i n g ) . . . 3 1 3 . 6 D i v e r s i t y i n d i c e s . . . 3 1 3 . 7 U n i F r a c a n a l y s i s . . . 3 3 R e f e r e n c e s . . . 3 6
vii
Chapter 4. Thresh old for taxonomic identif ication ... 38
4 . 1 I n t r o d u c t i o n . . . 3 8 4 . 2 M a t e r i a l s a n d m e t h o d s . . . 3 8 4 . 3 R e s u l t s a n d d i s c u s s i o n . . . 3 9 R e f e r e n c e s . . . 4 1
Chapter 5. Taxa d etectability of eDNA on presence -absence data .. 42
5 . 1 I n t r o d u c t i o n . . . 4 2 5 . 2 M a t e r i a l s a n d m e t h o d o l o g i e s . . . 4 4 5 . 2 . 1 D N A d a t a u s e d f o r c h a p t e r 5 . . . 4 4 5 . 2 . 2 D a t a a n a l y s i s . . . 4 4 5 . 2 . 3 Vi s u a l i z a t i o n o f c o m m u n i t y d i s s i m i l a r i t i e s . . . 4 5 5 . 3 R e s u l t s . . . 4 5 5 . 3 . 1 e D N A m e t a b a r c o d i n g t a x o n o m i c a s s i g n m e n t . . . 4 6 5 . 3 . 2 M o r p h o l o g i c a l t a x o n o m i c i d e n t i f i c a t i o n . . . 4 7 5 . 3 . 3 B i n a r y c l a s s i f i c a t i o n . . . 4 7 5 . 3 . 4 Vi s u a l i z e d c o m m u n i t y d i s s i m i l a r i t y ( P / A ) u s i n g n M D S . . . 4 8 5 . 4 D i s c u s s i o n . . . 4 9 5 . 4 . 1 A q u a t i c i n s e c t t a x a d e t e c t e d b y e D N A a n a l y s i s . . . 4 9 5 . 4 . 2 D i f f i c u l t i e s i n e D N A m e t a b a r c o d i n g f o r a q u a t i c i n s e c t . . . 5 0 R e f e r e n c e s . . . 6 0
viii
Chapter 6. Can relative abundance data obtained by eDNA
metabarcoding be u seful to reveal community structure? ... 63
6 . 1 I n t r o d u c t i o n . . . 6 3 6 . 2 M a t e r i a l s a n d M e t h o d o l o g i e s . . . 6 3 6 . 2 . 1 D N A d a t a u s e d f o r c h a p t e r 6 . . . 6 4 6 . 2 . 2 D a t a a n a l y s i s m e t h o d s . . . 6 4 6 . 3 R e s u l t s . . . 6 5 6 . 3 . 1 Ta x a r i c h n e s s b a s e d o n P r e s e n c e / A b s e n c e ( P / A ) d a t a . . . 6 6 6 . 3 . 2 C o m m u n i t y s t r u c t u r e b a s e d o n r e l a t i v e a b u n d a n c e o f t o t a l r e a d s o r i n d i v i d u a l s . . . 6 7 6 . 3 . 3 Ti m e s e r i e s v a r i a t i o n o f r e l a t i v e a b u n d a n c e o f E p h e m e r o p t e r a . . . 6 8 6 . 3 . 4 Ti m e s e r i e s v a r i a t i o n o f r e l a t i v e a b u n d a n c e o f Tr i c h o p t e r a . . . 6 8 6 . 3 . 5 Ti m e s e r i e s v a r i a t i o n o f r e l a t i v e a b u n d a n c e o f D i p t e r a . . . 6 9 6 . 3 . 6 Vi s u a l i z e d c o m m u n i t y d i s s i m i l a r i t y . . . 6 9 6 . 4 D i s c u s s i o n . . . 7 0 6 . 4 . 1 R e c o v e r y o f t a x a r i c h n e s s a f t e r t h e f l o o d d i s t u r b a n c e . . . 7 0 6 . 4 . 2 Te m p o r a l s u c c e s s i o n o f c o m m u n i t y b a s e d o n r e l a t i v e a b u n d a n c e . . . 7 1 R e f e r e n c e s . . . 9 1
Chapter 7. A qu antification met hodology for mul tiple taxonomic
groups using eDNA ... 93
7 . 1 I n t r o d u c t i o n . . . 9 3 7 . 2 M a t e r i a l s a n d M e t h o d o l o g i e s . . . 9 5
ix 7 . 2 . 1 D N A d a t a u s e d f o r C h a p t e r 7 . . . 9 5 7 . 2 . 2 Q u a n t i t a t i v e P C R a m p l i f i c a t i o n . . . 9 5 7 . 2 . 3 F o r m u l a f o r c a l c u l a t i o n o f D N A c o n c e n t r a t i o n f o r e a c h t a x a . . . 9 6 7 . 2 . 4 S t a t i s t i c a n a l y s i s . . . 9 6 7 . 3 R e s u l t s . . . 9 7 7 . 3 . 1 R e l a t i v e a b u n d a n c e f o r a q u a t i c i n s e c t o b t a i n e d f r o m e D N A . . . 9 7 7 . 3 . 2 P o p u l a t i o n d e n s i t y, d r i e d - b i o m a s s d e n s i t y a n d c a l c u l a t e d e D N A . . . 9 7 7 . 3 . 3 S p a t i a l v a r i a t i o n o f a b u n d a n c e r e v e a l e d b y S u r b e r - n e t a n d e D N A . . . 9 8 7 . 4 D i s c u s s i o n . . . 9 9 7 . 4 . 1 P o p u l a t i o n o r b i o m a s s d e n s i t y ? . . . 9 9 7 . 4 . 2 Va r i a t i o n o f e s t i m a b i l i t y d e p e n d i n g o n t a x o n o m i c o r d e r . . . 1 0 0 7 . 4 . 3 Te c h n i c a l d i ff i c u l t i e s f o r q u a n t i t a t i v e e s t i m a t i o n . . . 1 0 0 R e f e r e n c e s . . . 11 4
Chapter 8. Gener al conclusion s ... 117
8 . 1 D e t e c t a b i l i t y o f e D N A f o r r i v e r b e n t h i c i n v e r t e b r a t e s . . . 11 7 8 . 2 Tr a c e a b i l i t y o f s u c c e s s i o n o f c o m m u n i t y s t r u c t u r e . . . 11 7 8 . 3 Q u a n t i f i c a t i o n m e t h o d o l o g i e s u s i n g e D N A f o r m u l t i p l e t a x a . . . 11 8 8 . 4 C o n c l u s i o n s . . . 11 9 R e f e r e n c e s . . . 1 2 0
Appendix ... 117
x
List of f igures
1 . 1 S t u d y f l o w o f t h e d i s s e r t a t i o n . . . 1 0 2 . 1 S t u d y f i e l d a n d s a m p l i n g s i t e s . . . 2 0 2 . 2 D a i l y a v e r a g e d i s c h a r g e a t H i r o s e - b a s h i f l o w m o n i t o r i n g s i t e . . . 2 1 2 . 3 D a i l y a v e r a g e d i s c h a r g e a t Yo k a t a f l o w m o n i t o r i n g s i t e . . . . 2 1 2 . 4 I m a g e o f g e n e r e g i o n o f m i t o c h o n d r i a l D N A . . . 2 2 3 . 1 F l o w o f b i o i n f o r m a t i c s . . . 3 5 3 . 2 A b s t r a c t o f O T U c l u s t e r i n g a n d B L A S T a s s i g n m e n t . . . 3 5 5 . 1 C o m p o n e n t o f e D N A s a m p l e a t P h y l u m l e v e l . . . . 5 5 5 . 2 S t r u c t u r e o f a q u a t i c i n s e c t c o m m u n i t y b y e D N A s u b s a m p l e d 2 5 0 r e a d s i n m e t a b a r c o d i n g . . . . . 5 6 5 . 3 S h a n n o n d i v e r s i t y p l o t s o b t a i n e d b y e D N A a n d S u r b e r - n e t s a m p l i n g . . . . . 5 7 5 . 4 C o m m u n i t y d i s s i m i l a r i t y p l o t s f o r 2 5 0 r e a d s s u b s a m p l e d d a t a . . . . . . 5 8 5 . 5 C o m m u n i t y d i s s i m i l a r i t y p l o t s f o r 2 , 5 0 0 r e a d s s u b s a m p l e d d a t a . . . . . . . 5 9 5 . 6 T h e b i p l o t d i s s i m i l a r i t y p l o t s o f c o m m u n i t e s a n d e n v i r o n m e n t a l s t r e s s o r s. .. . . 5 9 6 . 1 D a i l y m e a n d i s c h a rg e a t Yo k a t a a n d H i r o s e - b a s h i o b s e r v a t i o n s i t e s . .. . . . . 7 9 6 . 2 Ti m e - s e r i e s f l u c t u a t i o n o f t a x a r i c h n e s s . . .. . . . . . 8 0 6 . 3 C o r r e s p o n d e n c e o f t h e t o t a l n u m b e r o f f a m i l y r i c h n e s s i n e D N A a n d S u r b e rxi n e t m e t h o d s a t e a c h m o n t h . . . .. . . . . . 8 1 6 . 4 C o r r e s p o n d e n c e o f t h e a m o u n t o f m o n t h l y c h a n g e o f f a m i l y r i c h n e s s i n e D N A a n d S u r b e r n e t m e t h o d s . . .. . . . . . 8 1 6 . 5 C o r r e s p o n d e n c e o f r a t e o f c h a n g e i n f a m i l y r i c h n e s s o b t a i n e d f r o m e D N A a n d S u r b e r n e t m e t h o d s . . . .. . . . . . 8 2 6 . 6 Ti m e - s e r i e s p a t t e r n o f t h e c o m m u n i t y s t r u c t u r e o f a l l o r d e r s . . .. . . . . . 8 3 6 . 7 Ti m e - s e r i e s p a t t e r n o f c o m m u n i t y s t r u c t u r e o f o r d e r E p h e m e r o p t e r a . . .. . . 8 4 6 . 8 Ti m e - s e r i e s p a t t e r n o f t h e c o m m u n i t y s t r u c t u r e o f o r d e r Tr i c h o p t e r a . . .. . . 8 5 6 . 9 Ti m e - s e r i e s p a t t e r n o f t h e c o m m u n i t y s t r u c t u r e o f o r d e r D i p t e r a . . .. . . . . . 8 6 6 . 1 0 n M D S p l o t o f c o m m u n i t y d i s s i m i l a r i t y. . .. . . . . . 8 7 6 . 11 Ti m e - s e r i e s c h a n g e o f c o m m u n i t y s t r u c t u r e c l a s s i f i e d b y t o l e r a n c e t y p e f o r d i s t u r b a n c e . . . .. . . . . . 8 8 6 . 1 2 Ti m e - s e r i e s c h a n g e o f n u m b e r o f e D N A r e a d s c l a s s i f i e d b y t o l e r a n c e t y p e f o r d i s t u r b a n c e f o r H i r o s e r i v e r. . .. . . . . . 8 9 6 . 1 3 Ti m e - s e r i e s c h a n g e o f n u m b e r o f i n d i v i d u a l s o f l a r v a e c l a s s i f i e d b y t o l e r a n c e t y p e f o r d i s t u r b a n c e f o r H i r o s e r i v e r . . .. . . . . . 8 9 6 . 1 4 Ti m e - s e r i e s c h a n g e o f n u m b e r o f e D N A r e a d s c l a s s i f i e d b y t o l e r a n c e t y p e f o r d i s t u r b a n c e f o r N a t o r i r i v e r. . .. . . . . . 9 0 6 . 1 5 Ti m e - s e r i e s c h a n g e o f n u m b e r o f i n d i v i d u a l s o f l a r v a e c l a s s i f i e d b y t o l e r a n c e t y p e f o r d i s t u r b a n c e f o r N a t o r i r i v e r. . .. . . . . . 9 0 7 . 1 T h e r e l a t i o n s h i p s b e t w e e n t h e p o p u l a t i o n d e n s i t y o f t o t a l a q u a t i c i n s e c t a n d e D N A . . . . . . 1 0 3
xii 7 . 2 T h e r e l a t i o n s h i p s b e t w e e n b i o m a s s d e n s i t y o f t o t a l i n s e c t s a n d e D N A . . . . 1 0 4 7 . 3 S p a t i a l v a r i a t i o n o f p o p u l a t i o n d e n s i t y a n d e D N A o f e a c h o r d e r i n H i r o s e R i v e r. . . . . . 1 0 5 7 . 4 S p a t i a l v a r i a t i o n o f p o p u l a t i o n d e n s i t y a n d e D N A o f e a c h o r d e r i n N a t o r i R i v e r. . . . . . 1 0 6 7 . 5 R e l a t i o n s h i p s b e t w e e n e D N A a n d i n d i v i d u a l s o f E p h e m e r o p t e r a . . . . . . 1 0 7 7 . 6 R e l a t i o n s h i p s b e t w e e n e D N A a n d i n d i v i d u a l s o f P l e c o p t e r a . . . . . . 1 0 8 7 . 7 R e l a t i o n s h i p s b e t w e e n e D N A a n d i n d i v i d u a l s o f Ti c h o p t e r a . . . . . . 1 0 9 7 . 8 R e l a t i o n s h i p s b e t w e e n e D N A a n d i n d i v i d u a l s o f D i p t e r a . . . . . . 11 0 7 . 9 R e l a t i o n s h i p s b e t w e e n e D N A a n d i n d i v i d u a l s o f C o l e o p t e r a . . . . . . 111 7 . 1 0 R e l a t i o n s h i p s b e t w e e n e D N A a n d i n d i v i d u a l s o f O d o n a t a . . . . . . 11 2
xiii
List of tables
2 . 1 F i e l d i n f o r m a t i o n . . . 1 9 2 . 2 C o r r e s p o n d i n g t a b l e o f u s e d d a t a a n d c h a p t e r n u m b e r . . . 1 9 4 . 1 R e s u l t s o f g e n e t i c i d e n t i t i e s w i t h i n e a c h t a x o n o m i c c l a s s i f i c a t i o n l e v e l . . . 4 0 5 . 1 C o n c e p t o f b i n a r y c l a s s i f i c a t i o n f o r c h a p t e r 5 . . . 5 2 5 . 2 O b s e r v e d e n v i r o n m e n t a l s t r e s s o r s . . . 5 2 5 . 3 R e s u l t s o f m e t a b a r c o d i n g a n d S u r b e r n e t s a m p l i n g u s e d i n c h a p t e r 5 . . . 5 3 5 . 4 R e s u l t s o f b i n a r y c l a s s i f i c a t i o n . . . 5 4 5 . 5 C o r r e l a t i o n b e t w e e n e n v i r o n m e n t a l s t r e s s o r s a n d c o m m u n i t y . . . 5 4 6 . 1 M e t a b a r c o d i n g r e s u l t s a n d S u r b e r n e t s a m p l i n g r e s u l t s . . . 7 4 6 . 2 Ta x a d e t e c t e d b y e D N A m e t a b a r c o d i n g a n d S u r b e r n e t s a m p l i n g . . . . 7 3 6 . 3 C l a s s i f i c a t i o n b y t o l e r a n c e t y p e f o r d i s t u r b a n c e , m o d i f i e d f r o m F u r u t a n i a n d Ta n a k a ( 2 0 1 4 ) . . . . . 7 8 7 . 1 R e l a t i v e a b u n d a n c e ( % ) o f a q u a t i c i n s e c t g r o u p s d e r i v e d f r o m s e q u e n c e r e a d a b u n d a n c e . . . . 11 3 7 . 2 R e s u l t s o f l i n e a r r e g r e s s i o n a s s i g n m e n t . . . . . 11 3xiv
List of pic t ures
2 . 1 L a n d s c a p e o f s i t e H 1 . . . 2 3 2 . 2 L a n d s c a p e o f s i t e H 2 . . . 2 3 2 . 3 L a n d s c a p e o f s i t e H 3 . . . 2 4 2 . 4 L a n d s c a p e o f s i t e N 1 . . . 2 4 2 . 5 L a n d s c a p e o f s i t e N 2 . . . 2 5 2 . 6 L a n d s c a p e o f s i t e N 3 . . . 2 5 3 . 1 A q u a t i c i n s e c t s a m p l i n g u s i n g S u r b e r - n e t w i t h q u a d r a t f r o m r i v e r b e d . . . 3 4 3 . 2 F i r s t s c r e e n i n g o f o r g a n i s m s . . . 3 4
1
Chapter 1.
General introduction
1.1 Biomonitoring for adopting global environment change
Biological monitoring is essential to sustainable society since natural ecosystems have been threatened by serious environmental changes. Particularly, freshwater ecosystems require long-term and broad-areal monitoring because they are highly relevant to Sustainable Development Goals (SDGs). Freshwater systems provide irreplaceable ecological services such as water supply (Goal 2 ‘Zero hunger’, and 6 ‘Clean water and sanitation’) and fishery resource (Goal 2, 14 ‘Life below water’ and 15 ‘Life on land’) and also habitat for numerous rare and endangered species. However, freshwater is estimated the most vulnerable ecosystem (Sala et al., 2000) since its hydro-physical condition such as water temperature and discharge are depending on climate and it is already affected to anthropogenic stressors such as discharge decreasing by water abstraction and habitat disconnecting by damming, and water quality declining by land-use changes (Woodward et al., 2010). 81% of the population of freshwater vertebrates had been lost within 42 years from 1970 to 2012 (WWF, 2016) and this percentage is higher than other ecosystems e.g. terrestrial (37%), and ocean (52%).
Despite these serious situations, the environmental impacts on ecosystems are not fully understood yet due to the large problem of lack of sustained spatial and temporal biological data. Ecosystem diversity i.e. ecosystem diversity, species diversity, and genetic diversity is one of the fundamental information to measure biodiversity, that is
2
known to be influenced by environmental stressors (Emilson et al., 2017; Watanabe et
al., 2014). However, measuring species diversity requires several times of sampling
because species emergence varies depends on seasons and places (Helms et al., 2009; Johnson et al., 2012; Vieira et al., n.d.). For example, some species of benthic invertebrates in river emerge a limited season therefore one-time sampling could overlook that species (Sueyoshi et al., 2016, in Japanese). Besides, quantitative data i.e. density of population and biomass data can provide the productivity rate of the system. It is also meaningful to compare and estimate the ecological services e.g. catch amount for fisheries and predict the extinction/mass generation of animals. However, because quantitative data is highly fluctuating depending on the sampling points and timings, multiple (replicated) samplings are required to obtain annual patterns or general patterns of quantitative variation. Moreover, species composition based on relative abundance or P/A data provides the status of the ecosystem because the ecological system consists of several communities that have different functional traits e.g. decomposer, producer, and consumer. Since organisms in the community interact with each other, including competition and dispersion, the trend of composition in the community also helps to measure the impact of complex stressors. However, monitoring community structure also needs a longer sampling term.
Indeed, conventional biological surveys have certain limitations to be conducted frequently. First, different survey approaches and experienced people have to be employed for collecting each target organism. Investigators need to obtain a hang of each methodology, for example, to capture fishes, observe birds visually, and collect benthic animals with small loss of individuals. However, it is commonly difficult to maintain the number of experienced investigators and to uniform the abilities among investigators.
3
Even the numerical model can calibrate and consider these non-uniformities of survey data, the labor burden directly makes difficulties to consecutive monitoring. Second, morphological taxonomic identification is usually time-consuming. Taxonomists, high level expertized people who cover the latest knowledge of morphological keys and ecology of each group, are required for precise taxonomic identification, but the number of them is limited. Third, morphological keys are insufficient because they cannot be applied for cryptic taxa, and they are often effective only for a particular life stage (e.g. final stage of larvae, breeding period) or gender (e.g., male genitals) of organisms. Hence, biological monitoring needs to be improved for continuous surveillance.
1.2 Pros and cons of environmental DNA
Environmental DNA (eDNA), a new biomonitoring strategy, can solve the inherent issues in conventional methods. eDNA means the DNA that is extracted from an environmental sample such as water, soil, ice. eDNA is originated from metabolites such as the skin cells, mucus, saliva, feces of macro-organisms (Rees et al., 2014). eDNA enables fast detection without individual identification owing to signals by the success of DNA amplification using Polymerase Chain Reaction (PCR) can tell the presence of the target species, once species-specific primer sets are developed referring their sequence data. Sampling for eDNA just requires the grab samplings of environmental samples at fields, and the samples are assayed by molecular biological approaches in a laboratory, such as DNA extraction, PCR for detecting a specific organism. Hering et al. (2018) summarize the effectiveness of eDNA by each Biological Quality Elements categories, and report that
4
sampling effort is reasonably smaller than conventional methods for phytoplankton, phytobenthos, invertebrates, and fish in rivers. In addition, eDNA can minimize time and economic costs than traditional methods. Yamanaka and Minamoto (2016) report that the PCR approach using eDNA enables around five-folded shorter hours for sample processing than the conventional survey for habitat detection for fishes. Moreover, eDNA can examine various organism group with a coherent sampling method. eDNA extracted from water samples can detect most of organisms e.g. fishes (Ficetola et al., 2008), amphibians (Goldberg et al., 2018), birds (Ushio et al., 2018), insects (Deiner et al., 2015), mammals (Ushio et al., 2017), and algae (Shaw et al., 2019) while the best protocol differs from organisms.
eDNA has significant advantages in taxa detection with the metabarcoding approach. Metabarcoding is a genomic identification that exploits the variety among DNA sequences of each organism as 'barcodes' of life to identify the taxonomic diagnoses (Hebert et al., 2003; Wilson, 2012) for multiple species/samples by a high throughput sequencing e.g. Illumina MiSeq (Deiner et al., 2017). To detect multiple taxa, metabarcoding employs the ‘universal’ primer sets that can bind to a wide variety of DNA templates. By eDNA metabarcoding with universal primer for fish, 93.3% of sea fish species in aquariums can be revealed (Miya et al., 2015). It can provide not only aquatic invertebrate species but also terrestrial species when applied to DNA extracted from river water (Deiner et al., 2016). Regarding cost-benefit, Fernández et al. (2018) show that effort cost of eDNA metabarcoding is one fifth that of conventional survey method while money cost is still higher in eDNA at the current moment. eDNA metabarcoding provide ecological information that could not be revealed by conventional methods.
5
Since eDNA approaches are in their early stage of development, the crucial problems have remained (Cristescu and Hebert, 2018; Goldberg et al., 2015). In particular, eDNA in river systems detect false negatives and false positives due to the inflow of biological DNA living in the upper stream and resuspension of DNA restored in sediments. In addition, the amount of eDNA release rate and degradation rate for each species are mostly unknown. Furthermore, an insufficient reference database of DNA sequences and unsuitable PCR primers can lead the false negatives.
Nevertheless of the uncertainties in the current situation, eDNA can be promised the objectivity of data and its analysis. Grab sampling does not require higher skill, then it is highly objective. Moreover, most of the parts of eDNA sample processing can be automated with new technologies. In the sampling phase, for example, Unmanned Aerial Vehicle (UAV) is successful to take a water sample without contamination (Doi et al., 2017). Accomplished equipment to allow on-site eDNA analysis are intensively developed by business companies, such as filtering (“eDNA Sampler Backpack”, Smith-Root, WA, USA), DNA extraction (Thermo Fisher Scientific, MA, USA), PCR (“Eco Real-Time PCR”, Illumina, CA, USA), and metabarcoding (“MinION”, Oxford Nanopore Technologies, UK) The molecular assay process mostly can be automated to handle vast samples, eliminating human intervention, and reducing or homogenizing processing errors (Porter and Hajibabaei, 2018). Samples and extracted DNA can be preserved in a deep freezer (-80°C) for a long time, therefore it can be re-analyzed in the future. For eDNA metabarcoding, not only data owner but also a third party can re-analyze the sequenced data obtained from eDNA metabarcoding since the data is registered for an open database such as the National Center for Biotechnology Information (NCBI), DNA Data Bank of Japan (DDBJ). Owing to these flexibility,
effort-6
cost efficiency and expansibility, eDNA approach is expected to be a cutting edge for biomonitoring.
1.3 Research gap in the utility of eDNA for benthic invertebrate in river systems
eDNA is not yet fully explored in its utility while eDNA is of interest from various science fields, government, and industry. Particularly, eDNA studies targeting benthic invertebrates in river systems, namely aquatic insects, are limited. Aquatic insects have been used as bio-indicators due to their sensitivities of environmental changes for around 40 years (Armitage et al., 1987; Blocksom and Johnson, 2009; Wallace et al., 1996). They also compose of core community to maintain freshwater food web, since they play roles as primary consumer and secondary producers as food for higher trophic level predators (Nakano et al., 1999). Therefore, continuous monitoring of this group is expected to ostensively show environmental changes and ecological status. However, according to Roussel et al. (2015), the number of published papers of eDNA has rapidly grown but not for Arthropods with only 8% of total papers, which is mostly occupied by crustacean e.g. amphipod and crayfish. Following the literature analysis methodologies by Roussel et al
(2015), a total of 14 relevant articles were found on 12th November 2019 from the Web
of Science using the following criteria: eDNA AND water OR freshwater OR stream OR river AND aquatic insect OR insect OR macroinvertebrate. Even the number of reports increased from 2015, it is still 0.18% of total 7,923 eDNA publications (Web of Science
on 12th November 2019 with following searching criteria: eDNA AND water OR
7
first eDNA paper on fish in the world was published in 2008 by Ficetola et al., whereas the first publication on aquatic insects was in 2014, indicating a lack of interest in insects. This situation was due to comparably higher interest in fishes and amphibians for the priority in conservation and protection, and in fishes and bivalves for its importance as fishery productivity.
eDNA researches also tackle to quantitative evaluation of organisms because abundance-based data such as population and biomass are fundamental information to evaluate the trends of the biological community. PCR based methods are generally conducted to quantify the amount of DNA (Jo et al., 2019; Katano et al., 2017; Nukazawa et al., 2018). Indeed, PCR is an established method to measure DNA since it had published (Mullis and Faloona, 1985). However, because of its specificity for target organisms, it is effective only to the targeted organisms and species-specific primers have to be developed one by one. On the other hand, metabarcoding allows targeting broader organisms at once. Metabarcoding has been used extensively by environmental DNA research to clarify the biota of samples. Metabarcoding using MiSeq specifically amplifies the target DNA region by PCR using universal primers and decodes the sequence with a fluorescent signal. However, there are two crucial biases because of the variations of sequences between species: first, the ease of binding between the universal primer and the sequence varies depending on species (primer bias). Second, the PCR amplification efficiency also varies between species (PCR bias). Due to these biases, the proportion of sequences that are low amplification efficiency becomes very small when there are amount of sequences that are high efficiency. That is, the ratio of the number of sequences reads obtained by metabarcoding (relative abundance) does not accurately recover the original ratio of DNA in the sample or animal abundance in the community
8
(Cristescu and Hebert, 2018; Elbrecht et al., 2017). Therefore, eDNA metabarcoding studies could not step into quantitative evaluation (Hajibabaei et al., 2019; Macher et al., 2018). However, in metabarcoding studies using tissue DNA extracted from animal bodies, a positive correlation was confirmed between the abundance of living organisms and the number of sequences (Amend et al., 2010; Elbrecht and Leese, 2015; Saitoh et al., 2016; Serrana et al., 2018). Quantitative comparison within species should be tested in the context of eDNA even though between species comparison can be skewed because of the biases.
1.4 The purpose and structure of the dissertation
The present dissertation aimed to explore the utility of eDNA for river benthic invertebrate community in terms both of presence/absence and relative abundance. Finally, this dissertation developed a quantification methodology for benthic invertebrate in the river using eDNA. The dissertation was composed of eight chapters (See Fig. 1.1). Chapter 1 explained the study purpose referring general background of biomonitoring and eDNA studies. In chapter 2, the study field and target genome region were explained. Briefly, the present research was conducted in two rivers from Natori River Basin, Miyagi Prefecture in Japan, with targeting cytochrome oxidase subunit I region of mitochondrial DNA of benthic invertebrates. Materials and methodologies for data collection, assay and analysis were described in chapter 3. Chapter 4 showed the methodologies to determine the numerical threshold for taxonomic diagnoses based on sequences but were independent of chapter 3 because it contained individual results. Chapters 5 to 7 were the main bodies of this dissertation, containing each introduction, materials and
9
methodologies, results and discussion. In chapter 5, the presence/absence detectability for benthic invertebrate in the river was examined by comparing eDNA metabarcoding and a conventional sampling method. Chapter 6 explored the utility of read counts derived by metabarcoding for community structure monitoring focusing on succession after flood disturbance. Chapter 7 developed a quantitative methodology for multiple benthic invertebrate groups using eDNA metabarcoding and quantitative PCR. Finally, chapter 8 expressed the general conclusion, limitations, and perspectives about eDNA for a new biomonitoring tool.
10
11 References
Amend, A.S., Seifert, K.A., Bruns, T.D., 2010. Quantifying microbial communities with 454 pyrosequencing: does read abundance count? Molecular Ecology 19, 5555–5565. https://doi.org/10.1111/j.1365-294X.2010.04898.x
Armitage, P.D., Gunn, R.J.M., Furse, M.T., Wright, J.F., Moss, D., 1987. The use of prediction to assess macroinvertebrate response to river regulation. Hydrobiologia 144, 25–32.
https://doi.org/10.1007/BF00008048
Blocksom, K.A., Johnson, B.R., 2009. Development of a regional macroinvertebrate index for large river bioassessment. Ecological Indicators 9, 313–328. https://doi.org/10.1016/j.ecolind.2008.05.005 Cristescu, M.E., Hebert, P.D.N., 2018. Uses and Misuses of Environmental DNA in Biodiversity Science
and Conservation. Annual Review of Ecology, Evolution, and Systematics 49, 209–230. https://doi.org/10.1146/annurev-ecolsys-110617-062306
Deiner, K., Bik, H.M., Mächler, E., Seymour, M., Lacoursière‐Roussel, A., Altermatt, F., Creer, S., Bista, I., Lodge, D.M., Vere, N. de, Pfrender, M.E., Bernatchez, L., 2017. Environmental DNA metabarcoding: Transforming how we survey animal and plant communities. Molecular Ecology 26, 5872–5895. https://doi.org/10.1111/mec.14350
Deiner, K., Fronhofer, E.A., Mächler, E., Walser, J.-C., Altermatt, F., 2016. Environmental DNA reveals that rivers are conveyer belts of biodiversity information. Nat Commun 7, 1–9.
https://doi.org/10.1038/ncomms12544
Deiner, K., Walser, J.-C., Mächler, E., Altermatt, F., 2015. Choice of capture and extraction methods affect detection of freshwater biodiversity from environmental DNA. Biological Conservation 183, 53–63. https://doi.org/10.1016/j.biocon.2014.11.018
Doi, H., Akamatsu, Y., Watanabe, Y., Goto, M., Inui, R., Katano, I., Nagano, M., Takahara, T., Minamoto, T., 2017. Water sampling for environmental DNA surveys by using an unmanned aerial vehicle. Limnology and Oceanography: Methods 15, 939–944.
https://doi.org/10.1002/lom3.10214
Elbrecht, V., Leese, F., 2015. Can DNA-Based Ecosystem Assessments Quantify Species Abundance? Testing Primer Bias and Biomass—Sequence Relationships with an Innovative Metabarcoding Protocol. PLOS ONE 10, e0130324. https://doi.org/10.1371/journal.pone.0130324
Elbrecht, V., Vamos, E.E., Meissner, K., Aroviita, J., Leese, F., 2017. Assessing strengths and
weaknesses of DNA metabarcoding-based macroinvertebrate identification for routine stream monitoring. Methods in Ecology and Evolution 8, 1265–1275. https://doi.org/10.1111/2041-210X.12789
12
Emilson, C.E., Thompson, D.G., Venier, L.A., Porter, T.M., Swystun, T., Chartrand, D., Capell, S., Hajibabaei, M., 2017. DNA metabarcoding and morphological macroinvertebrate metrics reveal the same changes in boreal watersheds across an environmental gradient. Scientific Reports 7. https://doi.org/10.1038/s41598-017-13157-x
Fernández, S., Rodríguez, S., Martínez, J.L., Borrell, Y.J., Ardura, A., García-Vázquez, E., 2018.
Evaluating freshwater macroinvertebrates from eDNA metabarcoding: A river Nalón case study. PLoS One 13. https://doi.org/10.1371/journal.pone.0201741
Ficetola, G.F., Miaud, C., Pompanon, F., Taberlet, P., 2008. Species detection using environmental DNA from water samples. Biology Letters 4, 423–425. https://doi.org/10.1098/rsbl.2008.0118 Goldberg, C.S., Strickler, K.M., Fremier, A.K., 2018. Degradation and dispersion limit environmental
DNA detection of rare amphibians in wetlands: Increasing efficacy of sampling designs. Science of The Total Environment 633, 695–703. https://doi.org/10.1016/j.scitotenv.2018.02.295 Goldberg, C.S., Strickler, K.M., Pilliod, D.S., 2015. Moving environmental DNA methods from concept
to practice for monitoring aquatic macroorganisms. Biological Conservation 183, 1–3. https://doi.org/10.1016/j.biocon.2014.11.040
Hajibabaei, M., Porter, T.M., Robinson, C.V., Baird, D.J., Shokralla, S., Wright, M., 2019. Watered-down biodiversity? A comparison of metabarcoding results from DNA extracted from matched water and bulk tissue biomonitoring samples (preprint). Ecology. https://doi.org/10.1101/575928 Hebert, P.D.N., Cywinska, A., Ball, S.L., deWaard, J.R., 2003. Biological identifications through DNA
barcodes. Proc. R. Soc. Lond. B 270, 313–321. https://doi.org/10.1098/rspb.2002.2218 Helms, B.S., Schoonover, J.E., Feminella, J.W., 2009. Seasonal variability of landuse impacts on
macroinvertebrate assemblages in streams of western Georgia, USA. Journal of the North American Benthological Society 28, 991–1006. https://doi.org/10.1899/08-162.1
Hering, D., Borja, A., Jones, J.I., Pont, D., Boets, P., Bouchez, A., Bruce, K., Drakare, S., Hänfling, B., Kahlert, M., Leese, F., Meissner, K., Mergen, P., Reyjol, Y., Segurado, P., Vogler, A., Kelly, M., 2018. Implementation options for DNA-based identification into ecological status assessment under the European Water Framework Directive. Water Research 138, 192–205.
https://doi.org/10.1016/j.watres.2018.03.003
Jo, T., Murakami, H., Yamamoto, S., Masuda, R., Minamoto, T., 2019. Effect of water temperature and fish biomass on environmental DNA shedding, degradation, and size distribution. Ecology and Evolution 9, 1135–1146. https://doi.org/10.1002/ece3.4802
Johnson, R.C., Carreiro, M.M., Jin, H.-S., Jack, J.D., 2012. Within-year temporal variation and life-cycle seasonality affect stream macroinvertebrate community structure and biotic metrics. Ecological Indicators 13, 206–214. https://doi.org/10.1016/j.ecolind.2011.06.004
13
Katano, I., Harada, K., Doi, H., Souma, R., Minamoto, T., 2017. Environmental DNA method for estimating salamander distribution in headwater streams, and a comparison of water sampling methods. PLOS ONE 12, e0176541. https://doi.org/10.1371/journal.pone.0176541
Macher, J.-N., Vivancos, A., Piggott, J.J., Centeno, F.C., Matthaei, C.D., Leese, F., 2018. Comparison of environmental DNA and bulk-sample metabarcoding using highly degenerate cytochrome c oxidase I primers. Molecular Ecology Resources 18, 1456–1468. https://doi.org/10.1111/1755-0998.12940
Miya, M., Sato, Y., Fukunaga, T., Sado, T., Poulsen, J.Y., Sato, K., Minamoto, T., Yamamoto, S., Yamanaka, H., Araki, H., Kondoh, M., Iwasaki, W., 2015. MiFish, a set of universal PCR primers for metabarcoding environmental DNA from fishes: detection of more than 230 subtropical marine species. R. Soc. Open Sci. 2, 150088. https://doi.org/10.1098/rsos.150088 Nakano, S., Miyasaka, H., Kuhara, N., 1999. Terrestrial–Aquatic Linkages: Riparian Arthropod Inputs
Alter Trophic Cascades in a Stream Food Web. Ecology 80, 2435–2441. https://doi.org/10.1890/0012-9658(1999)080[2435:TALRAI]2.0.CO;2
Nukazawa, K., Hamasuna, Y., Suzuki, Y., 2018. Simulating the Advection and Degradation of the Environmental DNA of Common Carp along a River. Environ. Sci. Technol. 52, 10562–10570. https://doi.org/10.1021/acs.est.8b02293
Porter, T.M., Hajibabaei, M., 2018. Automated high throughput animal CO1 metabarcode classification. Scientific Reports 8, 4226. https://doi.org/10.1038/s41598-018-22505-4
Rees, H.C., Maddison, B.C., Middleditch, D.J., Patmore, J.R.M., Gough, K.C., 2014. REVIEW: The detection of aquatic animal species using environmental DNA – a review of eDNA as a survey tool in ecology. Journal of Applied Ecology 51, 1450–1459. https://doi.org/10.1111/1365-2664.12306
Roussel, J.-M., Paillisson, J.-M., Tréguier, A., Petit, E., 2015. The downside of eDNA as a survey tool in water bodies. Journal of Applied Ecology 52, 823–826.
https://doi.org/10.1111/1365-2664.12428
Saitoh, S., Aoyama, H., Fujii, S., Sunagawa, H., Nagahama, H., Akutsu, M., Shinzato, N., Kaneko, N., Nakamori, T., 2016. A quantitative protocol for DNA metabarcoding of springtails
(Collembola). Genome 59, 705–723. https://doi.org/10.1139/gen-2015-0228
Sala, O.E., Chapin, F.S., Iii, Armesto, J.J., Berlow, E., Bloomfield, J., Dirzo, R., Huber-Sanwald, E., Huenneke, L.F., Jackson, R.B., Kinzig, A., Leemans, R., Lodge, D.M., Mooney, H.A., Oesterheld, M., Poff, N.L., Sykes, M.T., Walker, B.H., Walker, M., Wall, D.H., 2000. Global Biodiversity Scenarios for the Year 2100. Science 287, 1770–1774.
14
Serrana, J.M., Yaegashi, S., Kondoh, S., Li, B., Robinson, C.T., Watanabe, K., 2018. Ecological influence of sediment bypass tunnels on macroinvertebrates in dam-fragmented rivers by DNA metabarcoding. Scientific Reports 8. https://doi.org/10.1038/s41598-018-28624-2
Shaw, J.L.A., Weyrich, L.S., Hallegraeff, G., Cooper, A., 2019. Retrospective eDNA assessment of potentially harmful algae in historical ship ballast tank and marine port sediments. Molecular Ecology 28, 2476–2485. https://doi.org/10.1111/mec.15055
Ushio, M., Fukuda, H., Inoue, T., Makoto, K., Kishida, O., Sato, K., Murata, K., Nikaido, M., Sado, T., Sato, Y., Takeshita, M., Iwasaki, W., Yamanaka, H., Kondoh, M., Miya, M., 2017.
Environmental DNA enables detection of terrestrial mammals from forest pond water. Mol. Ecol. Resour. 17, e63–e75. https://doi.org/10.1111/1755-0998.12690
Ushio, M., Murata, K., Sado, T., Nishiumi, I., Takeshita, M., Iwasaki, W., Miya, M., 2018. Demonstration of the potential of environmental DNA as a tool for the detection of avian species. Scientific Reports 8, 4493. https://doi.org/10.1038/s41598-018-22817-5
Vieira, N.K.M., Poff, N.L., Carlisle, D.M., Ii, S.R.M., Koski, M.L., Kondratieff, B.C., n.d. A Database of Lotic Invertebrate Traits for North America 19.
Wallace, J.B., Grubaugh, J.W., Whiles, M.R., 1996. Biotic Indices and Stream Ecosystem Processes: Results from an Experimental Study. Ecological Applications 6, 140–151.
https://doi.org/10.2307/2269560
Watanabe, K., Kazama, S., Omura, T., Monaghan, M.T., 2014. Adaptive Genetic Divergence along Narrow Environmental Gradients in Four Stream Insects. PLoS ONE 9, e93055.
https://doi.org/10.1371/journal.pone.0093055
Wilson, J.J., 2012. DNA Barcodes for Insects, in: Kress, W.J., Erickson, D.L. (Eds.), DNA Barcodes. Humana Press, Totowa, NJ, pp. 17–46. https://doi.org/10.1007/978-1-61779-591-6_3
Woodward, G., Perkins, D.M., Brown, L.E., 2010. Climate change and freshwater ecosystems: impacts across multiple levels of organization. Philosophical Transactions of the Royal Society B: Biological Sciences 365, 2093–2106. https://doi.org/10.1098/rstb.2010.0055
WWF, 2016. Living Planet Report 2016: Risk and Resilience in a New Era. WWW International, Gland, Switzerland.
Yamanaka, H., Minamoto, T., 2016. The use of environmental DNA of fishes as an efficient method of determining habitat connectivity. Ecological Indicators 62, 147–153.
https://doi.org/10.1016/j.ecolind.2015.11.022
Sueyoshi, M., Akasaka, T., Mori, T., Ishiyama, N., Kawamoto, T., Takekawa, Y., Inoue, M., Mitsuhashi, H., Kawaguchi, Y., Onikura, N., Miyake, Y., Katano, I. and Nakamura, F., 2016. Towards the use of National Census on River Environments data for conservation: issues and a case study. Japanese Journal of Conservation Ecology 21, pp. 167-180. (in Japanese)
15
Oxford Nanopore Technologies, ‘MinION’, Oxford Nanopore Technologies, UK, Accessed 12 November 2019. http://nanoporetech.com/products/minion.
Smith-Root, ‘EDNA Sampler Backpack’, WA, USA, Accessed 12 November 2019, https://www.smith-root.com/edna/edna-sampler.
Illumina, ‘Eco Real-Time PCR System Support’, Accessed 12 November 2019, https://jp.support.illumina.com/real_time_pcr/eco_qpcr.html.
DDBJ, Accessed 11 November 2019, https://www.ddbj.nig.ac.jp/index.html NCBI, Accessed 11 November 2019, https://www.ncbi.nlm.nih.gov/,
Web of Science, Accessed 9 November 2019, https://clarivate.jp/products/web-of-science/ United Nations, Accessed 19November 2019, https://www.un.org/sustainabledevelopment/
16
Chapter 2.
Study field and target gene region
2.1 Sampling site in Natori River basin
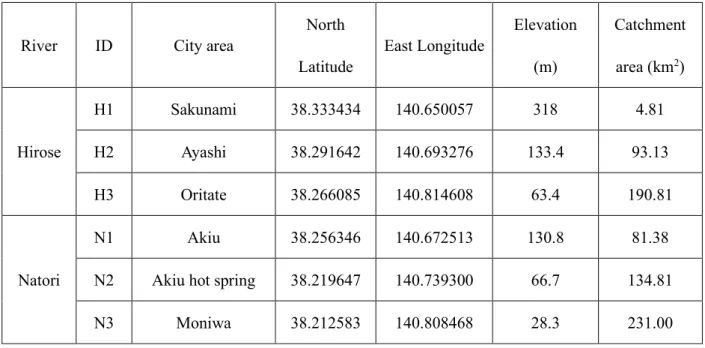
Field sampling was conducted at Hirose River and Natori River, which are located in the Natori river basin, Miyagi Prefecture, northeast Japan (Fig. 2.1). These are temperate rivers that originate in the Zao-Funagata Mountains and flow through the hills at the middle reach and through urbanized flatlands at the lower reach, and finally output into the Pacific Ocean. The length of Hirose River channel is 45.2 km and the catchment area is 315.9 km2. Natori River is 55.0 km long and the catchment area is 623.0 km2 (not including the Hirose River basin). The average bed slope of rivers is steep in the upstream area with 1/10 to 1/100, moderate in the hilly middle area with 1/100 to 1/200 and flat in downstream to river mouth area with 1/200 to 1/3000. Sampling was conducted at the six reaches from upland- to lowland-domains along the two rivers. The sampling campaign was almost done in 2016, but to observe the seasonal change of DNA concentration in a various land-used river, it was conducted in 2017-2018 (for details, see Fig. 2.1, Table 2.1 and Table 2.2). The daily mean discharge of two rivers at the downstream monitoring site of the Ministry of Land, Infrastructure, Transport and Tourism of government of Japan (MLIT) were shown in Fig. 2.2 and Fig. 2.3. Natori River Basin has total 1,864 taxa of terrestrial insects, 614 taxa of benthic invertebrates, 95 taxa of fishes, 129 of birds, 18 of mammals, 7 of reptiles and 7 of amphibians, according to National Census on River Environmental data from five times
17
survey in 1995, 2000, 2005, 2009 and 2014. The images of the landscape for each sampling site (H1-H3, N1-N3) were shown in Picture. 2.1 - 2.6.
2.2 Target DNA region
Mitochondrial gene cytochrome c oxidase subunit I (COI) were established as a global identification region for animals by Hebert et al. (2003) because COI has significant advantages as a target region for barcoding (Chial & Craig 2008). The one is that the universal primer for this region is highly conserved and robust, therefore its 5’ end can be recovered from representatives of most (Folmer et al., 1994). The other is its greater range of phylogenetic signal than any other gene of the mitochondrion. Due to the rapid evolution of this gene, it enables to discriminate not only closely allied species but also intraspecific phylogeographic groups (Cox and Hebert, 2001; Wares and Cunningham, 2001). The DNA barcoding using COI region of animals has been promoted by powerful and international projects, such as Barcode of Life (BOL) from USA, Biomonitoring 2.0 in Canada, and also for insects (Clarke et al., 2014). Hence, the sequence database of COI region is the most prevalent for invertebrates. From the above reasons, the present study targeted COI region for eDNA barcoding for benthic invertebrates. The universal primer set developed by Folmer et al., (1994) was used in the present study, i.e. LCO1490 (5′-GGT CAA CAA ATC ATA AAG ATA TTG G-3′) as forward primer and HC02198 (5′-TAA ACT TCA GGG TGA CCA AAA AAT CA-3′) as reverse primer, resulting in an amplification of a 658-bp fragment. Folmer et al (1994) had tested the utility of this primer sets with 11 Phylum of invertebrates, namely, Echinodermata, Mollusca, Annelida, Pogonophora, Arthropoda, Nemertinea, Coelenterata. After then, orders from class ‘Insecta’ also had tested, such as
18
Ephemeroptera, Plecoptera, Trichoptera, Diptera (Smith 2006 & 2007), Coleoptera (Greenstone 2005), Hemiptera (Habeeb & Sanjayan 2011), Lepidoptera (Hajibabaei et al., 2006)(Hebert 2004; Hajibabaei 2006; Burns 2008), and Hymenoptera (Smith 2008; Fisher 2008).
19
Figures and tables
Table 2.1 Field location
Table 2.2 Corresponding table of used data and chapter number
Chapter Target Data type Sampling
site(s) Sampling term Original paper
5 taxonomic
detectability p/a data (spatial)
H1, H2, H3 N1, N2, N3
Jun. and Nov. 2016.
Peer J (EN) (in review)
p/a data (time-series) H3, N1 May-Dec.
2016.
ECE (JP) (in review)
6 community
structure relative abundance H3, N1
May-Dec. 2016.
ECE (in review)
7 quantification relative abundance x qDNA H1, H2, H3 N1, N2, N3
Jun. and Nov. 2016.
JSCE (JP) (accepted) ECE; Ecology and Civil Engineering, JSCE; Japanese Society of Civil Engineering
Brackets in the columns of “original paper” show the current status of papers (2020/1/20).
River ID City area
North Latitude East Longitude Elevation (m) Catchment area (km2) Hirose H1 Sakunami 38.333434 140.650057 318 4.81 H2 Ayashi 38.291642 140.693276 133.4 93.13 H3 Oritate 38.266085 140.814608 63.4 190.81 Natori N1 Akiu 38.256346 140.672513 130.8 81.38
N2 Akiu hot spring 38.219647 140.739300 66.7 134.81
20
Fig. 2.1 Study field and sampling sites. Orange circles represent sampling sites of Hirose River, while blue circles represent that of Natori River. The circles with gray rectangles i.e. H3 and N1 are used for seasonal analysis. In addition, green triangles represent flow observation stations by MLIT.
21
Fig. 2.2 Daily average discharge at Hirose-bashi flow monitoring site. The site locates in Hirose River.during and the panel shows values during 1st April to 31st December, 2016
Fig. 2.3 Daily average discharge at Yokata flow monitoring site. The site locates in Natori River and the panel shows values during 1st April to 31st December, 2016
22
23
Picture. 2.1 Landscape of site H1 (taken by the Author 2015/7/9)
24
Picture. 2.3 Landscape of site H3 (taken by the Author 2015/7/9)
25
Picture. 2.5 Landscape of site N2 (taken by the Author 2015/7/8)
26
References:
JBOLI, https://www.jboli.org/ (accessed on 11th Nov., 2019.)
Black, M., Hoeh, W., Lutz, R., Vrijenhoek, R., n.d. DNA primers for amplification of mitochondrial cytochrome c oxidase subunit I from diverse metazoan invertebrates 6.
Chial, H., Craig, J., 2008. mtDNA and Mitochondrial Diseases. Nature Education 1, 217.
Clarke, L.J., Soubrier, J., Weyrich, L.S., Cooper, A., 2014. Environmental metabarcodes for insects: in silico PCR reveals potential for taxonomic bias. Molecular Ecology Resources 14, 1160–1170. https://doi.org/10.1111/1755-0998.12265
Cognato, A.I., 2006. Standard Percent DNA Sequence Difference for Insects Does Not Predict Species Boundaries. JOURNAL OF ECONOMIC ENTOMOLOGY 99, 9.
Cox, A.J., Hebert, P.D.N., 2001. Colonization, extinction, and phylogeographic patterning in a freshwater crustacean. Mol Ecol 10, 371–386. https://doi.org/10.1046/j.1365-294x.2001.01188.x
Dasmahapatra, K.K., Mallet, J., 2006. Taxonomy: DNA barcodes: recent successes and future prospects [WWW Document]. Heredity. https://doi.org/10.1038/sj.hdy.6800858
Deagle, B.E., Jarman, S.N., Coissac, E., Pompanon, F., Taberlet, P., 2014. DNA metabarcoding and the cytochrome c oxidase subunit I marker: not a perfect match. Biology Letters 10, 20140562. https://doi.org/10.1098/rsbl.2014.0562
Folmer, O., Black, M.B., Hoeh, W., Lutz, R., Vrijenhoek, R.C., 1994. DNA primers for amplification of mitochondrial cytochrome c oxidase subunit I from diverse metazoan invertebrates. Molecular Marine Biology and Biotechnology 3, 294–299.
Hajibabaei, M., Janzen, D.H., Burns, J.M., Hallwachs, W., Hebert, P.D.N., 2006. DNA barcodes distinguish species of tropical Lepidoptera. Proceedings of the National Academy of Sciences 103, 968–971. https://doi.org/10.1073/pnas.0510466103
Hebert, Paul D. N., Cywinska, A., Ball, S.L., deWaard, J.R., 2003. Biological identifications through DNA barcodes. Proc. R. Soc. Lond. B 270, 313–321. https://doi.org/10.1098/rspb.2002.2218
Hebert, Paul D N, Ratnasingham, S., deWaard, J.R., 2003. Barcoding animal life: cytochrome c oxidase subunit 1 divergences among closely related species. Proc Biol Sci 270, S96–S99. https://doi.org/10.1098/rsbl.2003.0025
Heller, P., Casaletto, J., Ruiz, G., Geller, J., 2018. A database of metazoan cytochrome c oxidase subunit I gene sequences derived from GenBank with CO-ARBitrator. Scientific Data 5, 180156. https://doi.org/10.1038/sdata.2018.156
Kim, D.-W., Yoo, W.G., Park, H.C., Yoo, H.S., Kang, D.W., Jin, S.D., Min, H.K., Paek, W.K., Lim, J., 2012. DNA Barcoding of Fish, Insects, and Shellfish in Korea. Genomics Inform 10, 206–211. https://doi.org/10.5808/GI.2012.10.3.206
27
Molina, C.I., Gibon, F.-M., Dominguez, E., Pape, T., Rønsted, N., n.d. Associating immatures and adults of aquatic insects using DNA barcoding in high Andean streams 12.
Pons, J., Barraclough, T.G., Gomez-Zurita, J., Cardoso, A., Duran, D.P., Hazell, S., Kamoun, S., Sumlin, W.D., Vogler, A.P., 2006. Sequence-Based Species Delimitation for the DNA Taxonomy of Undescribed Insects. Syst Biol 55, 595–609. https://doi.org/10.1080/10635150600852011 Richardson, R.T., Bengtsson-Palme, J., Gardiner, M.M., Johnson, R.M., 2018. A reference cytochrome c
oxidase subunit I database curated for hierarchical classification of arthropod metabarcoding data. PeerJ 6, e5126. https://doi.org/10.7717/peerj.5126
Wares, J.P., Cunningham, C.W., 2001. PHYLOGEOGRAPHY AND HISTORICAL ECOLOGY OF THE NORTH ATLANTIC INTERTIDAL. Evolution 55, 2455–2469. https://doi.org/10.1111/j.0014-3820.2001.tb00760.x
Wilson, J.J., 2012. DNA Barcodes for Insects, in: Kress, W.J., Erickson, D.L. (Eds.), DNA Barcodes. Humana Press, Totowa, NJ, pp. 17–46. https://doi.org/10.1007/978-1-61779-591-6_3
28
Chapter 3.
Materials and Methodologies
3.1 Introduction
The methodologies to analyze eDNA have been advancing constantly after the first publication of eDNA in the world by Ficetola et al. (2008). The capture and extraction methods are depending on the target organisms (Deiner et al., 2015). Therefore, the present study employed suitable protocols to detect and quantify the invertebrate DNA from water samples, by referring mainly published papers until 2016. The methodologies in bioinformatics were mainly established by modifying the pipeline for analysis of the microbiome. In particular, the rationale thresholds for taxonomic identification were explored based on the theoretical idea from the field of microbiology (Yarza et al., 2014) in Chapter 4. While this study used the following methodologies and mostly succeeded detection of benthic invertebrate eDNA, the protocols should be improved with innovating new information from time to time because the technologies and methodologies are evolved fast.
3.2 eDNA sampling and extraction
Water samples for eDNA analysis were collected before the conventional collection method. The plastic bottles for eDNA sampling were sterilized with 10% chlorine bleach (Kao Corporation, Tokyo, Japan) and rinsed with tap water in the laboratory, and subsequently
29
washed three times with river water at the collection site before sampling. At each site, 1 L of flowing surface water was collected (Mächler et al., 2016) at the end of riffles to take DNA originated from various aquatic insects. Note, the surface water is not necessarily representative of the whole of the aquatic insect community in each site but all of the samples in this study were taken from the surface water nevertheless of water depth. Bottled water samples were transported to the laboratory on ice in a cool box. Water samples were filtered on that day using vacuum filtration with 47-mm diameter glass-fiber filters with a 0.7-µm pore size (GF/F, Whatman, 1 L/filter). These filtered samples were stored at −20°C until DNA extraction. DNA was extracted from the filters through lysis using proteinase K at 56°C for 30 min. After incubation, the supernatant was subjected to phenol-chloroform-isoamyl alcohol extraction and ethanol precipitation. Eventually, the elution was purified using the OneStep PCR Inhibitor Removal Kit (Zymo Research, Irvine, CA, USA) with a final volume of 100 µl.
3.3 Library preparing for eDNA metabarcoding
For MiSeq library preparation, a three-step PCR was conducted. The first PCR was performed in a total volume 20 µl PCR mixture containing 10 µl of TaqTM HS Low DNA (TaKaRa, Kyoto, Japan), 0.4 µl each of 10 µM forward and reverse primers, 17.2 µl ultra-pure water, and 2.0 µl of template DNA. The PCR conditions were as follows: 35 cycles at 94°C for 5 s, 50°C for 5 s, 68°C for 10 s; and a final extension at 68°C for 7 min. The fragment size of amplicons and concentrations were verified by electrophoresis using the Agilent 2100 Bioanalyzer DNA7500 kit (Agilent, Santa Clara, CA, USA). PCR products were purified using the Agencourt AMPure XP (Beckman Coulter, Brea, CA, USA) and the purified products were used as the template for the following. The second PCR was
30
performed to add the overhang sequences that required amplification with the Nextera XT Index Kit v2 for Illumina MiSeq analysis using Ex Taq Hot Start Version (TaKaRa, Kyoto, Japan). The PCR conditions were as follows: 94°C for 2 min; followed by 5 cycles of 94°C for 30 s, 50°C for 30 s, 72°C for 30 s; and a final extension at 72°C for 5 min. The amplicons were electrophoresis verified and purified in the same way as those from the first PCR, and the purified products were used as templates for the following. The third PCR was performed using Ex Taq Hot Start Version and Nextera XT Indice Kit v2 Set A (Illumina, San Diego, CA, USA). The PCR conditions were followed: 94°C for 2 min; followed by 8 cycles of 94°C for 30 s, 50°C for 30 s, 72°C for 30 s; and a final extension at 72°C for 5 min. After purification by AMPure XP and verification by BioAnalyzer, the final PCR amplicons were quantified using the Qubit dsDNA High Sensitivity Kit. The sequencing of prepared libraries was performed following the manufacturer’s instructions for MiSeq. More details were described in the Appendix.
3.4 Bioinformatics for eDNA metabarcoding
The sequence lengths were 658 bp; therefore, the forward and reverse reads in our study could not be merged while MiSeq Reagent Kit v3 (600 cycles) were adopted. Elbrecht and Leese (2017) demonstrated that invertebrate species could be identified at the reverse side of the CO1 region through an in silico PCR. Therefore, we conducted a subsequent analysis using the reverse side sequence. A flow of bioinformatics analysis is shown in Figure 3.1. At first, raw sequence reads were subjected to the Trimmomatic v0.36 software to discard low-quality sequences and read sequence lengths of <150 bp. Filtered reads were clustered into operational taxonomic units (OTUs) with an identity cut-off value of 97% which is a common approach for invertebrate metabarcoding analyses (Macher et al., 2018) using
31
QIIME (Caporaso et al., 2010); subsequently, OTUs with singleton sequences were removed. The most frequently occurring sequences in each OTU were extracted as representative sequences. An abstract figure of BLAST assignment is shown in Figure 3.2. Taxonomic identification was performed by BLAST search using the QIIME script “assign_taxonomy.py” with a minimum percent identity of 85% (see Chapter 4) and a maximum e-value of 10−50 (Fernández et al., 2018). The assignment was performed against 3,433,026 sequences retrieved from the NCBI database by the following search criteria: cytochrome [all fields] AND oxidase [all fields] AND mitochondrion [filter].
3.5 The conventional Surber net sampling (Net sampling)
Conventional aquatic insect collection was conducted at the same sites and on the same days but after eDNA sampling. It was performed using a Surber net of 250-µm mesh size, in a 30 cm x 30 cm quadrat at randomly selected a riffle and a pool habitat in rivers (collection area in total: 0.18m2 /reach, see Picture 3.1, 3.2). Collected invertebrates were placed in a 99.5% ethanol solution and morphological identification using a stereomicroscope (Leica MZ APO, Leica, Germany) by referring to the identification key for the aquatic insects of Japan (Kawai and Tanida, 2018). Because morphological identification was difficult for some aquatic insects, particularly Chironomidae and some Baetidae. Individuals and richness and dried-biomass were summarized at family level. Finally, the larvae were put in an oven at 60°C for 24 hours and measured the dried biomass by each finest taxonomic group.
3.6 Diversity indices
32
Alpha diversity was measured by the taxonomic richness that the number of taxon member comprised communities. Beta diversity metrics assess the differences between biological communities. In the present study, spatial/temporal community changes were discussed based on the dissimilarity indices. For presence and absence data, Sorensen's dissimilarity (see formula [3-1]) index was used. This index is evaluated the good simulation results than other binary indices such as the Jaccard index. As for relevancy with the Sorensen index, the Bray-Curtis index (see formula [3-2]) was applied for population abundance data. In addition, to cover the sampling size bias, the Chao index (see formula [3-3]) were also performed.
𝑆𝐴, 𝑆𝐵: the number of member (taxonomic richness) of community A (B)
𝑆𝐴𝐵 : the number of shared taxa of community A and B
𝑥𝐴𝑖, 𝑥𝐵𝑖: population abundance of taxon i in community A (B) 1≦ i ≦n, 0≦Bray-Curtis index≦1
𝑈̂𝐴, 𝑈̂𝐵: estimated probability of choosing shared taxon from community A and B.
𝐵𝑟𝑎𝑦 − 𝐶𝑢𝑟𝑡𝑖𝑠 𝑖𝑛𝑑𝑒𝑥(𝐴𝐵)= ∑ |𝑥𝐴𝑖− 𝑥𝐵𝑖| 𝑛 𝑖=1 ∑𝑛𝑖=1(𝑥𝐴𝑖+ 𝑥𝐵𝑖) 𝐶ℎ𝑎𝑜 = 𝑈̂𝐴∗ 𝑈̂𝐵 𝑈̂𝐴+ 𝑈̂𝐵− 𝑈̂𝐴 ∗ 𝑈̂𝐵 [3-2] [3-3] 𝑆𝑜𝑟𝑒𝑛𝑠𝑒𝑛 𝑖𝑛𝑑𝑒𝑥 = 2𝑆𝐴𝐵 𝑆𝐴 + 𝑆𝐵 [3-1]
33
3.7 UniFrac analysis
Unique Fraction (UniFrac) metrics are a phylogenetic-based method that considers evolutionary divergence based on a branch length of a phylogenetic tree. Firstly, a phylogenetic tree is constructed by reference sequences from the database. Secondary, UniFrac distance is calculated by the proportion of shared branch length and unique branch length. For example, if the two comparing taxa are identical, the distance is only 0 but if the two are completely non-identical, the distance is 1. There are two types for UniFrac Distance: one is Unweighted UniFrac distance which shows the member of the community without these read abundance. The other is Weighted UniFrac distance which uses branch length weighted the number of read abundance.
34
Pictures
Picture 3.1. Aquatic insect sampling using Surber-net with quadrat from river bed
35
Figures
Fig. 3.1. Flow of bioinformatics