Radar Application to Monitoring of Fluid
Migration in Porous Material
著者
金 東勲
学位授与機関
Tohoku University
1
Radar Application to Monitoring of
Fluid Migration in Porous Material
レーダを利用した空隙を持つ
物質中の液体移動モニタリング
by
Dong-Hun Kim
Submitted to Tohoku University
for
Master of Environmental Studies
Committee in charge:
Prof. Motoyuki Sato, Tohoku Univ.
Prof. Takatoshi Ito, Tohoku Univ.
Assoc. Prof. Yuichi Niibori, Tohoku Univ.
Contents
Chapter 1 Introduction
1.1 Background of the research 1
1.2 Contents of dissertation 7
Chapter 2 Principles of fluid migration in porous material
2.1 Fluid migration in unconsolidated sand 8
2.2 Subsurface water migration 10
Chapter 3 Configuration of GPR Measurements
3.1 Measurement of fluid migration 12
3.1.1 Characteristics of the host material 12
3.1.2 Characteristics of fracture fluid 13
3.1.3 Method of hydraulic fracturing 14
3.1.4 Measurement system configuration 15
3.1.5 Vivaldi array antenna 16
3.2 Measurement of water migration in Vadose zone 19
3.2.1 Characteristics of Vadose zone 19
3.2.2 Characteristics of migrated water 19
3.2.3 Method of water injection 22
3.2.4 Measurement system configuration 22
3.2.5 Dipole array antenna 22
3.2.6 Optical link system 24
3.2.7 Evaluation of measurement system 25
Chapter 4 Experiments
4.1 Monitoring of fluid migration in a sand specimen 27
4.1.1 Experiment results 28
4.1.2 Frequency shift analysis 37
3
4.2.1 Experiment results 41
4.2.2 Analysis 46
Chapter 5 Fluid Migration Modeling
5.1 Modeling of the fluid migration in a sand specimen 49
5.1.1 1-D (Dimensional) model 49
5.1.2 3-D model 51
5.1.3 Analysis 54
5.2 Modeling of the subsurface water migration 54
5.2.1 Piston model without edge leakage effect 54
5.2.2 Piston model with edge leakage effect 56
Chapter 6 Conclusions 58
Appendix
A.1 Volumetric moisture contents in the condensed region 61
A.2 2-D tomography 61
References 65
Publications 67
List of figures
Chapter 1 Introduction
Fig. 1.1 Hydraulic fracturing for extraction of methane hydrate. 3
Fig. 1.2 Performance of surface-based GPR with survey region. 5
Fig. 1.3 Performance with survey region of (a) single-hole radar (b) cross-hole radar. 6
Fig. 1.4 Nuclear waste disposal facility. 6
Fig. 1.5 SPR storage. 7
Chapter 2 Principles of fluid migration in porous material
Fig. 2.1 Methane hydrate phases. 9Fig. 2.2 Cross-section of specimen. 10
Chapter 3 Configuration of GPR Measurements
Fig. 3.1 Waveform of received signal. 13Fig. 3.2 Fracturing fluid in a box to acquire its electric permittivity. 14
Fig. 3.3 Test specimen for hydraulic fracturing. 15
Fig. 3.4 Observation result of pulse generator signal. 16
Fig. 3.5 Vivaldi antenna element (a) Front side (b) Back side, Vivaldi array antenna (c) Front side (d) Back side, Unit = mm. 17
Fig. 3.6 Return losses of Vivaldi antenna element and Vivaldi array antenna (a) Measurement (b) Simulation. 18
Fig. 3.7 Radiation patterns of Vivaldi antenna element and Vivaldi array antenna at 3 GHz (a) H-plane (Measurement) (b) E-H-plane (Measurement) (c) H-H-plane (Simulation) (d) E-H-plane (Simulation). 18 Fig. 3.8 Borehole radar experiment (a) A complete view (b) Measurement instruments (c) Antennas (d) System diagram. 21
Fig. 3.9 Appearance of dipole antennas (a) Cylindrical dipole antenna (b) Rod-type dipole antenna. 23 Fig. 3.10 Return loss of dipole antennas. 24
Fig. 3.11 Radiation pattern of a dipole antenna (E-plane) (a) Cylindrical dipole antenna (b) Rod-type dipole antenna. 24
5
Fig. 3.13 Power spectrum of optical link system with attenuation (a) Optical down link (b) Optical
probe. 25
Fig. 3.14 Transmission between dipole antennas. 26
Chapter 4 Experiments
Fig. 4.1 Inner structure of specimen. 28Fig. 4.2 Configuration of measurement system. 29
Fig. 4.3 Pressure of mixed fracturing fluid. 30
Fig. 4.4 Cross-section of specimen. 30
Fig. 4.5 Schematic diagrams of propagating wave paths which have a distance (a) 11 cm (b) 11.40 cm (c) 12.53 cm (d) 14.21 cm. 31
Fig. 4.6 Travel times to propagating wave paths which have a distance (a) 11 cm (b) 11.40 cm (c) 12.53 cm (d) 14.21 cm. 32
Fig. 4.7 Arrival time of the infiltrated region. 33
Fig. 4.8 Pressure of mixed fracturing fluid. 34
Fig. 4.9 Cross-section of specimen. 35
Fig. 4.10 Schematic diagrams of propagating wave paths which have a distance (a) 11 cm (b) 11.40 cm (c) 12.53 cm (d) 14.21 cm. 35
Fig. 4.11 Travel times to propagating wave paths which have a distance (a) 11 cm (b) 11.40 cm (c) 12.53 cm (d) 14.21 cm. 37
Fig. 4.12 Arrival time of the infiltrated region. 37
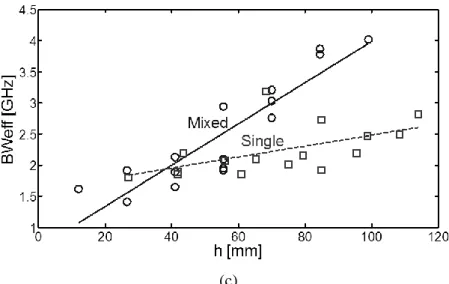
Fig. 4.13 Residual spectral centroid (a) Example for explanation a concept of residual spectral centroid (b) Residual spectral centroid (c) Effective bandwidth. 40
Fig. 4.14 Setup of borehole radar. 41
Fig. 4.15 Travel times by first peak and leading edge. 42
Fig. 4.16 1st experiment time domain analysis (a) Travel time (b) Apparent permittivity 44
Fig. 4.17 1st experiment residual variation at 225 MHz. 44
Fig. 4.18 2nd experiment time domain analysis (a) Travel time (b) Apparent permittivity 46
Fig. 4.19 2nd experiment residual variation at 225 MHz. 46
Fig. 4.20 Differential permittivity profile with time. 47
Fig. 4.21 Variation of travel times with water infiltration. 48
Chapter 5 Fluid Migration Modeling
Fig. 5.1 1-D (Dimensional) model (a) 1-D (Dimensional) migration model (b) Travel time with εr,II. 50 Fig. 5.2 3-D (Dimensional) model (a) Hypothesis I (b) Hypothesis II and III. 52Fig. 5.3 FDTD results (a) Hypothesis I (b) Hypothesis II (c) Hypothesis III. 53
Fig. 5.4 Effect of water front movement to travel time. 55
Fig. 5.5 Normalized fluctuation of electric permittivity. 55
Fig. 5.6 Envelop infiltration velocity and water front depth. 57
Appendix
Fig. A.1 2-D electric permittivity tomography (a) Mapping (b) Initial (0 min) (c) After breakdown (3 min) (d) Final (15 min). 647
List of tables
Chapter 2 Principles of fluid migration in porous material
Table 2.1 Saturated hydraulic conductivity (K) values found in nature. 11
Chapter 4 Monitoring of Fluid Migration in Specimen and Subsurface
Table 4.1 Specifications of measurement. 28Table 4.2 Specifications of measurement. 40
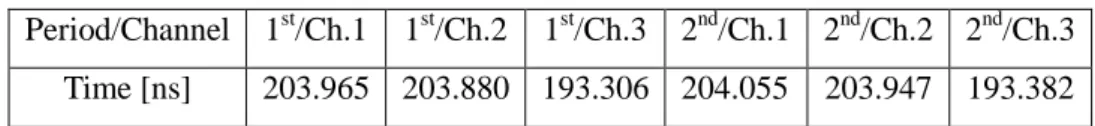
Table 4.3 Zero-distance delay times. 43
Table 4.4 Arrival time of the infiltrated water. 43
Chapter 5 Fluid Migration Modeling
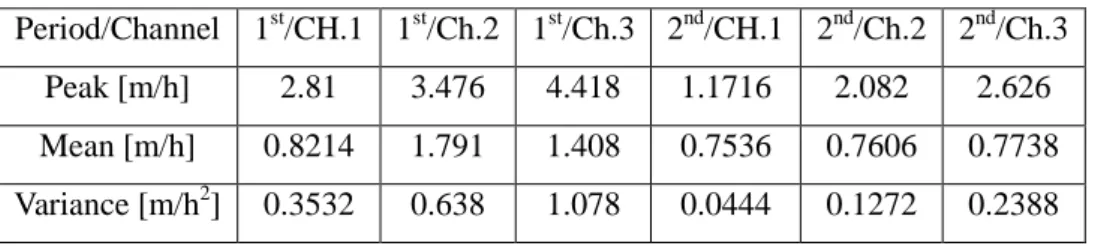
Table 5.1 Mean and variance values of infiltration velocity. 56
Chapter 1
Introduction
1.1 Background of the research
Radar application to monitoring of fluid migration in porous material
With the advancement of civilization, environmental monitoring has been developed and conducted to overcome natural disasters and acquire useful resources. In the lower level of civilization, people had prepared catastrophes and detected essential materials using primitive human senses and experiences like an eyesight, a hearing, and a simple statistics. However, measurement methods have been improved drastically with a progress of science since the industrial revolution. One of them is a radar measurement for environmental monitoring. Radar is an abbreviation word of “radio detection and ranging”, it means that radar was basically developed for detecting and ranging of target using electromagnetic waves. Radar was required to not only discriminate a target signal from a clutter signal but also estimate a size, a shape, and a material of target, because it is worked means of surveillance and reconnaissance for military purpose. After World War II ended, many advanced military technologies were transferred from exclusive defense research institutions and industries to civilian sectors. Radar was applied abilities of detecting and ranging to air traffic control, ship navigator, and altimeter. Environmental monitoring was also adapted radar for one of remote sensing methods.
In the preparation for preventing natural disasters, traditional environmental monitoring methods were sensed variations of circumstance directly by naked eyes and other senses. Thus observation range is restricted within short limits and observation accuracy is poor. However radar is observed indirectly using electromagnetic waves, observation range and accuracy are drastically increased. For instance, movement of clouds which is important to weather forecast is detected only line of sight by naked eyes. However radar can detect clouds theoretically almost 360 km distance between a cloud and a ground station, and even estimate volume and density of clouds which is measured by Doppler effect and reflectivity of electromagnetic waves. On the other hand, SAR (Synthetic Aperture Radar) is worked for environmental monitoring of the earth surface in the aerospace. Electromagnetic waves can penetrate obstacles like clouds in the troposphere, however visible ray used for optical methods is difficult to do that. Because visible ray has more high frequency than electromagnetic waves, thus its attenuation in vapor is also relatively large. SAR can provide target information like a position, an altitude, and a polarimetric characteristic. Those things help to set countermeasures deal with calamities.
9
leads to diminish R/P (Reserve/Production) ratio, we must prepare a resource crisis. A fundamental solution is a development of new substitute resources which are enhanced the efficiency and the convenience. However it takes a lot time and cost for research and practical use. Thus a realistic solution is an increasing reserve of resources by advanced surveillance technologies. One of them is GPR (Ground Penetrating Radar) which is geophysical and un-destructive method. It is worked in the subsurface that is different to general radar working place. GPR is adopted various techniques from other fields, because the subsurface consists of inhomogeneous and dispersive materials.
This thesis is focused on system design, measurement, and signal analysis for environmental monitoring by two different types of GPR.
Preliminary experiments of the hydraulic fracturing for enhancing extraction techniques of the methane hydrate
Most variation of strata structure in the subsurface is difficult to observe directly, thus we can only estimate phenomenon using data acquired by several remote sensing methods. However that analysis is based on physical approximations and hypotheses, sometimes it makes fatal errors in the realistic situation. When we establish a theory about the geology scientifically, obvious evidences must be presented. For example, numerical indicators like pressure and temperature, and remain traces like fracture and metamorphosis caused by variation of numerical indicators. However it is spent a lot of time and cost to excavating or boring, thus we conduct preliminary experiments using down-scaled specimens in the laboratory [1].
Methane hydrate is one of leading substances to substitute existing fossil fuels. Although people mentioned several alternative energies which are photovoltaics, wind and geothermal energies, and nuclear fusion power, there are critical weakness points to use general purpose. Operation time of photovoltaics, wind and geothermal energies are restricted by regional climate conditions and the topography. In the mobility and the storage of energy, photovoltaics are depended on electric and electronic devices like battery and regulator. Nuclear fusion power is required several revolutionary technologies to solve stabilization of fusion state which is under high temperature and pressure conditions. Expected accomplishment date of these technologies for commercial usage is at least 2050s. Consider our energy consumption and expected expire date of conventional energy sources, we cannot wait until 2050s. In these reasons, the development of the methane hydrate is being watched with keen interest.
Conventional extraction method has applied a spurt generated by spontaneous or artificial tectonic stresses. However extraction of the methane hydrate is relatively more difficult than conventional extraction for petroleum and natural gas, because methane hydrate reserved as solid form in the subsurface. Thus we must transform solid state of methane hydrate into liquid or gas states of methane hydrate using depressurization, thermal stimulation, and possibly solvent injection [2]. These methods
are required fractures in the subsurface to infiltrate decrease of pressure, heat, or solvent. In the production of methane hydrate, there are two roles of borehole. One is the injection borehole used a path of pressure, heat or solvent. Another is the production borehole used a path of dissolved or evaporated methane hydrate. Generally extraction methods for methane hydrate production are required artificial fractures to connect boreholes. Artificial fracture is also related the methane hydrate production. Hydraulic fracturing is commonly used to develop fracture in the energy extraction and the manufacture applications as shown in Fig.1.1. Principle of hydraulic fracturing in the consolidated rock which is tightly bound geologic formation composed of sandstone, limestone, granite, or other rock is well explained as a theory. On the other hands, there is no apparent an explanation about hydraulic fracturing of the unconsolidated rock that appears in the form of loose particles. It is difficult to increase methane hydrate extraction efficiency, because most methane hydrate reservoirs exist under the sea-bed which consists of unconsolidated rocks.
There are several geophysical measurement methods for geological investigation. However verification of measurement result is difficult, because we cannot access to geological site directly. For this reason, preliminary experiments using down-scaled specimens of the unconsolidated rock are conducted. The measurement result of hydraulic fracturing process in the specimen will be applied to enhance the extraction techniques of the methane hydrate.
Fig.1.1 Hydraulic fracturing for extraction of methane hydrate. (http://wastedenergy.net/2010/05/07/poofy-poofy/)
Borehole radar for monitoring of the subsurface water migration
Borehole radar is one of GPR methods to investigate deep subsurface circumstance especially. Surface-based GPR methods move transmitting and receiving antennas on the surface as shown as Fig.1.2, and express the 2-D or 3-D subsurface circumstance by signal and image processing. In this time, received signal consists of reflected wave generated from target, clutter, and surface. Even antennas mutual coupling called as direct wave also affects received signal. In view of an investigating area, surface-based GPR covers several types of land surface which is possible antenna
11
to contact to surface. Detecting range of surface-based GPR methods from surface to subsurface is restricted few meters by homogeneity and attenuation of subsurface circumstance and antenna characteristics and formation. On the other hand, antennas of borehole radar are inserted into tens or hundreds meters borehole. Detecting range of borehole radar from surface to subsurface is depended on a borehole length. Thus borehole radar has an advantage of deep subsurface investigation. There are two antenna insertion types of borehole radar. One is called as single-hole radar which transmitting and receiving antennas are inserted into single borehole as shown in Fig.1.3(a). Another is called as cross-hole radar which transmitting and receiving antennas are inserted into different boreholes respectively as shown in Fig.1.3(b). Detection coverage of single-hole radar is expressed as a cylinder, because dipole or cylindrical slot antennas commonly used for borehole radar have an omnidirectional radiation pattern. It means that received signal consists of reflected waves from different directions. Solving this problem, directional borehole radar which receiving antenna is adopted array structure to discriminate phase difference generated by distance from target to each array elements is devised [3]. On the other hand, detection coverage of hole radar is a cross-section between Tx antenna inserted borehole and Rx antenna inserted borehole as shown in Fig.1.3(b). It indicates that received signal consists of transmitted waves penetrated through transmission media between Tx and Rx antennas. Cross-hole radar has relatively small detection coverage, however it is the same meaning that received signal is less affected by reflected waves from clutters. And analysis of transmitted wave has more advantage to discriminate characteristics of a target, for instance a cavity filled with air or water, a dielectric material, and a conductor.
Monitoring of subsurface water around cellarage like nuclear waste disposal facility and SPR (Strategy Petroleum Reserve) storage is important to avoid environmental contamination and reduction of facility durability. Nuclear waste is discriminated three types by intensity of radioactivity. High level radioactive wastes like depleted nuclear fuel rod can be reprocessed. However it takes a lot of cost and only a few Uranium 235 is collected for nuclear fuel. Even a byproduct of reprocessing, Plutonium 239 is difficult to use a nuclear fuel and can be diverted to nuclear weapon. For this reason, reprocessing is restricted and controlled by IAEA (International Atomic Energy Agency). Most countries running nuclear power plants, high level radioactive wastes are kept in the cellarage semi-permanently. We know about a nightmare of Chernobyl nuclear power plant accident, these wastes should be isolated from our lebensraum immediately. Middle and low level nuclear wastes produced during operation of nuclear power plants are also required to isolate. These nuclear wastes are mixed with concrete and contained in stainless steel drums, then stored in the nuclear waste disposal facility as shown in Fig.1.4. Solidified nuclear wastes are difficult to leak from the nuclear waste disposal facility. Because the facility is surrounded by impermeable strata, subsurface water is hard to infiltrate into the facility and exude from the facility. It is also applied SPR storage to do same. SPR storage is discriminated two types by a place of storage. One is a ground-tank which has advantages to the
construction term and simplicity. However it has disadvantages to the safety, a cost of construction and maintenance, a natural attenuation. For this reason, massive SPR storage (≥Mbbl) is used to a salt cavern (or dome) or a constructed cavern. These caverns are connected to the ground by cargo-shipment pipe, thus a pressure of the inner cavern is lower than a tectonic stress of the circumference. For this reason, cavern is damaged and cracked by a geological process, reserved crude oil or petroleum products are difficult to evade from the cavern. Even subsurface water infiltrates into the cavern and works like oil-proof agent.
There are several requirements to select a site of nuclear waste disposal facility and SPR storage. For example, not only economical factors like accessibility to a port of shipment and a major consumption region but also safety factors like stability of bedrock and existence of earthquake and fault zone, even regional arrangement. Geophysical methods are applied to investigation related with safety factors. Especially, borehole radar is available to long-term survey of subsurface water system around site, because other geophysical methods are difficult to detect variation of subsurface water distribution. Radioactive methods can survey a flow network, however tracer used to track the localization of a specific compound affects the subsurface environment.
Tx Rx
13
(a) (b)
Fig.1.3 Performance with survey region of (a) single-hole radar (b) cross-hole radar.
Fig.1.4 Nuclear waste disposal facility.
Fig.1.5 SPR storage.
(http://www.reuters.com/article/idUSN2328108920070124)
1.2 Contents of dissertation
This research activity is concentrated on the development of GPR technique to monitoring fluid migration in porous material. There are two GPR techniques for different hydrogeological applications. One is the monitoring of preliminary experiment in the unconsolidated sand for the evaluation of hydraulic fracturing in the methane hydrate reservoir. Another is the monitoring of permeation experiment in the vadose zone for the estimation of migration model in the inhomogeneous media.
Chapter 1 is the introduction of GPR, and the thesis background and objective. Chapter 2 explains fluid migration in porous material which put on several conditions. Chapter 3 introduces measurement configurations applied to GPR experiments based on fluid migration in porous material. Specific signal processing methods are adopted each experiments in chapter 4. Chapter 5 suggests a migration modeling for verifying migration estimation. At final, the conclusion will be given in chapter 6.
15
Chapter 2
Principles of fluid migration in porous material
2.1 Fluid migration in unconsolidated sand
Preliminary experiment in the unconsolidated sand for the evaluation of hydraulic fracturing in the methane hydrate reservoir is conducted using a down-scaled specimen. The methane hydrate is a compound of methane and water under the specified pressure and temperature conditions as shown in Fig 2.1. It exists in the seabed sediment and under the arctic permafrost. Development mechanism of methane hydrate reservoir is different to conventional hydrocarbons. Methane is occurred in two ways. One is biogenic methane which is a byproduct of bacteria ingestion of organic material. Another is thermogenic methane which is a production of the combined action of pressure, temperature, and time on buried organic material. These methane migrate upwards due to its buoyancy relative to water, then change to methane hydrate at a place which satisfies the specified conditions. When methane hydrate fills the pores of sediment, it makes to reduce a permeability of sediment. It means that porous sediment turns into impermeable sediment, then works as a structural trap like salt dome.
Production method of methane hydrate is almost same to conventional hydrocarbons excavation. However additional techniques are required, because methane hydrate exists as a solid state. Hydraulic fracturing with depressurization, thermal stimulation or possibly solvent injection is designed to excavating methane hydrate efficiently. Evaluation of hydraulic fracturing in methane hydrate reservoir is difficult, because it is operated at several hundred meters below the seafloor. For this reason, down-scaled specimen is used a substitute for actual porous sediment.
During experiment, fracturing fluid selected single lubricant and mixed lubricants have different viscosities is used for hydraulic fracturing. When fracturing fluid is inserted steadily the same amount into a borehole, pressure of inner borehole is increased. Because fracturing fluid permeating into a specimen is difficult until an emission pressure of fracturing fluid reaches to breakdown which is a start-state to generate a fracture and to infiltrate fracturing fluid into a specimen [4]. After breakdown is occurred, fracture extends to a direction of the least horizontal stress, then fracturing fluid infiltrates into a specimen through a fracture corridor. There are three phases which are water, air, and fracturing fluid in a specimen. Fluid migration in a specimen indicates that variation of fluid movement and distribution by fluid dynamics and chemical reactions between these phases [5]. Small droplets of fracturing fluid invade into air occupied pores of specimen by pressure of fracturing fluid. At that time, an area with fracturing fluid occupied pores is called an infiltrated region. Air in an infiltrated region is pushed out of its own position, and then compressed to neighbor air occupied pores. In high pressure state, some compositions of air, especially oxygen, are easily dissolved in water. For that
reason, air migration from an infiltrated region to another region is less effect to a material distribution in a specimen. Water occupied pores are also invaded by fracturing fluid. Water droplets in an infiltrated region are migrated to pores in another region. At that time, water does not mix with fracturing fluid, and a volume of water is almost same even in high pressure state. Thus water migration from an infiltrated region to another region is quietly affected a material distribution in a specimen. Remain question is how to distribute fracturing fluid and water in a specimen during experiment. It will be mentioned in Chapter 5. Migration of fracturing fluid into a specimen makes to decrease an emission pressure of fracturing fluid. When an emission pressure of fracturing fluid is below the largest horizontal stress, a fracture generating is stopped and a fracture corridor is closed. It means that fracturing fluid cannot infiltrate into a specimen. After an experiment is finished, a specimen is cut horizontally or vertically to look at its cross-section, and then a fracture and an infiltrated region are determined as shown in Fig.2.2. Compare variation of an emission pressure of fracturing fluid with formation of a fracture and distribution of an infiltrated region, mechanism of hydraulic fracturing in the unconsolidated sand will be discovered. However, it is a fragmentary analysis, because there are no information about a fracture generation and an infiltrated region expansion during experiment.
Fig.2.1 Methane hydrate phases.
(http://www.netl.doe.gov/technologies/oil-gas/futuresupply/methanehydrates/about-hydrates/conditions.htm)
17
Fig.2.2 Cross-section of specimen.
2.2 Water migration in subsurface
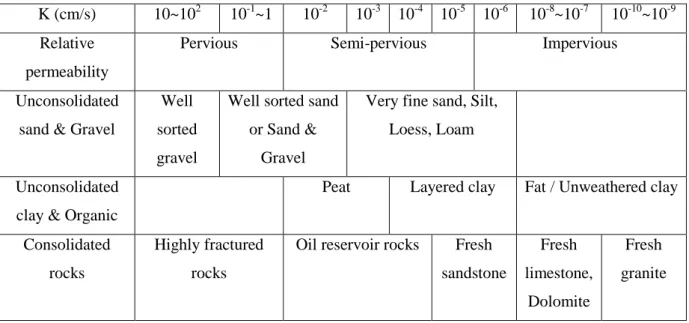
Monitoring of the subsurface water migration for decision and surveillance a site of cellarage like nuclear waste disposal facility and SPR is conducted. Subsurface consists of substances which have different physical and chemical characteristics. There are several factors to affect these characteristics. One is a surface environment with different geographical positions. Climate like precipitation and temperature makes disintegration to the surface of the earth, and its phenomenon also affects the subsurface. Especially, short-term material migration is occurred through groundwater flow system. Another is a subsurface environment with different geological positions. Metamorphism by extremely high pressure and temperature varies subsurface materials physically and chemically. And long-term material migration like a diastrophism is happened by mantle convection. For several reasons, subsurface is generally an inhomogeneous media. It means that the subsurface water migration is an irregular flow and diffusion. There are several water migration models. These models estimate phenomena by microscopic-scale or macroscopic-scale approximations. Fundamental source of water dynamics is gravity. It means that water is forced to downside, except some special case like spring-water. When water is poured over the surface of the earth, it will start to infiltrate into the surface. This infiltration is related on the hydraulic conductivity of the material. Porosity and permeability of the material are affected to the evaluation of the hydraulic conductivity [6]. Relation between hydraulic conductivity and material characteristics is shown in Table 2.1. For example, solid granite itself has very poor porosity. Thus it is connected to low hydraulic conductivity. However if solid granite is highly fractured, its hydraulic conductivity is increased. Water contained or containable layer called the aquifer can be divided into two layers; confined and unconfined. Confined
aquifer underlies a confining layer which is a bed of low permeability called aquitard or an impermeable area called aquiclude. Amount of contained water in confined aquifer is conserved, but its quantity is very low. On the other hand, unconfined aquifer contains large quantity of water, but its amount of contained water is changed. Even position of unconfined aquifer is variable, because unconfined aquifer underlies water table. Thus a vestige of water migration is clearly investigated only at the unconfined aquifer and the unsaturated layer called vadose zone which exists above water table in nature. It will help to select a site of cellarage at unconfined aquifer or impermeable area especially. When a facility site is under construction, this artificial activity affects to groundwater flow system. At that reason, monitoring of the subsurface water migration is required.
Table 2.1 Saturated hydraulic conductivity (K) values found in nature.
K (cm/s) 10~102 10-1~1 10-2 10-3 10-4 10-5 10-6 10-8~10-7 10-10~10-9 Relative
permeability
Pervious Semi-pervious Impervious
Unconsolidated sand & Gravel
Well sorted gravel
Well sorted sand or Sand &
Gravel
Very fine sand, Silt, Loess, Loam
Unconsolidated clay & Organic
Peat Layered clay Fat / Unweathered clay
Consolidated rocks
Highly fractured rocks
Oil reservoir rocks Fresh sandstone Fresh limestone, Dolomite Fresh granite
19
Chapter 3
Configuration of GPR Measurements
3.1 Measurement of fluid migration
There are several geophysical measurement methods for exploration in the subsurface. Seismic methods, geodesy and gravity techniques, magnetic and electrical techniques, electromagnetic methods, and well logging are used for measuring parameters to define a material. Consider the experiment conditions mentioned in Chapter 2, transmission media is unconsolidated sand and blocked by metal plates. Unconsolidated sand is a porous material and its density is relatively lower than consolidated rocks. High density of material is proportional to high velocity of seismic wave. These factors affect to Q (Quality factor) which is an inverse value of an attenuation factor. Generally, low Q of transmission media corresponds to high porosity and low velocity in the seismic methods. Thus seismic wave in unconsolidated sand suffers from high intrinsic attenuation, and it leads to poor SNR (Signal to Noise Ratio). It is the same manner to acoustic and ultrasonic wave. Size of a specimen is relatively small to apply magnetic and electrical techniques, because a resolution of these techniques is poor to detect an area of fluid migrated region. Deployment of instruments which compress a specimen interrupts to conduct radioactive techniques. Consider SNR, resolution, and deployment of experiment, the most adequate geophysical measurement method in unconsolidated sand is an electromagnetic method. GPR is one of electromagnetic methods for geophysical measurement. Preparation, procedure, and methodology of GPR measurement are mentioned after sections.
3.1.1 Characteristics of the host material
The specimen consists of Tohoku silica, Kaolinite flour, and the distilled water. These materials are uniformly distributed into the mold and taken into a concrete hexahedron form by the exterior pressure. The completed specimen has almost 11 % volumetric moisture content and around 28 % porosity. These parameters cannot be directly measured by electromagnetic methods. Electromagnetic parameters of material are electric permittivity (𝜀 ), magnetic permeability (𝜇 ), and electrical conductivity (𝜎). Dominant electromagnetic parameter affected by volumetric moisture content and porosity of material is electric permittivity. When electromagnetic wave is propagating in medium, its velocity is depended on electric permittivity of medium as
𝑣 = 𝑐
𝜀𝑟 (3-1) where 𝑐 is the speed of light, 𝜀𝑟 is the relative permittivity of medium.
Acquiring electric permittivity of unconsolidated sand, antennas are inserted into a specimen. These antennas are connected to a calibrated VNA (Vector Network Analyzer) measurement system, and electromagnetic wave propagates in a specimen. Then VNA provides a travel time of propagating wave in a specimen in Fig. 3.1. The relative permittivity of medium is derived from a given equation as
𝜀𝑟 = 𝑐 𝑇𝑝−𝑇𝑑 𝑎 2
≅ 5.93 (3-2) where 𝑇𝑝 is a travel time of propagating wave, 𝑇𝑎 is a measured travel time in antennas, 𝑑 is a
distance between antennas.
Then using the Topp’s equation with acquired the relative permittivity of medium, volumetric moisture content of medium is estimated [7] as
𝜀𝑟 = 3.03 + 9.3𝜃𝑣+ 146𝜃𝑣2− 76.7𝜃𝑣3→ 𝜃𝑣≅ 11.5 % (3-3)
where 𝜃𝑣 is the volumetric moisture content of medium.
Thus a suggested volumetric moisture content value is well estimated to a calculated volumetric moisture content value. It means that relation between the relative permittivity and volumetric moisture content in unconsolidated sand is followed to Topp’s equation.
Fig.3.1 Waveform of received signal.
3.1.2 Characteristics of fracture fluid
Hydraulic fracturing was conducted by using Vitrea and Tellus (Synthetic lubricants, Shell). And red ink was used for visualizing the fracture. The required viscosity of a fracturing fluid is acquired by changing the ration of Vitrea and Tellus. The viscosity of Vitrea is larger than that of Tellus. Thus the
21
infiltration of Vitrea into the specimen is more difficult in comparison with Tellus. At that reason, Vitrea exists around near area of the developed fracture. On the other hand, Tellus spreads to farther area from the developed fracture. Although the particle size of red ink is relatively larger than the pore size of the specimen, its penetration from the fracture to the specimen is difficult. Hence red ink remains only in the fracture. The remained red ink in the fracture is useful for confirming the trace of the fracture. For measuring travel time of propagating wave in the each lubricant, a box is filled with each lubricant and attached antennas to face each other as shown in Fig. 3.2. The measured relative permittivity of Vitrea and Tellus are 2.13 and 2.19 using previous mentioned the same manner at 3.1.1. It implies that the electromagnetic characteristics of Vitrea and Tellus are almost same.
Fig.3.2 Fracturing fluid in a box to acquire its electric permittivity.
3.1.3 Method of hydraulic fracturing
In nature, tectonic stresses are put on the subsurface in all directions, and have relatively small difference between horizontal stresses except fault zone. Like that, specimen is also pressurized by compressors during experiment. Vertical stress (𝜎𝑣) and the largest horizontal stress (𝜎𝐻) are set to 2 MPa, and the least horizontal stress (𝜎) is set to 1 MPa as shown in Fig. 3.3. Then a borehole with slit is inserted into specimen vertically. At that time, slit is toward to the largest horizontal stress. Total volume of specimen is conserved during injection of fracturing fluid, because a specimen is pressurized by compressor and blocked by metal plates.
When fracturing fluid is inserted steadily the same amount into a borehole, pressure of inner borehole is increased. Geologist estimates that fracturing fluid permeating into a specimen is difficult until an emission pressure of fracturing fluid reaches to breakdown which is a start-state to generate a fracture and to infiltrate fracturing fluid into a specimen. After breakdown is occurred, fracture extends to a direction of the least horizontal stress, then fracturing fluid infiltrates into a specimen through a fracture corridor. After an experiment is finished, a specimen is cut horizontally or vertically to look at
its cross-section, and then a fracture and an infiltrated region are determined.
Fig.3.3 Test specimen for hydraulic fracturing.
3.1.4 Measurement system configuration
There are two typical GPR data acquisition methods. One is the time domain method using a pulse generator and an oscilloscope. The other is the frequency domain acquisition method using a VNA. The time domain acquisition method is able to fast signal acquisition, however its waveform may be unstable due to some jitters inherent in pulse generator. And sampling rate of oscilloscope affected upper boundary of frequency band is restricted to low value. Observation result of pulse generator signal is shown in Fig. 3.4. System delay is gradually decreased and does not stabilize. In contrast, the frequency domain acquisition is more stable because of its high SNR, but the data acquisition rate is relatively slow. In this experiment, the most important measurement value is the arrival time of receiving signal, because a propagation velocity corresponds to the formation of fracture and the infiltrated region on the propagating wave path.
In measurement system design, there are two requirement factors. One is the high spatial resolution. The fracture itself has a small aperture (≤ 1 mm) even in the open fracture condition when the pressure of the fracturing fluid (𝜎𝑓) is greater than the tectonic stress (𝜎𝐻). Thus an existence of fracture in the specimen using GPR measurement is not detected directly. However the expansion of the infiltrated region which fills with the fracturing fluid is detected by a variation of travel time at each propagation path. Based on the distribution of the infiltrated region, a formation of the fracture is estimated. Detection of this variation is required high spatial resolution. The other required factor is the acquisition rate. The pressure of a fracturing fluid varies drastically around breakdown pressure which is the peak pressure of a fracturing fluid, then the fracture may extend from the borehole in the direction of maximum horizontal tectonic stress (𝜎𝐻) and fracturing fluid infiltrated to outward around
23
the generated fracture. Since all of the above progress happens during a short time, its acquisition rate must be fast.
Fig.3.4 Observation result of pulse generator signal.
3.1.5 Vivaldi array antenna
Vivaldi antenna is a kind of twin-line UWB (Ultra Wide Band) antenna which has relatively high-gain and linearly polarization [8]. It has a wide frequency band, and its gain is stable with frequency varied. A single Vivaldi antenna element is designed and analyzed, and then arranged Vivaldi array antenna. It is used as transmitting and receiving antenna of 4x4 multi-static GPR for distribution measurement in the specimen. That antennas configuration is able to MIMO (Multiple Input Multiple Output) technique which helps to define characterizations of overlapped section of wave propagating paths, however 4x4 propagating wave paths are not enough to make a precise tomography of a fracture and the infiltrated region. Within several types of Vivaldi antenna, antipodal Vivaldi antenna is selected, because it is easy to fabricate metal patches and a feed. Vivaldi antenna element and Vivaldi array antenna are designed and produced. Those antennas are optimized by FDTD (Finite Difference Time Domain) simulation. Then the measurement and the simulation results are compared.
Vivaldi antenna element consists of two symmetrical metal patches which are confronted each other on the substrate [9], however feed of metal plates is different. Front and back side feed of metal plate has 1 mm and 7 mm width as shown in Fig. 3.5(a) and (b), because soldering connection between antenna and feeder must be strengthened. When antenna is inserted into the specimen, hand pumps give high pressure (2 ~ 3 MPa) to the specimen through metal plates. If antenna which has an optimized return loss in the operating frequency band (1 ~ 6 GHz) is considered, width of front and
back side feed is reduced. It leads that junction between antenna and feeder is easy to break. At that reason, return loss of Vivaldi antenna element is poor especially low frequency band in Fig. 3.6(b). Radiation pattern of H-plane is almost isotropic, but radiation pattern of E-plane has directivity to front and back side in Fig. 3.7(a) and (b).
Improving return loss at low frequency band and satisfying a requirement about antenna size, metal patches of Vivaldi array antenna are connected each other directly in Fig. 3.5(c) and (d) [10]. Length of metal patches is increased twice, however metal patches of port 1 and 4 are different each other. It makes an unbalance surface current. Neighbor ports are connected by metal patch. Its ends are connected inner conductor and ground of feeder. However mutual coupling is low, because ports of Vivaldi antenna array are connected with a switch driver which has enough isolation to do not interfere with each other in the operating frequency band. Increasing length of metal patches, electrical current of low frequency flows easier on the surface of metal patches. Thus it has a relatively good performance at low frequency in Fig. 3.6(a). Basically, radiation patterns of Vivaldi antenna element and Vivaldi array antenna are almost same, but E-plane of port 1 and 4 of Vivaldi array antenna is different because of its formation of metal patch in Fig. 3.7(a) and (b).
(a) (b)
(c) (d)
Fig.3.5 Vivaldi antenna element (a) Front side (b) Back side, Vivaldi array antenna (c) Front side (d) Back side, Unit = mm.
25
(a) (b)
Fig.3.6 Return losses of Vivaldi antenna element and Vivaldi array antenna (a) Measurement (b) Simulation.
-30 -20 -10 0 0 30 60 90 120 150 180 210 240 270 300 330 -30 -20 -10 0 Single port 1 Array port 1 Array port 2 -30 -20 -10 0 0 30 60 90 120 150 180 210 240 270 300 330 -30 -20 -10 0 Single port 1 Array port 1 Array port 2 (a) (b) -30 -20 -10 0 0 30 60 90 120 150 180 210 240 270 300 330 -30 -20 -10 0 Single port 1 Array port 1 Array port 2 -30 -20 -10 0 0 30 60 90 120 150 180 210 240 270 300 330 -30 -20 -10 0 Single port 1 Array port 1 Array port 2 (c) (d)
Fig.3.7 Radiation patterns of Vivaldi antenna element and Vivaldi array antenna at 3 GHz (a) H-plane (Measurement) (b) E-plane (Measurement) (c) H-plane (Simulation) (d) E-plane
3.2 Measurement of water migration in Vadose zone
Acquiring the moisture content distribution, there are several methods like TDR (Time Domain Reflectometer) and Tensiometer used to measure volumetric moisture content. However these methods are restricted an application range within 1 m. Borehole radar is conducted deep-site surveillance, because the transmitting and the receiving antenna can be existed to deep-site through borehole. Compare with GPR (Ground Penetrating Radar) which has a measurement mechanism same as borehole radar, it has only few meter depth surveillance capability. It is a reason that the position of the transmitting and the receiving antenna is existed only on the ground surface.
Many papers were published to relate the monitoring of moisture content distribution [11] and water table level [12], however these papers proposed a measurement result elicited by ZOP (Zero-Offset Profiling) at specified depths. It means that acquired data provide only average value of volumetric moisture content with depth. Consider that water diffusion is an irreciprocal phenomenon in the subsurface, volumetric moisture content must be acquired to each specified positions.
3.2.1 Characteristics of Vadose zone
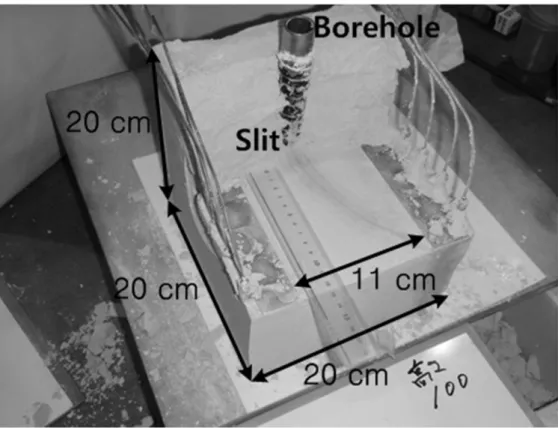
Measurement to monitoring of water migration in Vadose zone is conducted to Kanaya, Sizuoka, Japan. Experiment site exists in NIVTS (National Institute of Vegetables and Tea Science) laboratory as shown in Fig. 3.8(a). This area is a part of Makinohara-Daichi which consists of diluvial plateau. In a rough way, its soil has good drain characteristic. At that reason, this place is famous for the largest production site of green tea in Japan. The regolith covers with andosols and yellow soil, and sandy gravel bed layer exists under the regolith. Capillary fringe exists between sandy gravel bed layer and water table. Vadose zone consists of regolith, sandy gravel bed layer, and capillary fringe.
In the experiment, the regolith is removed, and then sandy gravel bed layer is exposed to the outside. Because the regolith has relatively poor drain characteristic than others, it makes difficult to measure equilibrium water content corresponded with inflow of water in sandy gravel bed layer.
3.2.2 Characteristics of migrated water
When water is infiltrated into the subsurface, electromagnetic characteristics of wave propagating path in the subsurface are changed. The subsurface water exists not only on a type of mixture, but also on a type of compound. Electric permittivity of the subsurface water is depended on a ratio of mixture. Volumetric moisture content is one of good indicator to explain a relation water migration with electric permittivity. However when water migrates in the subsurface, water is irregularly distributed. It means that each unit area of the subsurface has different volumetric moisture content. At that reason, the estimation of volumetric moisture content derived from a measured travel time of wave propagating path in the subsurface is indicated an averaged value. Electrical conductivity of absolute
27
pure water which consists of only H2O molecules has 5.5 μS/m. However migrated water into the subsurface dissolves minerals like salinities, then its electrical conductivity is drastically increased to 0.05 ~ 0.5 S/m. Especially, migrated the subsurface water exposed excessive fertilizer has relatively high electrical conductivity. Attenuation of travel wave in the subsurface is affected by its electrical conductivity.
(a)
(c) Ch.2 sensor head Receiver Transmitter E5071B VNA Optical out Down link (地上部) RF in Optical in RF out Down link (Ant)
Optical in OEFS-CII-(10GHz)-ST RF out Rx 1 Tx Rx 2 Rx 3 RF in Optical out Ch.3 sensor head RF in Optical out RF in Optical out Ch.1 sensor head Subsurface (d)
Fig.3.8 Borehole radar experiment
29
3.2.3 Method of water injection
Water is selected a tap water which has relatively low salinity. Thus electrical conductivity of injected water is estimated to have a low value. Artificial increment of water salinity is achieved by an insertion of additional agent like sodium chloride into flowing water. However artificial control of water salinity is not conducted, because electrical conductivity of migrated water is not deterministically related to volumetric moisture content.
When water is poured into a pit, its flow rate per unit area is expressed as 𝐶 =𝑄
𝐴=
1.65 𝑚3/
1.62 𝑚2 = 1085 𝑚𝑚/ (3-4) where 𝑄 is volumetric flow rate of injected water, 𝐴 is an area of pit.
Water injection is continued 90 minutes, thus amount of total injected water is 2475 L. This experiment condition is not existence in nature. However it will help to acquire equilibrium water content which indicates a balanced flow state.
3.2.4 Measurement system configuration
Measurement system diagram is show in Fig. 4.8(b). An operating frequency of measurement system is selected by composition of the subsurface materials, because an attenuation of transmission media is drastically increased in proportion to frequency increment. Although operating frequency band must be as low as possible, measurement system must have wide frequency bandwidth. It makes to improve a time resolution which is able to discriminate multiple-path waves. SNR is important parameter in this measurement system, because transmission media in the subsurface affects amplitude and delay of travel wave.
Frequency bandwidth is only variable parameter in the measurement operation, its value is changed by IF (Intermediate Frequency) bandwidth of VNA. For improving SNR, IF bandwidth must be reduced. Improvement of SNR and processing velocity are a trade-off relation. In this experiment, acquisition time is less important, because water migration velocity is relatively slow within detectable variation range. Thus measurement system configuration is pursued high dynamic range to acquire high SNR.
3.2.5 Dipole array antenna
As mentioned earlier at 3.2, 1-D (Dimensional) measurement like ZOP is not sufficient to acquire horizontal moisture content distribution. It means that an inclination angle of migrated the subsurface water is not derived. At that reason, receiving antenna is adopted array deployment to measure an inclination tendency of the moisture content distribution. Typical borehole radar adopts dipole antenna, because an inserted antenna should be considered the borehole structure restrictions. Representative
structural parameter affected antenna characteristics are length of antenna. Its value is not limited by borehole structure and decides resonance frequency of dipole antenna as
𝑓𝑐 ≈2𝑙 𝑐
𝑒𝑓𝑓 𝜀𝑟 (3-5) where 𝑙𝑒𝑓𝑓 is an effective length of dipole antenna, 𝜀𝑟 is a relative permittivity of surrounding
media.
This experiment adopts a cylindrical dipole antenna for transmitting antenna, and rod-type dipole antennas for receiving array antenna as shown in Fig. 3.9 (a) and (b). Basically, these antennas have resonance frequencies corresponded to lengths of antenna. However acceptable bandwidth of antennas defined its return loss (Usually ≤-10 dB) is different, because its value is dominantly depended on the l/d ratio. The evaluation of acceptable bandwidth is expressed as
𝑓𝑢𝑝𝑝𝑒𝑟−𝑓𝑙𝑜𝑤𝑒𝑟
𝑓𝑐 × 100 % (3-6) where 𝑓𝑢𝑝𝑝𝑒𝑟 is a upper boundary frequency of bandwidth (≤-10 dB), 𝑓𝑙𝑜𝑤𝑒𝑟 is a lower boundary
frequency of bandwidth (≤-10 dB), 𝑓𝑐 is a center frequency.
Generally, diameter of antenna and input impedance of antenna are inverse proportion relation at fixed length of antenna. And feeder of cylindrical dipole antenna has tapered structure. Thus cylindrical dipole antenna has larger acceptable bandwidth than rod-type dipole antenna in Fig. 3.10.
These antennas are inserted into sondes which protect antenna from ground water and outthrust of borehole. At that time, deployment of antenna array elements is 1 m spacing between antenna feeders vertically. Consider radiation pattern of dipole antenna in Fig. 3.11, mutual coupling between antenna array elements does not strongly affect each other.
(a) (b)
31
Fig.3.10 Return loss of dipole antennas.
-40 -20 0 0 30 60 90 120 150 180 210 240 270 300 330 -40 -20 0 80 MHz 150 MHz 200 MHz -40 -20 0 0 30 60 90 120 150 180 210 240 270 300 330 -40 -20 0 80 MHz 150 MHz 200 MHz (a) (b) Fig.3.11 Radiation pattern of a dipole antenna (E-plane) (a) Cylindrical dipole antenna (b) Rod-type dipole antenna.
3.2.6 Optical link system
In this experiment, antennas are connected measurement instruments by optical link system as shown in Fig. 3.12 (a) and (b). Optical link system is divided two conversion modules converted electrical signals to optical signals and vice versa. Compare with electrical transmission, optical transmission has better performances which are attenuation and dispersion of transmitted signals. And optical fiber cable consists of dielectric materials. At that reasons, it is difficult to radiate any waves from optical fiber cable to the subsurface.
Before conduct field experiment, performance of an optical down link and an optical sensor must be tested. Measuring above mentioned things, the operating frequency is selected to 30 kHz ~ 1 GHz. An optical down link has almost 70 dB amplified gain and flatness within 700 MHz in Fig. 3.13(a). An optical sensor has almost 5 dB amplified gain and flatness given frequency band in Fig. 3.13(b). Thus
our measurement system provides almost 75 dB amplified gain and flatness within 700 MHz.
Signal transmission of optical link system is nonreciprocal, because it is not equipped optical duplexers. Thus calibration of measurement system is incomplete, because VNA cannot conduct full 2 ports calibration. In the addition, optical sensors have no 50 Ω connectors. At that reason, only RF parts of measurement system is calibrated. Although optical link system is not calibrated directly, there is a method to calibrate optical link system indirectly.
Fig.3.12 Optical link system (a) Down link (Antenna) (b) An optical probe.
(a) (b)
Fig.3.13 Power spectrum of optical link system with attenuation (a) Optical down link (b) Optical probe.
3.2.7 Evaluation of measurement system
Using optical link system, transmission measurement of dipole antennas is conducted in an anechoic chamber. At that time, a junction between optical link system and dipole antenna should be inserted attenuator, because reflection is occurred at a junction. Strong reflection makes a ringing which is unwanted oscillated signals. Attenuator connected at junction reduces reflected signal power.
Measurement result is well matched to simulation result in Fig. 3.14. Even distortion and attenuation of signal is reduced using optical link system, significant frequency band is restricted within 80 MHz
33
~ 500 MHz. However previous frequency band covers frequency range for borehole radar, there is no problem to adopt dipole antennas with optical link system to borehole radar.
Chapter 4
Experiments
4.1 Monitoring of fluid migration in a sand specimen
Comparing the actual formations of the fracture and the infiltrated region with the pressure of fracturing fluid, the extension of the fracture is verified indirectly. At the same time, a diffusion of the fracturing fluid and a condensation of the moisture are measured. When the fracturing fluid infiltrated into the specimen, the fracturing fluid invaded not only to the empty pore but also to the pore which is occupied by the moisture. Hence the moisture is forced out and moves to the empty pore near the outer boundary of the region. It may be possible to understand the relation between the pressure of the fracturing fluid and the formation of the fracture in real time.
One of important factors on improving the production efficiency of these methods may be how to survey the formation of the fracture and the infiltrated region [13]. However, a preliminary hydraulic fracturing experiment in the laboratory using down-scaled specimen is not easy to determine the real-time development of fracture and the infiltration of fracturing fluid due to the variation of fracturing fluid pressure in borehole. It is possible to observe the formation of fracture and the infiltrated region only after cutting the section of the specimen as shown in Fig. 4.1.
As a detour, the GPR measurement system provides the variation of the travel time of received electromagnetic signals. Hence these signals make it possible to observe the real-time development of a fracture. And this method may be applied to monitoring the formation of a fracture and the infiltrated region for methane hydrates. Finally this method renders it possible to survey the fracture development for geothermal power generation and the exploitation of ground water.
For the experiment about monitoring the formation of fracture and the infiltrated region in the laboratory, a down-scaled specimen is used and an appropriate measurement technique is prepared [14]. Compared to actual subsurface reservoir, the specimen is small. GPR is a good technique for this experiment because of its relatively high frequency and wide frequency bandwidth. It means that GPR has a relatively superior time resolution than other geophysical applications. To obtain the reliable variation of the arrival time which corresponds to the formation of fracture and the infiltrated region on the propagating wave path. In this reason, the frequency domain acquisition methods are applied to this experiment. Specifications of measurement are listed in Table 4.1.
35
Fig.4.1 Inner structure of specimen.
Table 4.1 Specifications of measurement.
Specification Value Remark
Frequency 300 kHz ~ 6 GHz Operation
Number of points 201 -
IF bandwidth 100 Hz -
Acquisition time 0.72 sec A propagating wave path
Injecting rate 30 ml/min Fracturing fluid
Viscosity 1700 mPa∙s, 300 mPa∙s Single (Vitrea), Mixed (Vitrea with Tellus)
Porosity 28 % Specimen
Volumetric moisture content 11 % Specimen
4.1.1 Experiment results
Hydraulic fracturing experiments using down-scaled specimen are conducted many times. Early experiments are conducted to evaluate measurement systems and antenna deployments. For example, several experiments are tried to find a proper data acquisition time satisfied both data quality and tracking of media variation at the same time. On the other hand, time domain measurement using pulse generator and oscilloscope is attempted. Based on the results of these preliminary experiments, controlled measurement circumstance to acquire effective and well-directed data is prepared.
the homogeneity of transmission media and the reciprocity of measurement system, signals acquired by simplex method are enough to represent whole acquirable signals. At that result, 16 propagating wave paths are selected, and then classified 4 types by its distance. At the same reason, acquired travel times corresponded each propagating wave path are compensated with initial travel time represented initial state, because that will be skip over system calibration which occupies a considerable portion of acquisition time.
The configuration of measurement system is set as show in Fig. 4.2. The synchronization of acquisition data which pressure of fracturing fluid and travel times is important to examine relation between pressure of fracturing fluid and the fluid migration with the fracture generation.
Oil
Pump
Measurement
instruments
Specimen
Fig.4.2 Configuration of measurement system.
Experiment with Mixed fracturing fluid (Vitrea and Tellus)
After the fracturing fluid is pressurized in Fig. 4.3, a fracture and infiltrated regions at the experiment finished state are determined by cutting a specimen as shown in Fig. 4.4. At that time, 4 classified propagating wave paths are arranged by schematic diagrams as shown in Fig 4.5(a)-(d). When the pressure of fracturing fluid is increased until reached to breakdown, there is no meaningful variation of the travel time in Fig. 4.6(a)-(d). After the breakdown, the pressure of the fracturing fluid is decreased abruptly and then stabilized. The stabilized pumping pressure is called the fracture propagation pressure. At the same time, the fracture grows in the forward direction, and the fracturing fluid is also infiltrated into the specimen through the developed fracture path [15]. At that
37
Fig.4.3 Pressure of mixed fracturing fluid.
Fig.4.4 Cross-section of specimen.
time, the travel time of each propagating wave path is changed drastically. One of interesting features is that the variation of the travel time of each propagating wave path may be categorized into two groups. One group shows the velocity of propagating wave to be accelerated like T51 and T62 in Fig. 4.6(a). In contrast, the other group suffers from reducing the velocity of the propagating wave like T73 and T84 in Fig. 4.6(a).
The arrival times corresponding to each propagating wave path are well matched to the sequence of the propagating wave path close to the borehole, because the infiltrated region is expanded across area
5 6 7 8 1 2 3 4 Tx antenna Rx antenna Borehole h 5 6 7 8 1 2 3 4 Tx antenna Rx antenna Borehole (a) (b) 5 6 7 8 1 2 3 4 Tx antenna Rx antenna Borehole 5 6 7 8 1 2 3 4 Tx antenna Rx antenna Borehole (c) (d)
Fig.4.5 Schematic diagrams of propagating wave paths which have a distance (a) 11 cm (b) 11.40 cm (c) 12.53 cm (d) 14.21 cm.
39
(b)
(c)
(d)
Fig.4.6 Travel times to propagating wave paths which have a distance (a) 11 cm (b) 11.40 cm (c) 12.53 cm (d) 14.21 cm.
Fig.4.7 Arrival time of the infiltrated region.
between antennas and propagating wave paths are represented as simple closed curves. Developing velocity of the infiltrated region is inversely proportional to distance h from the borehole to contact intersection of the infiltrated region and the propagating wave path in Fig. 4.7. Although flow rate of the fracturing fluid is maintained a constant value, boundary of infiltrated region is increased. Thus relative compressed power to outer boundary of infiltrated region is decreased. Compare Fig. 4.3 with Fig. 4.7, it is also explained by the relation between pressure of fracture fluid and arrival time of fracturing fluid.
When the pumping is stopped, the pressure of the fracturing fluid decreases and soon becomes lowers than the tectonic stress. At that time, there are no developing of the fracture and infiltrating into the fracturing fluid, because the fracture does not maintain the open state and turns into the close state. Thus the variation of the travel time does not exist in Fig. 4.6(a)-(d). The relative permittivity of the fracturing fluid is lower than that of the specimen. Considering the whole travel times of the propagating wave paths, the tendency of the travel times depends on the closeness from the borehole. The propagating wave path close to the borehole provides a strong downward tendency. It implies that the propagating wave velocity is increased. On the other hand, the propagating wave path stayed away from the silt, its tendency shows in the upward direction. Considering only the existence of the fracturing fluid, this upward tendency is physically impossible. This abnormal phenomenon can be explained if the relative permittivity of the infiltrated region increases. Additional explanation is mentioned to Chapter 5.
41
Experiment with Single fracturing fluid (Vitrea only)
To observe more apparent the development of fracture, an experiment with single fracturing fluid (Vitrea) is conducted. Compare the pressure of fracturing fluid with previous data in Fig. 4.3, even experiment is conducted to the same conditions, high viscosity characteristic of the fracturing fluid makes to increase the breakdown pressure 6 MPa to 8 MPa and reduce the fracturing time 520 seconds to 210 seconds in Fig. 4.8. It means that the generation of fracture using high viscosity fracturing fluid is required high initial pressure, but the expansion velocity of fracture is increased. Because of its own viscosity characteristic, infiltrated region is restricted within near fracture as shown in Fig. 4.9. At that time, 4 classified propagating wave paths are arranged by schematic diagrams as shown in Fig. 4.10(a)-(d). When the pressure of fracturing fluid is increased until reached to breakdown, there is no meaningful variation of the travel time in Fig. 4.11(a)-(d). Fundamentally, the direction of fracture generation is decided a low pressure area around the end of fracture. Given the exterior tectonic stress condition is enforced to whole specimen surface uniformly, fracture is generated straightforward as shown in Fig. 4.4. On the other hand, the direction of fracture generation is varied as shown in Fig. 4.9. It affects the pressure of fracturing fluid to increase during the fracturing. This phenomenon can be seen after 280 seconds from experiment start as shown in Fig. 4.8. When the direction of fracture generation is tilted, front surface of fracture formed to breakthrough specimen is enlarged. It makes to increase a pressure for fracturing. Thus the pumping is stopped, even the pressure of fracturing fluid is not approached to 𝜎𝐻 (=2 MPa). At that time, the variation of
the travel time of each propagating wave path is also categorized into two groups. One group shows the velocity of propagating wave to be accelerated like T51 in Fig. 4.11(a). In contrast, the other group suffers from reducing the velocity of the propagating wave like T62, T73, and T84 in Fig. 4.11(a). The
Fig.4.9 Cross-section of specimen. Borehole 5 6 7 8 1 2 3 4 Tx antenna Rx antenna h Borehole 5 6 7 8 1 2 3 4 Tx antenna Rx antenna (a) (b) Borehole 5 6 7 8 1 2 3 4 Tx antenna Rx antenna Borehole 5 6 7 8 1 2 3 4 Tx antenna Rx antenna (c) (d)
Fig.4.10 Schematic diagrams of propagating wave paths which have a distance (a) 11 cm (b) 11.40 cm (c) 12.53 cm (d) 14.21 cm.
43
(a)
(b)
(d)
Fig.4.11 Travel times to propagating wave paths which have a distance (a) 11 cm (b) 11.40 cm (c) 12.53 cm (d) 14.21 cm.
Fig.4.12 Arrival time of the infiltrated region.
arrival times corresponding to each propagating wave path are well matched to the sequence of the propagating wave path close to the borehole in Fig. 4.12. Compare Fig. 4.3 with Fig. 4.7, it is explained by the relation between pressure of fracture fluid and arrival time of fracturing fluid. When the pumping is stopped, the variation of the travel time does not exist in Fig. 4.11(a)-(d).
4.1.2 Frequency shift analysis
Spectral centroid is a method for estimating a seismic attenuation based on frequency shift data [3]. Basic concept of this method is a comparison of spectral centroids calculated from a power spectrum