Japan Advanced Institute of Science and Technology
JAIST Repository
https://dspace.jaist.ac.jp/Title
Electroless Deposition of Silver Dendrite Nanostructure onto Glassy Carbon Electrode and Its Electrocatalytic Activity for Ascorbic Acid Oxidation
Author(s) Hasan, Md. Mahmudul; Rakib, Riad Hussain; Hasnat, Mohammad Abul; Nagao, Yuki
Citation ACS Applied Energy Materials, 3(3): 2907-2915 Issue Date 2020-02-24
Type Journal Article
Text version author
URL http://hdl.handle.net/10119/17073
Rights
Md. Mahmudul Hasan, Riad Hussain Rakib, Mohammad Abul Hasnat, Yuki Nagao, ACS Applied Energy Materials, 2020, 3(3), pp.2907-2915. This
document is the Accepted Manuscript version of a Published Work that appeared in final form in ACS Applied Energy Materials, copyright (c) American Chemical Society after peer review and technical editing by the publisher. To access the final edited and published work see
https://doi.org/http://dx.doi.org/10.1021/acsaem. 9b02513.
1
Electroless deposition of silver dendrite
nanostructure onto glassy carbon electrode
and its electrocatalytic activity for ascorbic
acid oxidation
Md. Mahmudul Hasan,† Riad Hussain Rakib,‡ Mohammad Abul Hasnat, ‡,* Yuki Nagao†,*
† School of Materials Science, Japan Advanced Institute of Science And Technology, 1-1
Asahidai, Nomi, Ishikawa 923-1292, Japan
‡ Department of Chemistry, Graduate School of Physical Science, Shahjalal University of
Science and Technology, Sylhet-3114, Bangladesh
Abstract
Well-defined silver dendrite nanostructures with primary and secondary branches on a glassy carbon electrode (GCE) surface are first demonstrated using a simple wet chemical electroless deposition method without any aid of a surfactant. The properties of dendrite structures were characterized using scanning electron microscopy (SEM), energy-dispersive X-ray spectroscopy (EDX), X-ray powder diffraction (XRD), X-ray photoelectron spectroscopy (XPS), cyclic voltammetry (CV), and electrochemical impedance spectroscopy (EIS). Results of XPS and XRD indicated that most of the silver particles were not oxidized. The obtained silver dendrite GCE (Ag/GCE) showed high electrochemical activity towards
2
catalytic oxidation for ascorbic acid (AA). The oxidation process followed a stepwise mechanism at slower scan rates (υ < 0.15 V s-1) and a concerted mechanism at faster scan
rates (υ > 0.15 V s-1). The silver nanostructures are highly stable on the GCE surface and
could be employed as an anode for an AA fuel cell.
Keywords: electroless deposition, electrocatalysis, ascorbic acid, electron transfer kinetics,
dendrite structure.
1. Introduction
Metallic nanoparticles have become a potential candidate for use in an enormous range of applications. The use of metal nanoparticles for electrochemical techniques is attributable to good catalytic activity and high surface area, which are suitable for increasing electrochemical current density.1 Silver has unique electrical, chemical, and optical
properties that can be selected as potential candidates for electrocatalytic applications.2–5
The attractive hierarchical silver dendrite structure has been studied because for use as a catalyst6 and chemical sensor.7 Hierarchical fractal and dendritic structures can grow under
nonequilibrium growth conditions. Fractals and dendrites can be grown under diffusion-limited aggregation and an oriented attachment mechanism.8 The growth and structural
formation process must be elucidated further. Silver nitrate (AgNO3) is used widely as a
precursor for dendrite structure formation. Actually, researchers have developed different methods via photochemistry,9 sonochemistry,10 and electrochemistry11,12 to synthesize the
3
forces, but some reductants such as sodium borohydride are harmful to humans and also to the environment.13 A simple method of achieving environmental-friendliness is highly
desired.
Alternative power sources are highly desirable for building a sustainable and environmentally friendly future. Direct liquid fuel cells (DLFCs) having a simple design and cell operation are suitable as an alternative portable energy source. Recently, researchers are particularly addressing the use of ascorbic acid (AA) as a DLFC fuel because of its natural abundance and because it produces non-toxic by-products.14–16 Various techniques such as
chromatography,17 HPLC,18,19 spectroscopic,20 and electrochemical methods21 reportedly
elucidate the catalytic activity of AA oxidation reactions. Because of high sensitivity, simplicity, and low cost, electrochemical methods are believed to be among the best potential approaches.22 However, building an energy efficient DLFC, reaction mechanism, and kinetic
order must be considered carefully. In this context, several studies of the reaction mechanisms of AA oxidation have been documented.23–25 In fact, AA, an influential
antioxidant, is normally oxidized to dehydroascorbic acid (DHA) by the release of two electrons as shown in Scheme 1.17,23,26,27 During this electrochemical reaction, DHA opens
4
its lactone ring. The formation of electro-inactive 2,3-diketogulonic acid24,25,28–30 causes
electrode fouling.31,32 Researchers have used silver metal as an electrochemical catalyst to
overcome this shortcoming.33
Several reports have described that the carbon-based electrode is quite suitable for AA electro-oxidation because of its high corrosion-resistance and excellent mechanical stability.34–40 Among the various forms of carbon, glassy carbon (GC) has a distinctive
property of combining glassy and ceramic properties with those of graphite. Complete inertness to chemicals, high-temperature resistivity, and impermeability to gases and liquids make GC more attractive to catalysis researchers.41 Nevertheless, no
report of the literature describes a study combining GCE and a silver dendrite nanostructure for AA electro-oxidation.
This report describes simple electroless deposition of silver particles onto a GCE surface with no capping agent or external force such as current, pressure, or temperature, as shown in Scheme 2. In the basic condition, the surface of the glassy carbon electrode (GCE) is negatively charged. The silver ions move to the GCE surface and reduced to form silver
Scheme 2. Electroless deposition mechanism of
5
nanoparticles (AgNPs). These AgNPs are acting as seed and the dendrite nanostructure is a result of rapid nucleation and growth of AgNPs. This report is the first describing a study of simple adsorption techniques in the synthesis of the silver dendrite structure on to the GCE surface. Our silver dendrite was fully grown to have a primary and secondary nanostructure with leaves. This framework was considerably stable on the GCE surface. It exhibited high catalytic performance. We also discussed the kinetic reaction pathway of AA oxidation. The oxidized Ag+ promotes AA oxidation and produces oxidized product DHA per the following
reactions.
Ag0 → Ag+ + e- (1)
Ag+ + AA→ Ag0 + DHA (2)
2. Experimental
2.1 Chemicals and Instruments
Analytical grade AA, AgNO3, sodium chloride (NaCl), disodium hydrogen phosphate
(Na2HPO4), dipotassium hydrogen phosphate (K2HPO4), sulfuric acid (H2SO4), sodium
hydroxide (NaOH), and hydrochloric acid (HCl) (Fujifilm Wako Pure Chemical Corp.) were used. Potassium chloride (KCl) was purchased from Kanto Chemical Ltd. Milli-Q™ water was used to prepare all the necessary solutions. All the experiments were conducted in phosphate buffer solution (0.1 M PBS) having pH 7, under deaeration and at room temperature (25°C ±0.5°C). The PBS solution was prepared by mixing NaCl (4 g), KCl (0.1
6
g), Na2HPO4 (0.72 g) and K2HPO4 (0.12 g) with 500 mL Milli-Q™ water. To control the
solution pH, NaOHaq and HClaq were applied.
2.2 Electroless deposition of silver particles on GCE
After the GCE surface was cleaned by polishing with alumina (0.05 µm diameter), it was sonicated with ethanol and water separately for 10 min. The GCE surface was treated by potential cycling in argon (Ar) gas saturated 0.1 M H2SO4 from 0 V to +1.0 V at a scan rate
100 mV s-1 and was dried at room temperature. Next, equal volumes of 0.1 M AgNO3 and
0.1 M NaOH solution were taken into a glass cell. The cleaned GCE (φ= 3mm) was then dipped into the solution without applying voltage. The glass cell was kept for 24 hr at room temperature under dark conditions. This led to the spontaneous deposition of silver particles onto the GCE surface. The GCE was then removed from the glass cell and washed several times with a solution containing ethanol and water (1:1, v/v).
2.3 Characterizations
The silver dendrite structure was observed through a scanning electron microscope (SEM) coupled with energy dispersive x-ray spectroscopy (EDX, TM3030Plus miniscope; Hitachi Ltd.) and field-emission scanning electron microscopy (FE-SEM, S4100; Hitachi Ltd.). Also, x-ray photoelectron spectroscopy (XPS) measurements were taken on a delay-line detector (DLD) spectrometer (Kratos Axis-Ultra; Kratos Analytical Ltd.) with an Al Kα radiation source (1486.6 eV). Powder x-ray diffractometer (XRD) patterns were recorded on a fully automatic horizontal multi-purpose x-ray diffractometer (Rigaku Smartlab; Rigku Corp.) as
7
a 2θ range from 20° to 90°. Electrochemical measurements were taken using a CHI 760 potentiostat. The electrochemical impedance spectra (EIS) were recorded using a
potentiostat (Autolab PGSTST 128N, The Netherlands) in a conventional three-electrode cell. GCE of 3 mm diameter coated with polychlorotrifluoroethylene was used as a working electrode. At the same time, Ag/AgCl (sat. KCl) and Pt wire were used respectively as reference and counter electrodes.
3. Results and Discussion
3.1 Morphological and elemental analysis
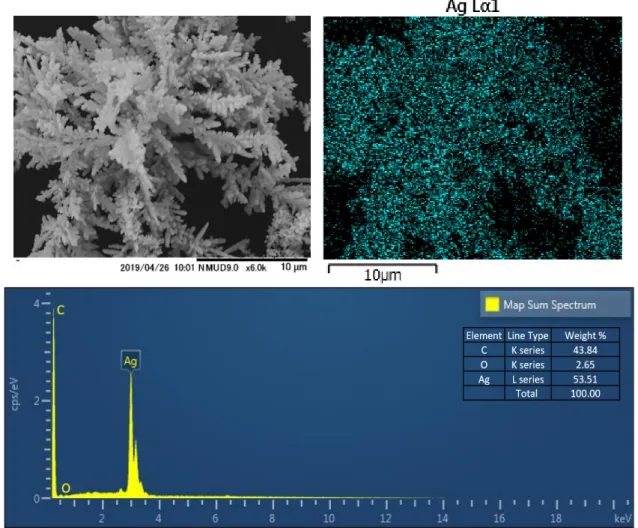
Figure 1 displays FE-SEM images of the as-prepared silver nanoparticles deposited on the GCE surface. Several reports describing the silver dendrite structure have demonstrated the morphological structure having central trunks combined with secondary branches.29,46
Figure 1a presents an overall image of electrolessly deposited silver particles on the GCE surface. The obtained SEM images show that well-dispersed multiple branches of silver particles were deposited on the GCE having dendrite structure. Figures 1b and 1c revealed secondary branches of the silver dendrite. Figure 1d shows one part of the full-grown dendrites. Higher-order branches as leaves were observed with the central trunk and secondary branches. The scale of the branches was in the range of a hundred nanometers. The trunk was almost straight, with secondary branches developed at an approximately 60° angle with respect to the central trunk. This dendrite structure was a result of rapid nucleation and further growth from AgNPs 3, 5, 42 shown in Figures 1e and 1f.
8 Figure 1. SEM images of the silver dendrite structure onto the GCE surface (a-f).
(a)
(b)
(c)
(d)
(f)
(e)
9
EDX technique can reveal the elemental distribution as a 2D map, as shown in Figure 2. The EDX data show that the dendrite structure comprises silver particles only. The carbon element is derived from the GCE surface. A small amount of oxygen was detected. XPS is a suitable technique to distinguish metallic silver and silver oxide. Silver metal has unique properties: Silver adsorbs oxygen dissociatively instead of forming bulk oxide in the presence of O2 at room temperatures and pressures. Also, metal oxide has higher binding
energy (BE) compared with the metallic statebecause of the lower valence electron charge
10
density.43 Unlike other metals, the silver–silver oxide system has a negative BE shift of metal
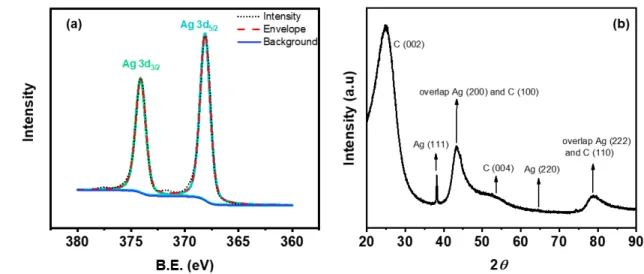
cations as the increasing oxidation state.44 Figure 3a presents the XPS data of the silver
dendrite structure. Two major peaks were observed at binding energies of 368.1 eV and 374.1 eV, respectively representing Ag0(3d
5/2) and Ag0(3d3/2). The difference of binding
energy for the peak splitting was 6 eV, which signifies the metallic silver formation.43–45
Satellite peaks at binding energy of 371.8 eV further prove the presence of the metallic silver.43,46 The existence of metallic silver can also be supported by XRD results shown in
Figure 3b.47
Figure 3. (a) Ag 3d XPS spectra of silver dendrite on the GCE surface.(b) XRD pattern of silver dendrite onto the GCE surface.
11 3.2. Electrochemical characterization
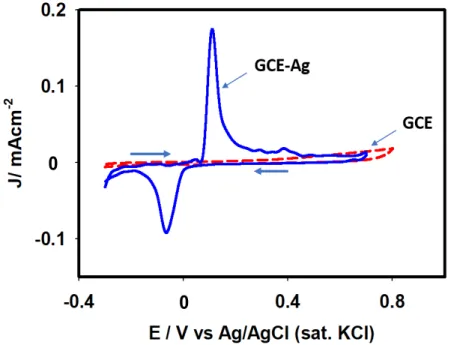
Figure 4 shows the cyclic voltammograms of 0.1 M PBS at a scan rate of 0.1 V s-1 using
GCE and silver-deposited GCE between -0.3 and 0.8 V. With reference to Ag/GCE, the cyclic voltammogram response shows redox peaks. During the positive scan starting from – 0.3 V, silver particles on GCE oxidize at +0.11 V. Also, the oxidized particles revert to the original state (Ag0) during the reverse scan at a potential of –0.06 V. This feature is consistent
with those reported in the literature.47,48 However, such features were absent when a cleaned
GCE alone was used as the working electrode. This observation demonstrates that the electroless deposition of silver particles onto the GCE surface took place successfully. Electrochemical impedance spectroscopic (EIS) analysis was conducted next to unveil the
0 0
Figure 4. Cyclic voltammograms of 0.1M PBS (pH 7.0) using GCE (dotted line) and
12
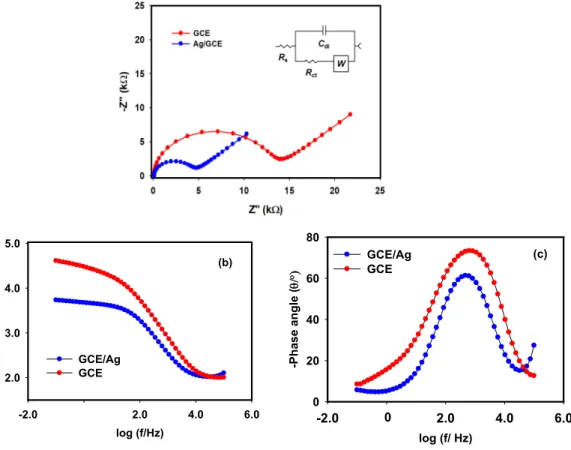
relative electronic properties of the GCE and Ag/GCE surface. The EIS spectra for AA in 0.1 M PBS (pH 7) are recorded by adjusting the excitation potential of 0.25 V within the frequency range of 0.1 Hz to 0.1 MHz. Figure 5 portrays complex plane plots recorded with a bare GCE and a Ag/GCE surface in 0.1 M PBS containing 2.9 mM AA. The complex plane plots presented in Figure 5 show that a semicircle at the high-frequency region and a diagonal line with a slope of 45o at low-frequency region appeared in the cases of both electrodes.
Figure 5. Nyquist plots (a), bode module plots (b) and (c) bode phase plots of 2.9 mM AA in 0.1 M PBS (pH~7.0) at bare GCE and Ag/GCE. The dotted lines represent experimental data and the solid lines represent fitted data. (inset: relevant equivalent circuit) 0 0 log (f/Hz) -2.0 0.0 2.0 4.0 6.0 log ( Z/ ohm ) 2.0 3.0 4.0 5.0 GCE/Ag GCE (b) log (f/ Hz) -2.0 0.0 2.0 4.0 6.0 -P hase an gl e ( θ/ ο) 0 20 40 60 80 GCE/Ag GCE (c) 0
13
This observation suggests that a diffusional process was coupled with a charge transfer process at the lower frequency region. For this process, the equivalent circuit consists of a series of the solution resistance (Rs), and a parallel combination of charge transfer resistance
(Rct), double-layer capacitance (Cdl), and Warburg impedance (W).49,50 The smaller diameter
of the semicircle in the case of Ag/GCE in contrast to that of bare GCE implies the enhancement of AA electro-oxidation reactions. However, the Bode module plots shown in Figure 5b reveal more explicitly about the charge transfer behavior by the two electrodes. Note that both electrodes exhibited two breakpoints, whereas the breakpoint shown by GCE-Ag is sharper than that shown by a GCE. In the order of decreasing frequency, two breakpoints correspond time constants 𝜏𝜏1, and 𝜏𝜏2, respectively, defining R𝑠𝑠, Rct and Cdl as
follows.51 𝜏𝜏1= ω1 1 = 𝑅𝑅𝑠𝑠𝑅𝑅𝑐𝑐𝑐𝑐𝐶𝐶𝑑𝑑𝑑𝑑 𝑅𝑅𝑠𝑠+𝑅𝑅𝑐𝑐𝑐𝑐 (1) 𝜏𝜏2 = ω1 𝑚𝑚𝑚𝑚𝑚𝑚 = RctCdl (2)
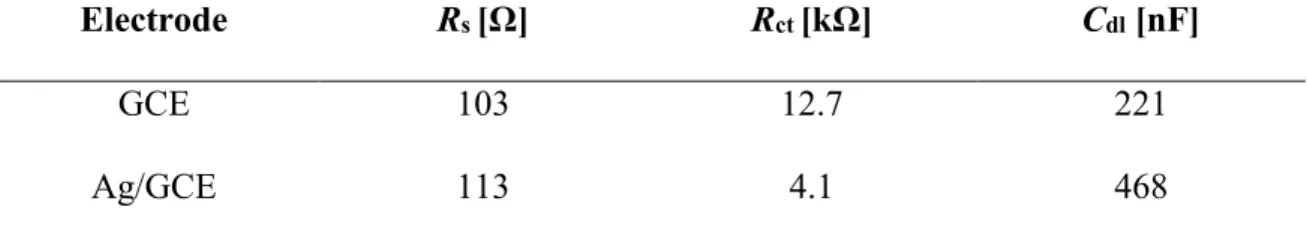
It is to denote that the Bode phase plots (see Figure 10c) also express the similar significance to those of Bode magnitude plots for the simplified Randle’s circuit. The EIS properties according to the modeled circuit are explained in Table 1. According to the data provided in the table, the charge transfer resistance (Rct) of Ag/GCE was only about
one-third (4.1 kΩ) of that exhibited by bare GCE (12.7 kΩ) pertaining to oxidation of AA molecules. The double-layer capacitance also increased significantly in the case of Ag/GCE (468 nF) compared to that of bare GCE (221 nF). This result implies the formation of local charge layers with increasing area at the modified electrode surface as the double layer
14
capacitance increases with active area.52 All these observations present a clear indication
that Ag/GCE surface can enhance AA oxidation reactions effectively.
Table 1 Modeled EIS properties of bare GCE and Ag/GCE surfaces
Electrode Rs [Ω] Rct [kΩ] Cdl [nF]
GCE 103 12.7 221
Ag/GCE 113 4.1 468
Condition, 0.1 M PBS (pH 7); 2.9 mM AA; Excitation potential, 0.25 V
Determining the surface concentration of catalytic species is an important characterization to discuss the relation between the concentration of electro-active material and electro-catalytic activities. For this purpose, the scan-rate-dependent cyclic voltammograms of 0.1 M PBS using Ag/GCE were recorded. The surface concentrations of electroactive species were calculated from the slope of the Ip vs. scan rate relation according
to the following equation.53,54
𝐼𝐼𝑝𝑝 = 𝑛𝑛
2𝐹𝐹2𝜐𝜐𝜐𝜐𝜐𝜐
4𝑅𝑅𝑅𝑅 (3)
Therein, Ip is the peak current (µA), Γ denotes surface concentration of electroactive species
(mol cm-2), n stands for number of electron transfer, F is the Faraday constant (C mol-1), υ
is the scan rate (mV s-1), A represents the electrode area (cm2), R is the gas constant (J K-1
mol-1), and T stands for the temperature (K). The calculated surface coverage from the slope
15 3.3 Catalytic performance for AA electro-oxidation
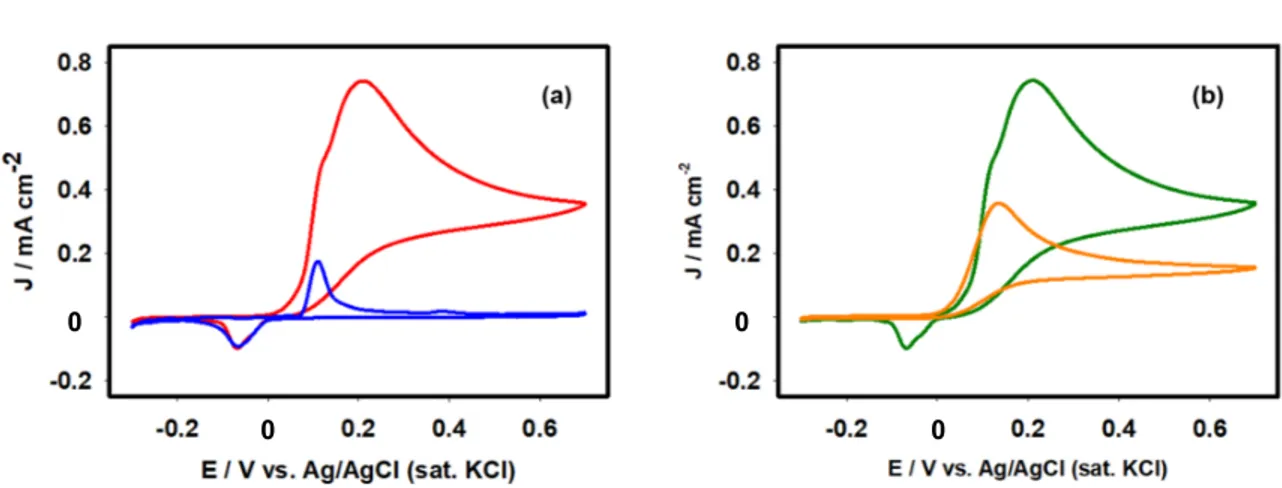
To elucidate details of the electrocatalytic oxidation reaction of AA molecules using the Ag/GCE surface, cyclic voltammograms were recorded under different experimental conditions. Figure 6a portrays cyclic voltammograms of 2.9 mM AA molecules using Ag/GCE recorded between -0.3 V and 0.7 V in the presence and absence of AA molecules in 0.1 M PBS at a scan rate of 50 mV s-1. In the presence of AA molecules, a well-defined
wave attributable to the oxidation reaction appears at +0.20 V. To prove the improved catalytic ability of AA oxidation reaction, cyclic voltammograms of AA molecules using the bare GCE were also recorded as shown in Figure 6b. The bare GCE exhibited lower AA oxidation current than that of the Ag/GCE. This observation is consistent with those obtained from EIS studies described in the earlier section. Consequently, the voltammetric investigations were performed using Ag/GCE. Figure 7a presents the concentration (1.47–
Figure 6. (a) Cyclic voltammograms of Ag/GCE in the absence (blue line) and presence
of 2.9 mM AA (red line) in 0.1 M PBS at pH 7.0. (b) Relative catalytic activity bare GCE (orange line) and Ag/GCE (green line) for 2.9 mM AA in PBS having pH 7 at 50 mV s-1.
0 0
0 0
16
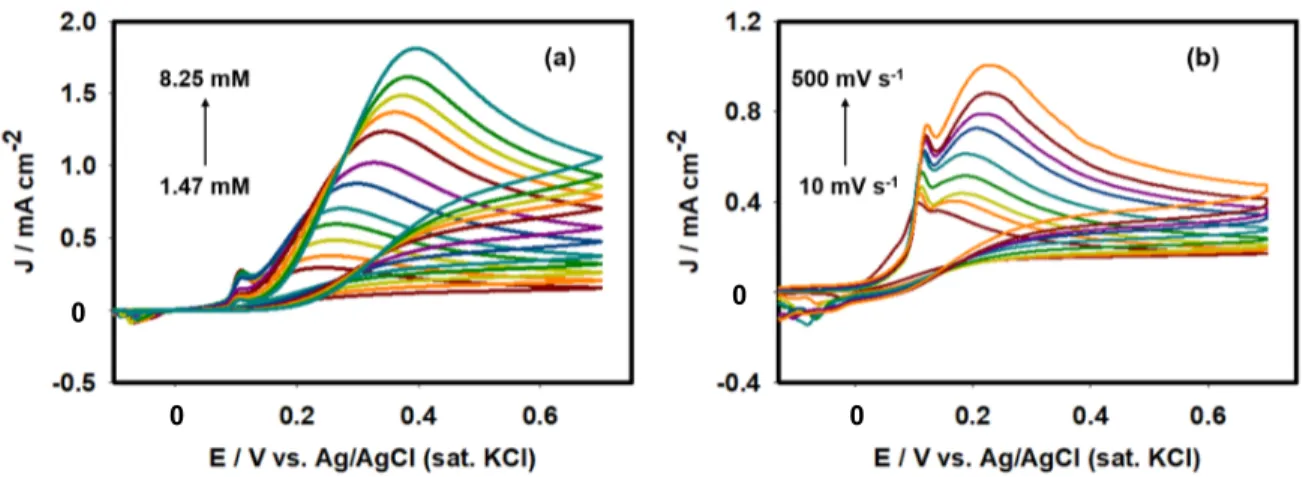
8.25 mM) effect of AA oxidation reactions using the Ag/GCE at a scan rate of 50 mV s-1.
With increasing concentration of AA, the oxidation current also increased; also, the peak potential shifted positively. The current attributable to oxidation of Ag0 particles at +0.11 V
decreased as the AA concentration increased, indicating that AA molecules are adsorbed onto the electrode surface inhibiting Ag0 oxidation process. Figure 7b presents current
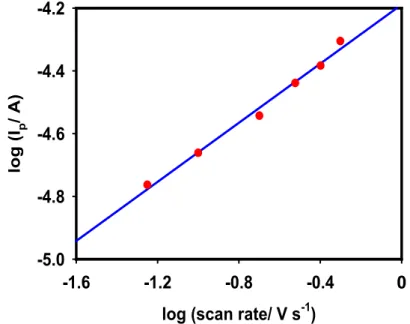
potential behaviors at different scan rates pertaining to oxidation of 2.9 mM AA molecules. Oxidation peaks of both Ag and AA increased concomitantly with the increasing scan rate. The value of log peak current (Ip) varied with log (scan rate) linearly (Figure 8) with a slope
of 0.48, which is close to 0.5, indicating that the AA oxidation at the Ag/GCE surface is controlled by the solution to the electrode surface mass transfer step.55
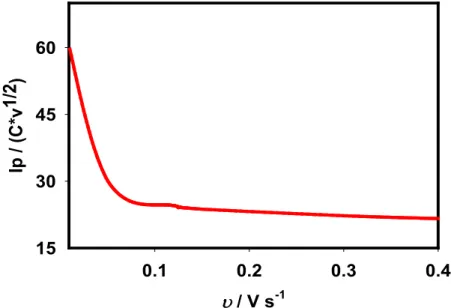
However, if the AA oxidation process obeys an ideal irreversible electron transfer, then the reaction ratio (Q) between Ip and C × υ1/2 is expected to remain constant with the scan
rate, according to the following equations 4 and 5.51
Figure 7.(a) Concentration effect of AA at 50 mV s-1. (b) Scan rate effect of 2.9 mM AA
in PBS having pH 7 using Ag/GCE catalyst.
0 0
17
𝐼𝐼𝑝𝑝 = (2.99 × 10⁵)𝑛𝑛 𝐴𝐴 𝐶𝐶 𝛽𝛽1/2𝐷𝐷1/2𝜐𝜐1/2 (4)
𝑄𝑄 = 𝐼𝐼𝑝𝑝
𝐶𝐶 × υ1/2 (5)
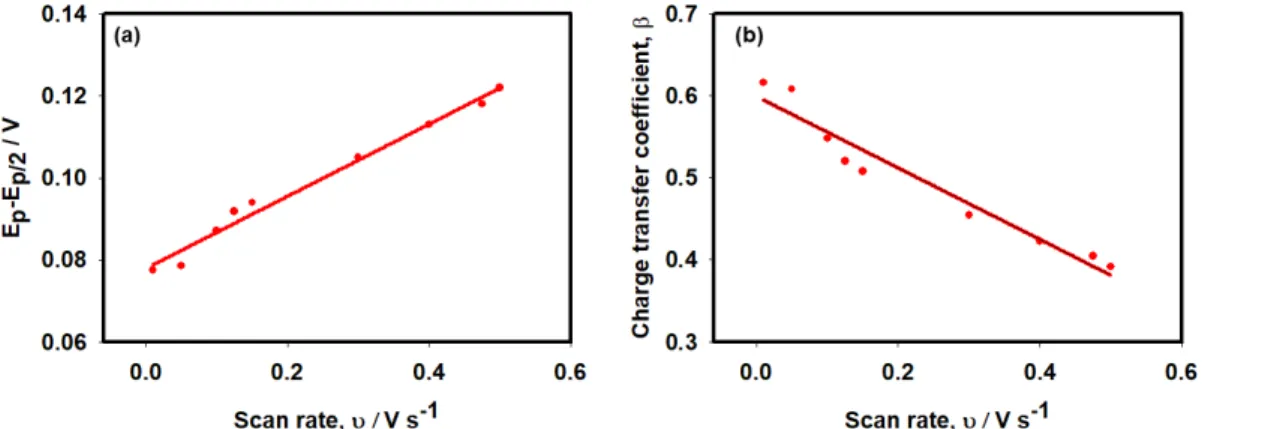
In those equations, C denotes the concentration of AA, and D stands for the diffusion coefficient of AA. As might be apparent from Figure 9, Q shows no constant value at the lower scan rate. The electron transfer (ET) kinetics is scan-rate-dependent because the charge transfer coefficient changed with the scan rate. To understand the details of ET kinetics further, we investigated the effects of ∆Ep/2 (the difference between peak potential
Ep and half peak potential Ep/2) on the scan rate. As shown in Figure 10a, ∆Ep/2 was observed
υ / V s-1 0.1 0.2 0.3 0.4 Ip / ( C* v1 /2 ) 15 30 45 60
18
to shift positively with the increase of the scan rate. The charge transfer coefficient (β) is expected to remain constant as the function of the scan rate for a straightforward irreversible oxidation reaction. The relation between β and ∆Ep/2 is definable by the following equation.51
𝛽𝛽 =𝐹𝐹|𝐸𝐸1.86𝑅𝑅𝑅𝑅
𝑝𝑝−𝐸𝐸𝑝𝑝/2| (6)
Results show that that ∆Ep/2 increased concomitantly with the scan rate (Figure 10a).
Therefore, the charge transfer coefficient (β) value shifts negatively (Figure 10b). Analytically, β decreased from 0.62 to 0.39 as the scan rate increased from 0.01 to 0.5 V s -1. The charge transfer coefficient higher than 0.5 indicates a step-wise mechanism. Smaller
values than this indicate that an electron transfer is concerted with a chemical step.55,56
Therefore, we concluded that the electro-oxidation of AA follows a stepwise reaction
Figure 8. Log (Ip) vs. log (scan rate) plots. Experimental conditions are the same as those
shown in Figure 7b.
log (scan rate/ V s-1)
-1.6 -1.2 -0.8 -0.4 0.0 log ( Ip / A ) -5.0 -4.8 -4.6 -4.4 -4.2 0
19
mechanism at the slower scan rates (υ < 0.15 V s-1). A mixed mechanism is followed while
the scan rate was0.15 V s-1. A concerted mechanism was observed at the faster scan rates
while an AA molecule is converted into DHA species on the Ag/GCE surface. The intermediate step is the formation of a radical anion by dissociation of one electron.57 Then
undergoes one-electron oxidation to DHA. In the slow scan, radical formation occurs followed by a stepwise process. But in the faster scan, this radical formation does not occur followed by a concerted process. Chronoamperometry is an excellent tool to check the electrochemical stability of the electrode.58 For stability check of Ag/GCE electrode,
chronoamperometry test was performed for 1000 s applying a working potential of 0.25V (a potential nearly peak potential of AA oxidation, see Figure 7) is shown in Figure 11. The modified electrode was stable as there was no sharp change of current. The FE-SEM image of the Ag/GCE after the chronoamperometry test performed for 1000 s at a peak potential of AA oxidation is shown in supporting information (Figure S1). The silver dendrite
Figure 10. (a) Dependence of ∆Ep/2 and (b) corresponding β on scan rate using Ag/GCE.
20
nanostructure was stabled even after the chronoamperometry test. The XPS data of silver dendrite nanostructure after the chronoamperometry test is exhibited in Figure S2. There was no change of the two major peaks of Ag0(3d5/2) and Ag0(3d3/2) prove that the silver dendrite
nanostructure remained as metallic silver state after the chronoamperometry test. The Open circuit potential (OCP) for Ag/GCE and GCE is shown in Figure S3. The OCP value is -0.07 and -0.09 for Ag/GCE and GCE respectively. The OCP value of the Ag/GCE shifted to positive potential indicating that the electrode gets positive behavior, which is indicative of enhancing the oxidation reaction of AA compared to GCE. The Comparison of catalytic performance of AA electro-oxidation based on silver modified electrode shown in Table 2.
Table 2 Comparison of catalytic performance of AA electro-oxidation based on the silver
modified electrode
Electrode Sensitivity
(µA mM-1 cm-2) Reference
Ag/GCE 254.3 This work
Ag/CPE 67.2 59
21
The electron transfer process in the AA oxidation is strongly dependent on the scan speed. The different electron transfer pathways can elucidate the AA oxidation process broadly. Because the metallic form of silver dendrite onto GCE improves the catalytic activity of AA oxidation, silver dendrite modified GCE exhibits good potential for application in an AA fuel cell.
4. Conclusion
We developed a simple electroless deposition technique for the stable silver dendrite structure onto a GCE surface. Results of testing demonstrated that the silver dendrite modified GCE exhibits high catalytic activity for AA oxidation. The surface concentration of the silver dendrite was 1.5 × 10⁻⁶ mol cm-2, which was quite a high value with
22
homogeneous coverage. Results of the kinetic study revealed that the oxidation process is a stepwise process at slower scan rates but concerted at faster scan rates. This new synthetic method for the silver dendrite form can play a crucially important role in the field of catalysis and for constructing the AA-based DLFC in the near future.
ASSOCIATED CONTENT
Supporting Information
SEM , XPS study of Ag/GCE after chronoamperometry test (catalytic test). The OCP curve for Ag/GCE and bare GCE.
AUTHOR INFORMATION
Corresponding Authors
M.A. Hasnat (E-mail: [email protected]) Y. Nagao (E-mail: [email protected] )
ORCID
M.A. Hasnat:https://orcid.org/0000-0002-9441-3986 Y. Nagao:
ACKNOWLEDGMENT
Mohammad Abul Hasnat thanks TWAS and SIDA for a research grant (2019_19-222 RG/CHE/AS_G), for partial support of this research work.
23 Notes
No author has any competing financial interest related to this report or the study it describes.
References
(1) Pardakhty, A.; Ahmadzadeh, S.; Avazpour, S.; Gupta, V. K. Highly Sensitive and Efficient Voltammetric Determination of Ascorbic Acid in Food and Pharmaceutical Samples from Aqueous Solutions Based on Nanostructure Carbon Paste Electrode as a Sensor. J. Mol. Liq. 2016, 216, 387–391.
(2) Ren, W.; Guo, S.; Dong, S.; Wang, E. A Simple Route for the Synthesis of Morphology-Controlled and SERS-Active Ag Dendrites with Near-Infrared
Absorption. J. Phys. Chem. C 2011, 115 (21), 10315–10320.
https://doi.org/10.1021/jp110532c.
(3) Fu, L.; Tamanna, T.; Hu, W.-J.; Yu, A. Chemical Preparation and Applications of
Silver Dendrites. Chem. Pap. 2014, 68 (10), 1283–1297.
https://doi.org/10.2478/s11696-014-0582-2.
(4) Sun, X.; Hagner, M. Novel Preparation of Snowflake-like Dendritic Nanostructures of Ag or Au at Room Temperature via a Wet-Chemical Route. Langmuir 2007, 23
(18), 9147–9150. https://doi.org/10.1021/la701519x.
(5) Wang, L.; Li, H.; Tian, J.; Sun, X. Monodisperse, Micrometer-Scale, Highly Crystalline, Nanotextured Ag Dendrites: Rapid, Large-Scale, Wet-Chemical Synthesis and Their Application as SERS Substrates. ACS Appl. Mater. Interfaces
24 2010, 2 (11), 2987–2991. https://doi.org/10.1021/am100968j.
(6) Huang, J.; Vongehr, S.; Tang, S.; Lu, H.; Shen, J.; Meng, X. Ag Dendrite-Based Au/Ag Bimetallic Nanostructures with Strongly Enhanced Catalytic Activity.
Langmuir 2009, 25 (19), 11890–11896. https://doi.org/10.1021/la9015383.
(7) Wen, X.; Xie, Y.; Mak, W. C.; Cheung, K. Y.; Li, X.; Renneberg, R.; Yang, S. Dendritic Nanostructures of Silver: Facile Synthesis, Structural Characterizations,
and Sensing Applications. Langmuir 2006, 22 (10), 4836–4842.
https://doi.org/10.1021/la060267x.
(8) Xie, S.; Zhang, X.; Xiao, D.; Paau, M. C.; Huang, J.; Choi, M. M. F. Fast Growth Synthesis of Silver Dendrite Crystals Assisted by Sulfate Ion and Its Application for Surface-Enhanced Raman Scattering. J. Phys. Chem. C 2011, 115 (20), 9943–9951.
https://doi.org/10.1021/jp201484r.
(9) Zou, K.; Zhang, X. H.; Duan, X. F.; Meng, X. M.; Wu, S. K. Seed-Mediated Synthesis of Silver Nanostructures and Polymer/Silver Nanocables by UV Irradiation. J. Cryst. Growth 2004, 273 (1–2), 285–291. https://doi.org/10.1016/j.jcrysgro.2004.08.016.
(10) Wang, X.-K.; Shao, L.; Guo, W.-L.; Wang, J.-G.; Zhu, Y.-P.; Wang, C. Synthesis of Dendritic Silver Nanostructures by Means of Ultrasonic Irradiation. Ultrason. Sonochem. 2009, 16 (6), 747–751. https://doi.org/10.1016/j.ultsonch.2009.03.005.
(11) Gu, C.; Zhang, T. Electrochemical Synthesis of Silver Polyhedrons and Dendritic Films with Superhydrophobic Surfaces. Langmuir 2008, 24 (20), 12010–12016.
https://doi.org/10.1021/la802354n.
25
Silver Nanostructures with Various Shapes. Mater. Chem. Phys. 2009, 116 (2–3),
464–468. https://doi.org/10.1016/j.matchemphys.2009.04.004.
(13) Zhang, X.; Ji, R.; Wang, L.; Yu, L.; Wang, J.; Geng, B.; Wang, G. Controllable Synthesis of Silver Nanodendrites on Copper Rod and Its Application to Hydrogen Peroxide and Glucose Detection. CrystEngComm 2013, 15 (6), 1173–1178.
https://doi.org/10.1039/C2CE26255J.
(14) Devendrachari, M. C.; Thimmappa, R.; Bhat, Z. M.; Shafi, S. P.; Nimbegondi Kotresh, H. M.; Kottaichamy, A. R.; Venugopala Reddy, K. R.; Thotiyl, M. O. A Vitamin C Fuel Cell with a Non-Bonded Cathodic Interface. Sustain. Energy Fuels 2018, 2 (8),
1813–1819. https://doi.org/10.1039/C8SE00221E.
(15) Muneeb, O.; Do, E.; Tran, T.; Boyd, D.; Huynh, M.; Ghosn, G.; Haan, J. L. A Direct Ascorbate Fuel Cell with an Anion Exchange Membrane. J. Power Sources 2017, 351,
74–78. https://doi.org/10.1016/j.jpowsour.2017.03.068.
(16) Choun, M.; Lee, H. J.; Lee, J. Positively Charged Carbon Electrocatalyst for Enhanced Power Performance of L-Ascorbic Acid Fuel Cells. J. Energy Chem. 2016,
25 (5), 793–797. https://doi.org/10.1016/j.jechem.2016.05.006.
(17) Oliveira, E. J.; Watson, D. G. Chromatographic Techniques for the Determination of Putative Dietary Anticancer Compounds in Biological Fluids. J. Chromatogr. B 2001,
764 (1–2), 3–25. https://doi.org/10.1016/S0378-4347(01)00401-7.
(18) Iwase, H. Use of Nucleic Acids in the Mobile Phase for the Determination of Ascorbic Acid in Foods by High-Performance Liquid Chromatography with Electrochemical
26
https://doi.org/10.1016/S0021-9673(00)00057-1.
(19) Rizzolo, A.; Brambilla, A.; Valsecchi, S.; Eccher-Zerbini, P. Evaluation of Sampling and Extraction Procedures for the Analysis of Ascorbic Acid from Pear Fruit Tissue.
Food Chem. 2002, 77 (2), 257–262. https://doi.org/10.1016/S0308-8146(02)00107-3.
(20) Zaporozhets, O. A.; Krushinskaya, E. A. Determination of Ascorbic Acid by Molecular Spectroscopic Techniques. J. Anal. Chem. 2002, 57 (4), 286–297.
https://doi.org/10.1023/A:10149380119550286.
(21) Lee, Y.-G.; Liao, B.-X.; Weng, Y.-C. Ruthenium Oxide Modified Nickel Electrode
for Ascorbic Acid Detection. Chemosphere 2017, 173, 512–519.
https://doi.org/10.1016/j.chemosphere.2017.01.086.
(22) Wu, G.; Wu, Y.; Liu, X.; Rong, M.; Chen, X.; Chen, X. An Electrochemical Ascorbic Acid Sensor Based on Palladium Nanoparticles Supported on Graphene Oxide. Anal. Chim. Acta 2012, 745, 33–37. https://doi.org/10.1016/j.aca.2012.07.034.
(23) Kuss, S.; Compton, R. G. Electrocatalytic Detection of Ascorbic Acid Using N,N,N’,N’-Tetramethyl-Para-Phenylene-Diamine (TMPD) Mediated Oxidation at Unmodified Gold Electrodes; Reaction Mechanism and Analytical Application. Electrochim. Acta 2017, 242, 19–24. https://doi.org/10.1016/j.electacta.2017.05.003.
(24) Hu, I. F.; Kuwana, T. Oxidative Mechanism of Ascorbic Acid at Glassy Carbon
Electrodes. Anal. Chem. 1986, 58 (14), 3235–3239.
https://doi.org/10.1021/ac00127a069.
(25) Prieto, F.; Coles, B. A.; Compton, R. G. Mechanistic Determination Using Arrays of Variable-Sized Channel Microband Electrodes: The Oxidation of Ascorbic Acid in
27
Aqueous Solution. J. Phys. Chem. B 1998, 102 (38), 7442–7447.
https://doi.org/10.1021/jp982080n.
(26) Naoko Fujiwara, Shin-ichi Yamazaki, Zyun Siroma, Tsutomu Ioroi, K. Y. Direct Oxidation of L-Ascorbic Acid on a Carbon Black Electrode in Acidic Media and Polymer Electrolyte Fuel Cells. Electrochem. commun. 2006, 8 (5), 720–724.
https://doi.org/10.1016/j.elecom.2006.02.021.
(27) Padayatty, S. J.; Katz, A.; Wang, Y.; Eck, P.; Kwon, O.; Lee, J.-H.; Chen, S.; Corpe, C.; Dutta, A.; Dutta, S. K.; et al. Vitamin C as an Antioxidant: Evaluation of Its Role
in Disease Prevention. J. Am. Coll. Nutr. 2003, 22 (1), 18–35.
https://doi.org/10.1080/07315724.2003.10719272.
(28) Zhang, M.; Liu, K.; Xiang, L.; Lin, Y.; Su, L.; Mao, L. Carbon Nanotube-Modified Carbon Fiber Microelectrodes for In Vivo Voltammetric Measurement of Ascorbic
Acid in Rat Brain. Anal. Chem. 2007, 79 (17), 6559–6565.
https://doi.org/10.1021/ac0705871.
(29) Ruiz, J. J.; Aldaz, A.; Dominguez, M. Mechanism of L-Ascorbic Acid Oxidation and Dehydro- L-Ascorbic Acid Reduction on a Mercury Electrode. I. Acid Medium. Can. J. Chem. 1977, 55 (15), 2799–2806. https://doi.org/10.1139/v77-389.
(30) Rueda, M.; Aldaz, A.; Sanchez-Burgos, F. Oxidation of L-Ascorbic Acid on a Gold Electrode. Electrochim. Acta 1978, 23 (5), 419–424.
https://doi.org/10.1016/0013-4686(78)87040-6.
(31) Raj, C. R.; Tokuda, K.; Ohsaka, T. Electroanalytical Applications of Cationic Self-Assembled Monolayers: Square-Wave Voltammetric Determination of Dopamine
28
and Ascorbate. Bioelectrochemistry 2001, 53 (2), 183–191.
https://doi.org/10.1016/S0302-4598(00)00129-X.
(32) Raj, C. R.; Ohsaka, T. Electroanalysis of Ascorbate and Dopamine at a Gold Electrode Modified with a Positively Charged Self-Assembled Monolayer. J. Electroanal.
Chem. 2001, 496 (1–2), 44–49. https://doi.org/10.1016/S0022-0728(00)00335-1.
(33) Harraz, F. A.; Faisal, M.; Al-Salami, A. E.; El-Toni, A. M.; Almadiy, A. A.; Al-Sayari, S. A.; Al-Assiri, M. S. Silver Nanoparticles Decorated Stain-Etched Mesoporous Silicon for Sensitive, Selective Detection of Ascorbic Acid. Mater. Lett. 2019, 234,
96–100. https://doi.org/10.1016/j.matlet.2018.09.076.
(34) Tashkhourian, J.; Nezhad, M. R. H.; Khodavesi, J.; Javadi, S. Silver Nanoparticles Modified Carbon Nanotube Paste Electrode for Simultaneous Determination of Dopamine and Ascorbic Acid. J. Electroanal. Chem. 2009, 633 (1), 85–91.
https://doi.org/10.1016/j.jelechem.2009.04.028.
(35) Karim-Nezhad, G.; Hasanzadeh, M.; Saghatforoush, L.; Shadjou, N.; Khalilzadeh, B.; Ershad, S. Electro-Oxidation of Ascorbic Acid Catalyzed on Cobalt Hydroxide-Modified Glassy Carbon Electrode. J. Serbian Chem. Soc. 2009, 74 (5), 581–593.
https://doi.org/10.2298/JSC0905581K.
(36) Xi, L.; Ren, D.; Luo, J.; Zhu, Y. Electrochemical Analysis of Ascorbic Acid Using Copper Nanoparticles/Polyaniline Modified Glassy Carbon Electrode. J. Electroanal. Chem. 2010, 650 (1), 127–134. https://doi.org/10.1016/j.jelechem.2010.08.014.
(37) Alonso-Lomillo, M. A.; Domínguez-Renedo, O.; Saldaña-Botín, A.; Arcos-Martínez, M. J. Determination of Ascorbic Acid in Serum Samples by Screen-Printed Carbon
29
Electrodes Modified with Gold Nanoparticles. Talanta 2017, 174 (May), 733–737.
https://doi.org/10.1016/j.talanta.2017.07.015.
(38) Sathe, B. R. A Scalable and Facile Synthesis of Carbon Nanospheres as a Metal Free Electrocatalyst for Oxidation of l -Ascorbic Acid: Alternate Fuel for Direct Oxidation
Fuel Cells. J. Electroanal. Chem. 2017, 799 (January), 609–616.
https://doi.org/10.1016/j.jelechem.2017.03.049.
(39) Zhang, X.; Yu, S.; He, W.; Uyama, H.; Xie, Q.; Zhang, L.; Yang, F. Electrochemical Sensor Based on Carbon-Supported NiCoO2 Nanoparticles for Selective Detection of
Ascorbic Acid. Biosens. Bioelectron. 2014, 55, 446–451.
https://doi.org/10.1016/j.bios.2013.12.046.
(40) Chethana, B. K.; Arthoba Naik, Y. Electrochemical Oxidation and Determination of Ascorbic Acid Present in Natural Fruit Juices Using a Methionine Modified Carbon
Paste Electrode. Anal. Methods 2012, 4 (11), 3754.
https://doi.org/10.1039/c2ay25528f.
(41) Hassler, M. Other Commonly Used Biomedical Coatings: Pyrolytic Carbon Coatings.
Coatings Biomed. Appl. 2012, 75–105.
(42) Zhang, G.; Sun, S.; Banis, M. N.; Li, R.; Cai, M.; Sun, X. Morphology-Controlled Green Synthesis of Single Crystalline Silver Dendrites, Dendritic Flowers, and Rods, and Their Growth Mechanism. Cryst. Growth Des. 2011, 11 (6), 2493–2499.
https://doi.org/10.1021/cg200256j.
(43) Kaspar, T. C.; Droubay, T.; Chambers, S. A.; Bagus, P. S. Spectroscopic Evidence for Ag(III) in Highly Oxidized Silver Films by X-Ray Photoelectron Spectroscopy. J.
30
Phys. Chem. C 2010, 114 (49), 21562–21571. https://doi.org/10.1021/jp107914e.
(44) Schön, G.; Tummavuori, J.; Lindström, B.; Enzell, C. R.; Enzell, C. R.; Swahn, C.-G. ESCA Studies of Ag, Ag2O and AgO. Acta Chem. Scand. 1973, 27, 2623–2633.
https://doi.org/10.3891/acta.chem.scand.27-2623.
(45) Breitwieser, D.; Moghaddam, M. M.; Spirk, S.; Baghbanzadeh, M.; Pivec, T.; Fasl, H.; Ribitsch, V.; Kappe, C. O. In Situ Preparation of Silver Nanocomposites on Cellulosic Fibers – Microwave vs. Conventional Heating. Carbohydr. Polym. 2013,
94 (1), 677–686. https://doi.org/10.1016/j.carbpol.2013.01.077.
(46) Firet, N. J.; Blommaert, M. A.; Burdyny, T.; Venugopal, A.; Bohra, D.; Longo, A.; Smith, W. A. Operando EXAFS Study Reveals Presence of Oxygen in Oxide-Derived Silver Catalysts for Electrochemical CO2 Reduction. J. Mater. Chem. A 2019, 7 (6),
2597–2607. https://doi.org/10.1039/C8TA10412C.
(47) Kaur, B.; Pandiyan, T.; Satpati, B.; Srivastava, R. Simultaneous and Sensitive Determination of Ascorbic Acid, Dopamine, Uric Acid, and Tryptophan with Silver Nanoparticles-Decorated Reduced Graphene Oxide Modified Electrode. Colloids
Surfaces B Biointerfaces 2013, 111, 97–106.
https://doi.org/10.1016/j.colsurfb.2013.05.023.
(48) Hafez, M. E.; Ma, H.; Peng, Y.-Y.; Ma, W.; Long, Y.-T. Correlated Anodic–Cathodic Nanocollision Events Reveal Redox Behaviors of Single Silver Nanoparticles. J. Phys. Chem. Lett. 2019, 10 (12), 3276–3281. https://doi.org/10.1021/acs.jpclett.9b01369.
(49) B. A. Lasia. Electrochemical Impedance Spectroscopy and Its Applications, in Modern Aspects of Electrochemistry. In Springer, New York; 2002; pp 143–248.
31
(50) Bard, L. R. F. A. J. Electrochemical Methods: Fundamentals and Applications. In 2nd ed., Wiley, New York; 2001; pp 1–864. https://doi.org/10.1002/1521.
(51) Hasnat, M. A.; Hasan, M. M.; Tanjila, N.; Alam, M. M.; Rahman, M. M. PH Dependent Kinetic Insights of Electrocatalytic Arsenite Oxidation Reactions at Pt
Surface. Electrochim. Acta 2017, 225, 105–113.
https://doi.org/10.1016/j.electacta.2016.12.055.
(52) Ahmed, R.; Reifsnider, K. Study of Influence of Electrode Geometry on Impedance
Spectroscopy. Int. J. Electrochem. Sci. 2011, 6 (4), 1159–1174.
https://doi.org/10.1115/FuelCell2010-33209.
(53) Ji, R.; Wang, L.; Yu, L.; Geng, B.; Wang, G.; Zhang, X. Effective Electrocatalysis Based on Ag2O Nanowire Arrays Supported on a Copper Substrate. ACS Appl. Mater. Interfaces 2013, 5 (21), 10465–10472. https://doi.org/10.1021/am4016523.
(54) Noroozifar, M.; Khorasani-Motlagh, M.; Taheri, A. Preparation of Silver Hexacyanoferrate Nanoparticles and Its Application for the Simultaneous Determination of Ascorbic Acid, Dopamine and Uric Acid. Talanta 2010, 80 (5),
1657–1664. https://doi.org/10.1016/j.talanta.2009.10.005.
(55) Hasnat, M. A.; Mumtarin, Z.; Rahman, M. M. Electrocatalytic Reduction of Hydroxylamine on Copper Immobilized Platinum Surface: Heterogeneous Kinetics
and Sensing Performance. Electrochim. Acta 2019, 318, 486–495.
https://doi.org/10.1016/j.electacta.2019.06.058.
(56) Muthukrishnan, A.; Boyarskiy, V.; Sangaranarayanan, M. V.; Boyarskaya, I. Mechanism and Regioselectivity of the Electrochemical Reduction in
32
Polychlorobiphenyls (PCBs): Kinetic Analysis for the Successive Reduction of Chlorines from Dichlorobiphenyls. J. Phys. Chem. C 2012, 116 (1), 655–664.
https://doi.org/10.1021/jp2066474.
(57) Hu, I. F.; Kuwana, T. Oxidative Mechanism of Ascorbic Acid at Glassy Carbon
Electrodes. Anal. Chem. 1986, 58 (14), 3235–3239.
https://doi.org/10.1021/ac00127a069.
(58) Silva, D. F.; Neto, A. O.; Pino, E. S.; Linardi, M.; Spinacé, E. V. Preparation of PtSn/C Electrocatalysts Using Electron Beam Irradiation. In Studies in Surface Science and Catalysis; 2010; Vol. 175, pp 555–558. https://doi.org/10.1016/S0167-2991(10)75107-7.
(59) Khalilzadeh, M. A.; Borzoo, M. Green Synthesis of Silver Nanoparticles Using Onion Extract and Their Application for the Preparation of a Modified Electrode for Determination of Ascorbic Acid. J. Food Drug Anal. 2016, 24 (4), 796–803.