JAIST Repository
https://dspace.jaist.ac.jp/Title Influences of transformed auditory feedback with
first three formant frequencies
Author(s) Shih, Tsungming; Suemitsu, Atsuo; Akagi, Masato
Citation
2011 International Workshop on Nonlinear Circuits, Communication and Signal Processing (NCSP'11): 340-343
Issue Date 2011-03-03
Type Conference Paper
Text version publisher
URL http://hdl.handle.net/10119/9973
Rights
This material is posted here with permission of the Research Institute of Signal Processing Japan. Tsungming Shih, Atsuo Suemitsu and Masato Akagi, 2011 International Workshop on Nonlinear Circuits, Communication and Signal Processing (NCSP'11), 2011, pp.340-343.
Influences of transformed auditory feedback with first three formant frequencies
Tsungming Shih
1, Atsuo Suemitsu
2and Masato Akagi
3123
Japan Advanced Institute of Science and Technology 1-1 Asahidai, Nomi, Ishikawa 923-1292, Japan
Email: 1tsungming1980@ gmail.com, [email protected] and [email protected]
Abstract
Auditory feedback is one of important roles from speech production to perception. It also directly affects speech production under several feedback situations, such as noise environment, delayed auditory feedback (DAF) and transformed auditory feedback (TAF). Previous investigations have shown that compensation is the main response to TAF with the voice features, like fundamental frequency or formant frequencies (F1 and F2). However, human response to the perturbations of the first three formant frequencies (F1, F2 and F3) is still indistinct. Therefore, the purpose of the current study is to examine the influence of TAF with F1, F2 and F3 on speech production. The results obtained from 9 subjects showed that the average latency response to TAF was presented within 140 ms. Moreover, the major response was the following response which was quite different from that of the previous researches, compensation. Consequently, the reason induced these two responses to TAF needs to be clarified in the coming study.
1. Introduction
Auditory feedback is an important and effective path for speakers in speech communication to perceive the actual information. Speakers generally adapt their production to changing environments by this path. For decades, many auditory feedback experiments have been conducted to investigate the reaction of subjects' production on the voice properties in order to evaluate contributions of the auditory feedback. One of the earliest studies is called Lombard effect, that is, speakers increased intensity and F0 of their vocalization in a noisy environment [1]. In the 1950's, Lee showed that the delayed auditory feedback (DAF) disrupted most speakers' production [2]. Furthermore, several researches using F0 shifting alteration showed that participants compensated the F0 of their vocalization in response to the transformed auditory feedback (TAF) within about 100-150 ms after perturbation onset [3-6]; and some studies have demonstrated that formant (F1) perturbation also caused the same response, compensation, to the alteration [7-9]. However, the responses of the other voice features to the influences of TAF are still indistinct.
Therefore, the aim of this study is to clarify the spontaneous responses to TAF on the first three formants of the subjects' production. We designed a transformation method to alter subjects' vowel to another vowel as their
vocalization consistently and to prevent the subject from modifying the transformed formants and learning.
In the following sections, this report first describes the connection of the necessary equipment and the transformation method used to make a consistent perturbation. The experiment procedures are then designed to gather the participant's vocalization under three auditory feedback conditions (two perturbation conditions and one non-perturbation condition). Next, a usable algorithm is utilized to extract the formant tracking of the voice data for analyzing the influences of TAF. Subsequently, the formant deviation is adopted to examine the difference between the auditory feedback conditions and the subjects' responses to the consistent TAF. The results are discussed in the final part.
2. Construction of the Transformed Auditory Feedback
This section presents a TAF construction used to alter subjects' formant frequencies and to record their voice data.
2.1 Equipment Connection
An overview of the connection of the necessary apparatus used in the experiment is described in Fig 1. The subject's vocalization signal is amplified using a TASCAM Mx-4 microphone amplifier with +30 dB gain. Then the amplified signal is fed into a laptop computer and the TAF machine (see Sec. 2.2 for details). Subsequently, the TAF machine outputs the transformed vowel depending on a set of Gauss parameters, which is sent from the laptop to the TAF machine via RS-232, for altering the input signal. At the same time, pink noise generated by the laptop is added to the transformed vowel with a mixer (AT-PMX5P) to minimize effect of airborne sound and bone conducted sound. Finally, the subject hears the transformed voice from a headphone.
2.2 Formant Transformation
In the experiment, a customized DSP machine, called the TAF machine shown in Fig 1, is implemented to transform the input vowel to another vowel by altering the first three formant frequencies (F1, F2 and F3). Figure 2 shows the key processing steps in the TAF machine. An input analog signal from the microphone is converted to a digital signal at 16 KHz sampling rate and is then divided into a frame with 64 sample data (4 ms); next, four frames multiplied by a 256-point Hamming window are
2011 International Workshop on Nonlinear Circuits, Communication and Signal Processing
transformed to the frequency domain with fast Fourier transform (FFT). The formant alteration is accomplished by using three negative Gauss distributions to attenuate the energy of the existing formants (F1, F2 and F3) and three positive Gauss distributions to intensify the energy of the new formants. Finally, the altered spectrum is converted to the transformed signal with inverse FFT (IFFT) and a D/A converter.
Moreover, it is necessary to estimate the parameters (gain, mean and standard deviation) of each Gauss distribution to alter the input spectrum. A usable method is as follows:
(a) Subtract the smoothed spectrum of the input vowel from that of the target vowel. The smoothed spectrum is calculated by two steps.
Step 1: covariance algorithm with 18 orders is used to estimate the spectrum of each frame.
Step 2: the spectrums near the center of the calculated spectrums are selected and averaged to get the smoothed spectrum.
In the subtracted spectrum, the first three peaks are the first three formants of the target vowel and the first three valleys show the first three formants of the input vowel.
(b) Balance the magnitudes of valleys and peaks by shifting the subtracted spectrum to make the magnitudes of valleys and peaks to approach zero. Subsequently, the frequency and magnitude at each valley or peak position are defined as the mean and gain of each Gauss distribution.
(c) Modify the standard deviation of each Gauss distribution to make the combined Gauss distribution from these Gauss distributions close to the subtracted spectrum.
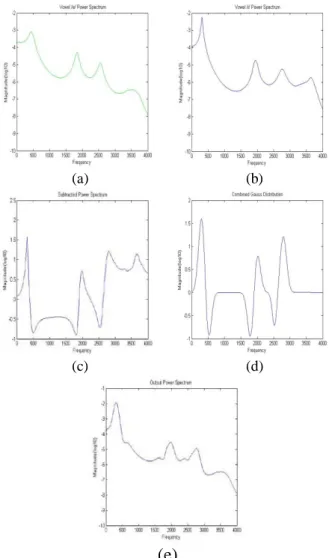
For instance, Fig 3(c) shows the subtracted and balanced spectrum obtained from the smoothed spectrum of the input vowel /e/ and target vowel /i/ as shown in Fig 3(a) and 3(b), respectively. Next, Fig 3(c) is used to estimate the parameters of each Gauss distribution by the above step (b) and (c). Finally, the combined Gauss distribution as shown in Fig 3(d) is used to transform the input vowel /e/ to the target vowel /i/. Here, the formants of output spectrum as shown in Fig 3(e) approach that of target vowel /i/. The formants of each spectrum are described on the table of its panel. In addition, the peaks and valleys on Fig 3(d) are changed by the standard deviation of each Gauss distribution.
3. Experimental Design
For some reasons, a pretest for recording subjects’ vowels (/e/, /a/, and /i/) is performed before the experiment. Figure 1. An overview of the connection of the necessary
apparatus.
Figure 2. The key processing steps on the TAF machine to accomplish the vowel transformation.
(a) (b)
(c) (d)
(e)
Figure 3. Example of the formant transformation. Panels (a) and (b) show the smoothed spectrum of the input vowel /e/ and the target vowel /i/, respectively. Panel (c) is the subtracted spectrum used to estimate the parameters, gain, mean and standard deviation, of each Gauss distribution. Panel (d) is the combined Gauss distribution for transforming the input vowel /e/ to the target vowel /i/. Panel (e) is the output spectrum transformed by combined Gauss distribution.
A/D D/A Input Signal Transformed Signal Segment FFT
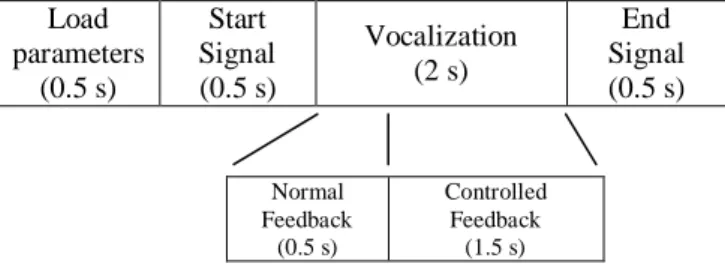
First, the three-formant space of the same vowel is quite different for each individual subject. Second, the auditory transformation method as described in Section 2 is based on the formant frequencies of the subject's production. Therefore, subjects need to perceive the transformed voice several times for fine-tuning the Gauss parameters to make the transformed voice as similar as their production. During the experiment, subjects sit on a chair located in a voice insulated room. As illustrated in Fig 4, an experimental trial is divided into four phases. Each phase consists of a short time. In the first phase, a set of the Gauss parameters is loaded into the TAF machine depending on the three controlled feedback, as follows:
(1) etoe: the feedback is the same as subjects’ production, vowel /e/.
(2) etoa: the feedback is vowel /a/ while subjects produce vowel /e/.
(3) etoi: subjects hear vowel /i/ while producing vowel /e/.
And then, the start signal, a prompted vowel /e/ recorded from the subject's production, induces the subject to produce a steady-state vowel /e/ until the end signal, a sinusoidal sound wave with 600 Hz. During each vocalization, the subject hears a sequential auditory feedback from the headphone. First is the normal auditory feedback, the subject's production; the following one is the controlled feedback which is one of the three auditory feedback conditions. After one trial, subjects wait 3 seconds to continue the next trial and the auditory feedback condition is also changed randomly. In the experiment, every subject performs 30 trials per session, in which each feedback condition is performed ten times. The session is repeated five times and eventually 150 voice data are collected per subject. After accomplishing one session, subjects can take a litter break to relax tense muscles.
4. Formant Analysis
Since the third formant is changeable, the first two formant trajectories of the recorded voice data are extracted to evaluate the participants' responses to the consistent TAF. Although these voice data are recorded in a voice insulated room without environmental noise, the long vocalization makes the fundamental frequency more changeable. This effect also interferes with the formant trajectories estimated by LPC algorithm. To reduce this effect on the formant trajectories, the first two formants of each frame are extracted as follows:
(a) Adopt STRAIGHT [10] to estimate the power spectrum without the interferences caused by
fundamental frequency. The frame length is 40 ms and the frame shift is 1 ms.
(b) Invert the power spectrum with IFFT to acquire the auto-covariance sequence.
(c) Convert an appropriate length (the number of coefficients) of the auto-covariance sequence to the prediction polynomial.
(d) Present the frequency response of the filter in which the numerator polynomial is 1 and the denominator polynomial is the prediction polynomial as the smoothed polynomial.
(e) Select the peaks of the smoothed spectrum between 200 Hz and 3000 Hz as the formant candidates. (f) Refer to the first two peaks of the smoothed
spectrum of the input vowel to select the first two formants from the formant candidates based on the minimum distance with the two reference peaks. However, if the minimum distance was over 500 Hz, the formant is replaced by the average of a few frames around this frame.
After estimating the formants of each frame, the formant trajectories are acquired by linking these formants. Moreover, an appropriate length in the step (c) is between 18 and 26 to minimize the deviation of the formant trajectories between 0.3 s and 1.5 s.
5. Response Evaluation
To estimate the spontaneous responses to the consistent TAF in the participants' production, the formant deviation of each recorded voice during the controlled feedback are calculated for statistical analysis by the following steps. First, the formants trajectories are equally divided to serial blocks with 128 ms frame length and 64 ms frame shift between 0 s and 1.6 s; and then the formants at the block time which is the middle of the block, are defined as the average of formants in the same block. Finally, the formant deviation (△F1 and △F2) at the block time from 0.5 s to 1.6 s is calculated by subtracting the formats at the block time from the average of the formants between 0.3 s and 0.5 s.
Figure 5. The average tracks of the formant deviations from one subject’s data. The point line, circle line and asterisk line show the formant deviation of the etoe,
etoa and etoi conditions, respectively.
608 672 736 800 864 928 992 1056 1120 1184 1248 1312 1376 1440 1504 1568 0 5 10 15 20 Time (ms) ∆ F 1 ( H z) etoe etoa etoi 608 672 736 800 864 928 992 1056 1120 1184 1248 1312 1376 1440 1504 1568 -100 -50 0 50 Time (ms) ∆ F 2 ( H z) etoe etoa etoi Load parameters (0.5 s) Start Signal (0.5 s) Vocalization (2 s) End Signal (0.5 s) Normal Feedback (0.5 s) Controlled Feedback (1.5 s)
After calculating all the formant deviations of each block time for every recorded voice, the average tracks of the formant deviations for each auditory feedback was used to examine three different responses as follows: (1) Non-significant response (NSR) shows that the track
of the formant deviation is irregular or approaches that on the non-perturbation feedback condition.
(2) Compensatory response (CR) shows that the track of the formant deviation is on the opposite direction of the transformed auditory feedback.
(3) Following response (FR) is contrary to the compensatory response in terms of the direction. For instance, Fig 5 shows formant deviations of one subject from 150 voice data. The point line, circle line and asterisk line show the formant deviation of the etoe, etoa and etoi conditions, respectively. For the F1 deviation (△F1), the track of the etoa condition approaches that of
etoe condition; that is, the subject’s response is NSR in the etoa condition. Furthermore, since the difference between etoi and etoe condition is visible from 608 ms and the
track of etoi condition is on the same direction of the etoi auditory feedback, the subject’s response to the etoi condition is FR on the F1. For the F2 deviation (△F2), the
etoa and etoi conditions are different from etoe condition
beginning 672 ms and their tracks are on the same directions of the etoa and etoi auditory feedback, hence the subject’s response to the etoa and etoi conditions is FR on the F2.
6. Result
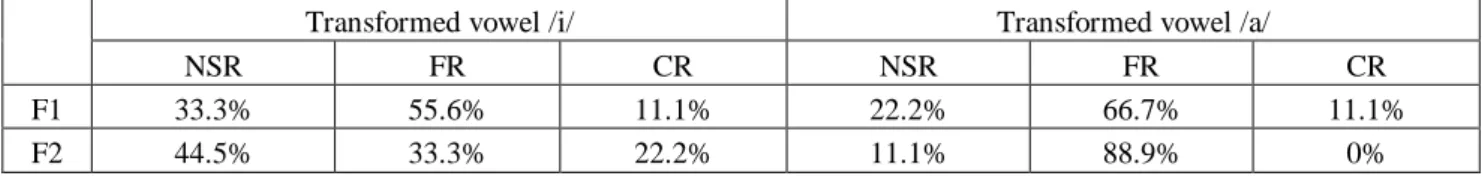
The results obtained from 9 subjects showed that the average latency of the following response (140 ms) was shorter than that of compensatory response (230 ms). Furthermore, the table 1 shows the percentage of subjects’ responses to the two transformed vowels, /i/ and /a/. F1 and F2 of subjects’ production were obviously affected by the TAF, since the percentage of NSR was not large. FR to the TAF was the major part of the three responses and the CR was the less part.
7. Conclusion
In summary, we constructed a TAF to manipulate F1, F2 and F3 on subjects’ production. The results revealed that the perturbations of the first three formant frequencies (F1, F2 and F3) influenced the subjects’ production on F1 and F2. They support the hypothesis that auditory feedback is important for F1 and F2 control. However, the general response to the influence of TAF is compensation. It is not consistent with our results. Consequently, the reason
induced these two responses to TAF needs to be clarified in the coming study.
Acknowledgements
This study was supported by a Grant-in-Aid for Scientific Research (B) (20300064) from the Japan Society for the Promotion of Science (JSPS).
References
[1] Lombard, E. Le signe de l'elevation de la voix. Mal. Oreille Larynx, 37, pp. 101-119, 1911.
[2] Lee, B. S. “Effects of delayed speech feedback,” J. Acoust. Soc. Am, 22, 824-826, 1950.
[3] Kawahara H., Kato H. and Williams J.C. “Effects of auditory feedback on F0 trajectory generation,” Proc. 4th Int. Conf. Spoken Language Processing, pp. 287-290, 1996.
[4] Burnett, T. A., Freedland, M. B., Larson, C. R., and Hain, T. C. “Voice F0 responses to manipulations in pitch feedback,” J. Acoust. Soc. Am., 103, 3153–3161, 1998.
[5] Sivasankar, M., Bauer, J. J., Babu, T., and Larson, C. R. “Voice responses to changes in pitch of voice or tone auditory feedback,” J. Acoust. Soc. Am., 117, 850–857, 2005.
[6] Tourville, J. A., Reilly, K. J., and Guenther, F. H. “Neural mechanisms underlying auditory feedback control of speech,” Neuroimage, 39(3), 1429-1443, 2008.
[7] Houde, J. F., and Jordan, M. I. “Sensorimotor adaptation in speech production,” Science, 279, 1213– 1216, 1998.
[8] Purcell, D. W., and Munhall, K. G. “Adaptive control of vowel formant frequency: Evidence from real-time formant manipulation,” J. Acoust. Soc. Am., 119(4), 2288–2297, 2006.
[9] Purcell, D. W., and Munhall, K. G. “Adaptive control of vowel formant frequency: Evidence from real-time formant manipulation,” J. Acoust. Soc. Am., 120, 966– 977, 2006.
[10] Kawahara, H., Masuda-Kastuse, I., and Cheveigne, A. “Restructuring speech representations using a pitch-adaptive time-frequency smoothing and an instantaneous-frequency-based F0 extraction: Possible role of a repetitive structure in sounds,” Speech Commun., 27, 187–207, 1999.
Table 1. The percentage of subjects for three different responses on F1 and F2. NSR = Non-significant response. CR = Compensatory response. FR = Following response.
Transformed vowel /i/ Transformed vowel /a/
NSR FR CR NSR FR CR
F1 33.3% 55.6% 11.1% 22.2% 66.7% 11.1%