Vol.8, No.2, 2021 Bulletin of the JSME
Mechanical Engineering Journal
Effect of a dual air inlet port of the 4-valve CI engine on the
swirl flow generated at the bottom region of the cylinder using
the PIV technique
Saad ALJARF*, Hardeep SINGH*, Gerard NDIZEYE*, Mitsuhisa ICHIYANAGI* and Takashi SUZUKI*
Abstract
The in-cylinder flow in diesel engines significantly affects fuel-air mixing, combustion, and emissions. The present study investigates how engine properties such as the engine speed and the intake port affect the swirl flow of a single-cylinder diesel engine. Using the obtained velocity data, the strength of the swirl flow was calculated and represented by the swirl ratio. It is observed from experiments that, the swirl flow of a diesel engine is affected by changing the engine speed and the area of the intake port, in which the center position of the swirl flow was identified during intake and compression strokes. Besides, the in-cylinder flow is also affected by the opening area of the helical port such that when the opening increases, the center of the swirl flow moves away from the center of the cavity and the swirl ratio becomes smaller. Furthermore, by reducing the aperture of the helical port a more stable swirl was acquired. The obtained experimental results revealed that the tangential port which generates a large-scale intake flow interacted with the small-scale swirl flow generated by the highly tilted helical port. Additionally, the inflow created by the helical port disturbed the swirl flow generated by the tangential port. The results also illustrated that the tangential port showed a higher amount of turbulent kinetic energy inside the piston concavity. In addition, the tangential port leads the turbulent kinetic energy to the outer periphery and the helical port resulted in the inner side of piston concavity.
Swirl, Intake ports, Engine speed, Particle image velocimetry (PIV), In-cylinder flow 1. Introduction
It is known that four-stroke diesel engines are mostly utilized in powering heavy road vehicles such as trucks, lorries, and passenger vehicles. However, due to environmental issues and challenges, stringent emission regulations are imposed to improve the fuel economy and efficiency in new vehicles. Consequently, competition among truck producers has inspired the growing research on strategies of enhancing the sophisticated power and efficacy of diesel engines while augmenting the limit of strict regulations to reduce the noxious waste discharges permitted. Recently, several studies have proposed different approaches to achieve cleaner and more efficient combustion engines. (Sullivan et al., 2004) reported that diesel engines have greater thermodynamic efficiency and less CO2 emissions. Hence, lower fuel consumption compared to gasoline engines. These prolific features make the diesel a suitable fuel to be utilized in heavy-duty vehicles. (Brijesh and Sreedhara, 2013) revealed that, indirect injection diesel engines, swirl flow and disturbance in the combustion chamber affect the mixture formation and combustion. Therefore, it is of great importance to investigate the in-cylinder gas flow in order to improve engine performance. (Stansfield et al., 2007) applied Particle Image Velocimetry (PIV) technique to determine the in-cylinder flow field of the engine under motored conditions and they produced velocity maps showing the fluid motion for a range of realistic engine speeds. (Rebault et al., 2016) investigated the design of the intake ports and performed a stationary test using a swirl meter by changing the port shape and the valve lift amount. (Huang et al., 2009; Heim and Ghandhi, 2011) changed the opening condition by the intake port of the swirl control valve and performed PIV measurements. They have closed one of the two intake ports and
* Graduate School of Science and Technology, Sophia University 7-1 Kioi-cho, Chiyoda-ku, Tokyo 102-8554, Japan
E-mail: [email protected]
Received: 18 August 2020; Revised: 14 January 2021; Accepted: 2 March 2021
managed to form a single swirl vortex to increase the swirl ratio. Further, (Zha et al., 2015) introduced a swirl center detection algorithm to investigate the swirl center movement and tilting using two swirl ratios and they have found that the swirl centers move closer to the intake valves further away from the cylinder head. From the above details, it is clear that the flow characteristics of 2-valve cylinder heads with a helical port have been extensively studied and investigated in the literature. However, these flow characteristics are known to be very different from those of the 4-valve cylinder heads. Further, the relationship between the intake port geometry and the flow pattern has rarely investigated in (Kim et al., 2014) literature. Besides, the intake flow characteristics are affected by different shapes of the intake port structure, port position in the cylinder head, and the combination patterns of the two ports. Therefore, it's of great importance to analytically study the effects of different combinations of intake ports on intake flow characteristics in order to develop high efficiency and low emissions four-valve diesel engines (Kawaguchi et al., 2009; Andreatta et al., 2008; Li Yufeng et al., 2001; Li Yufeng and Wang Zhong, 2004; Lu Z. et al., 2014; Cui L. et al., 2015).
Based on the above discussions, the main objective of this study is to analyze the co-relationship between induced vortices and port shapes. During the investigation, two different kinds of ports, i.e., helical, and tangential ports as well as their different combinations were used to generate swirl flow. Our study is to examine the swirl flow, which was generated by changing the intake helical and tangential ports opening area under non-combustion conditions. In addition, the flow characteristics of 4-valve cylinder heads are analyzed and the correlation between the port geometry and flow pattern is also examined. The high-speed PIV technique has been utilized, in order to investigate the vortices formation generated by a glass single-cylinder diesel engine. The vortices were evaluated on the basis of swirl motion, mean velocity vectors and turbulent kinetic energy (TKE). The streamlines flow, which illustrates the flow pattern of the vortices. Similarly, velocity vectors play a crucial role in understanding the direction as well as the vortex center of the swirl flow. Finally, the TKE is used to evaluate the energy distribution over the entire piston cavity.
2. Experimental setup and analysis method 2.1 Experimental setup
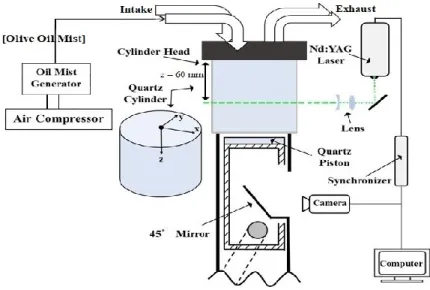
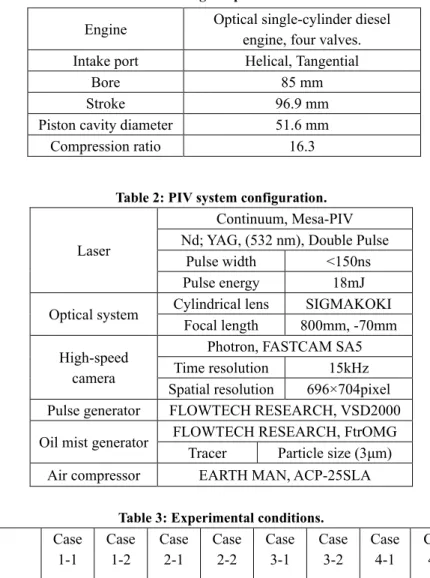
The experimental apparatus is illustrated in Fig. 1. The geometrical structure and design of the tangential and helical intake ports used in the experiments are displayed in Fig. 2. Furthermore, the specifications of the engine used in the experiments and the PIV system configuration are given in Table 1 and Table 2, respectively. This optical engine test setup is specifically developed in the experiments to enhance the development and validation of PIV approaches. The test setup features a single glass cylinder engine connected to four valves i.e., helical port, tangential port and two exhaust ports. The straight tangential port generates a large-scale horizontal swirl flow. On the other hand, the highly tilted helical port generates a small-scale swirl flow in the vertical direction which disturbs the swirl flow generated by the tangential port. In addition, the length of each intake port is 100 mm with a diameter of 27 mm. The bore and stroke were selected as 85mm and 96.9mm, respectively. For PIV measurement, the cylinder is made of quartz glass and the cavity of the elongated piston is made of sapphire glass. The gas flow in the cylinder can be observed from both sides and bottom. A fixed 45 deg. The mirror is placed under the piston to reflect the laser light sheet. The laser, double pulse Nd: YAG (wavelength 532 nm), is stretched by a cylindrical and a spherical lens. It produces a laser light sheet with a thickness of about 1 mm and then transmitted perpendicular to the engine glass cylinder. The measurement of the plane z was 60 mm from the cylinder head as the bottom position of the cylinder is the main focus of the experiment. The tracer particles are produced by an oil mist generator with an average particle diameter of 3μm. The oil particles followability of the intake air was confirmed by calculating the stokes number at each engine speed with accuracy errors less than 1%. Since the numbers are less than 0.1, it was considered that the tracer particles could sufficiently follow the intake air at 1000 rpm, and 1500 rpm engine speed and, therefore, the particles will not disturb flow movement. These particles are induced into the cylinder simultaneously with the start of the intake stroke. For capturing the tracer particles images, a high-speed CMOS camera with a frame rate of 15000 fps is used and photographing is performed with a spatial resolution of 696×704 pixels. The interrogation/inspection area is 16×16 pixels [px] and the search area is 33×33 pixels [px]. Both interrogation and search areas are 50% overlapped. Due to visual restrictions of the elongated piston, the tracer particle images could only be captured through the piston cavity of diameter 51.6 mm. A high-speed CMOS camera, laser, and engine can be synchronously captured by inputting the signal for every 2 deg. of crank angle (CA) output from the rotary encoder of the engine to the camera and pulse generator. The camera is set to snap-shoot two frames consecutively every two signals at photographing speed of 15 kHz. In the experiments, a high-speed flow up to 50 m/s is observed and due to the limitation of the laser sheet irradiation interval, the laser is adjusted within the range of the time interval of the pair image Δt at
Aljarf, Singh, Ndizeye, Ichiyanagi and Suzuki, Mechanical Engineering Journal, Vol.8, No.2 (2021)
20µs. Hence, the highest amount of movement of the particle group would be about 5 pixels which is enough for the PIV measurement. In addition, if the speed is larger than 50 m/s, the particles will disappear. However, as the speed was less than 50 m/s, the photos were captured smoothly. Note that the engine speed is varied between 1000 rpm, and 1500 rpm, which are corresponding to the mean piston speeds of 3.23 m/s, and 4.85 m/s, respectively wherein Z velocity equals to the piston speed. It is worth mentioning that the wider field of view and tracer distribution density are changed according to the crank angle. The velocity of particles is highest at the top of the piston and it decreases as moving from top to bottom of the piston. The particles with low density at the lower part of the piston were enough for the measurement points. Finally, the PIV has been sufficiently accurate as the velocity obtained from the analysis of the relative uncertainty contained in the flow is ±0.04.
In this study, the influence of the opening area of intake ports on the intake flow characteristics and center position of the swirl has been investigated. The experimental conditions are summarized and given in Table 3. In experiments, different intake port setups at two engine speeds, i.e., 1000 rpm, and 1500 rpm are configured. Two types of inlet ports, i.e., tangential and helical are examined in separate and combined scenarios. A single helical port (case 1-1, case 1-2) and a single tangential port (case 2-1, case 2-2) are firstly investigated. Then, the tangential and helical intake ports are combined (case 3-1, case 3-2). Further, the opening area of the helical port is reduced to 1/2 and 1/3 in (case 1, case 4-2) and (case 5-1, case 5-4-2), respectively, with the tangential port fully open in both cases.
Fig. 1 Experimental apparatus and PIV setup.
(a) (b)
Table 1: Engine specifications.
Table 2: PIV system configuration. Laser
Continuum, Mesa-PIV Nd; YAG, (532 nm), Double Pulse
Pulse width <150ns Pulse energy 18mJ Optical system Cylindrical lens SIGMAKOKI
Focal length 800mm, -70mm High-speed
camera
Photron, FASTCAM SA5 Time resolution 15kHz Spatial resolution 696×704pixel Pulse generator FLOWTECH RESEARCH, VSD2000 Oil mist generator FLOWTECH RESEARCH, FtrOMG
Tracer Particle size (3μm) Air compressor EARTH MAN, ACP-25SLA
Table 3: Experimental conditions. Case 1-1 Case 1-2 Case 2-1 Case 2-2 Case 3-1 Case 3-2 Case 4-1 Case 4-2 Case 5-1 Case 5-2 Engine speed [rpm] 1000 1500 1000 1500 1000 1500 1000 1500 1000 1500 Opening area of intake
port Tangential 0% Helical 100% Tangential 100% Helical 0% Tangential 100% Helical 100% Tangential 100% Helical 50% Tangential 100% Helical 33.33% Time Interval (Δt) 20μs (a pare image / 2deg.)
Measurement plane z 60 mm from the cylinder head 2.2 Analysis method
Some quantities related to the vector fields are considered to have a direct understanding of the studied flow. The
RMS
U
can be determined using Eq. (1) (Johansson et al., 1959)2 2 ( ) 1 2 RMS U = u +v (1) Naturally, for PIV configuration,
U
RMS[m/s] is the velocity root mean square,u
[m/s] is the velocity component inx
direction, and
v
[m/s] is the velocity component in y direction.In the experiment, the instantaneous velocity measurements of the swirl flow are obtained. The swirl flow contributes Engine Optical single-cylinder diesel
engine, four valves. Intake port Helical, Tangential
Bore 85 mm
Stroke 96.9 mm
Piston cavity diameter 51.6 mm
Aljarf, Singh, Ndizeye, Ichiyanagi and Suzuki, Mechanical Engineering Journal, Vol.8, No.2 (2021)
to the uniform mixing of air and fuel in a diesel engine. Furthermore, the average swirl angular velocity is calculated by using the coordinates of the computed lattice points. The in-cylinder swirl ratio is a parameter that indicates the relative intensity of the swirl of in-cylinder flow. It is defined as the angular velocity of a solid-body rotating flow, which has equal angular momentum as the actual flow, divided by the crankshaft angular rotational speed (Heywood, 1988). The total angular momentum
M
1[kg.m2.s-1] in a measured swirl plane can be estimated as the sum of the angular momentumof each velocity vector as expressed in the equation below with
k = i, j
are the indices inx
andy directions, respectively (Petersen et al., 2011). 1 n θ,k k k=1 M=
r
v
(2) Moreover, the angular momentum of a solid body rotating with an angular velocity
[rad/s] is expressed as:2
n n 2
k k k
k=1 k=1
M =
r r
.( .ω)=
r
(3)Equating the two equations,
M
1 andM
2 give the rotation rate of the in-cylinder swirl flow:cos sin i, j n n,m i,j θ,k 1 n 2 i=1,j=1 k=1 k i,j k k=1 =
v
=v
.
-
u
.
M
ω=
r
r
r
(4)Finally, the in-cylinder swirl ratio
S
R was calculated as shown in the equation below:cos sin 2 60 R n i,j i,j k i,j Engine N S =
ω
=
1
v
.
-
u
.
÷
× π
n
ω
r
(5) and, 2 -1 2 i,jy
θ =
tan
,
r
=
x
+ y
x
(6) Where, u,i j[m.s-1] and v,i j[m.s-1] denote the velocity components inx
andy directions. The position and direction ofany lattice point from the origin are represented by r,i j[m] andθ[rad] respectively.
n
depicts the total number of latticepoints in the entire swirl measurement plane and
Engine[rad/s] illustrates the rotational angular velocity of the engine.The main aspect of the swirling motion is the presence of well-defined vortices especially in the center of the cylinder region where the flow is developed. On the other hand, the region close to the valves has been dominated by a chaotic motion. In addition, the center in a flow is identified principally by a dominated single vortex. The velocity field derived from each snapshot is subjected to small fluctuations. This will lead to a continuous movement of the swirl center from one snapshot to the other. Thus, it is possible to capture how the swirl center is moving during a set of snapshots. Streamline analysis is a helpful method to directly visualize the presence of swirling motions. Moreover, for any fixed arbitrary lattice pointP,i j, in an in-plane velocity field, the function presents the average sine of the angle,θl, between the
vectors connecting the point to all other interrogation window centers and those to the measured velocities. The swirl center is determined as the lattice point with the absolute value ofГsimilar to (Laurent et al., 2001) wherein the angle
θfor each integration window could be approximately by 90 deg. It could be calculated by using Eq. (7) (Ichiyanagi et .al, 2020). , i j n l l=1 ) P
1
sΓ( )=
in(θ
n
(7)WhereP,i jdenotes the lattice point at any grid point andθlis the angle between the cylinder center and each measured
lattice point. The present study detects the lattice points with an absolute value ofГmore than 0.85 and a swirl ratio,
S
R,of more than 0.55. From the detected lattice points, the coordinates with the lowest velocity are determined as the swirl center.
3. Experimental results
3.1 Area averaged ensemble velocity
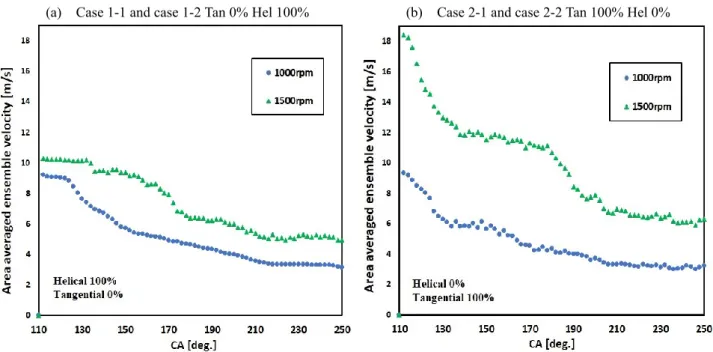
The relationship between CA and the area-averaged ensemble velocity has been illustrated in Fig. 3 for (a) case 1-1 and case 1-2 and (b) case 2-1 and case 2-2 under single helical and tangential inlet port respectively. Moreover, the results are considered for two engine speeds, i.e., 1000 rpm and 1500 rpm as shown in Fig. 3. Furthermore, the results of the tangential port in Fig. 3(b) a depict higher velocity value as compared to the helical port in Fig. 3(a). The in-cylinder flow average velocities in Fig. 3(a) for 1000 rpm and 1500 rpm were calculated and found to be 4.7 m/s, 7.3 m/s respectively. Similarly, the maximum values of the average ensemble velocities are 9.2 m/s and 10.3 m/s. The average velocities of case 2-1 and case 2-2 has been calculated and illustrated in Fig. 3(b). Moreover, the average values of ensemble velocities for the CA of 110 deg. to 250 deg. is found to be as 5.1 m/s and 9.9 m/s for 1000 rpm and 1500 rpm, respectively. Further, maximum values of ensemble velocity have been depicted at the CA of 110 deg., which are 9.3 m/s, 18.4 m/s at 1000 rpm and 1500 rpm respectively. It is evident from the obtained results that, the area-averaged ensemble velocity is inversely proportional to CA in both considered engine speeds. Additionally, in case 1-1, case 1-2, case 2-1, and case 2-2, three stages were taken into consideration: CA 110 to 140 deg., CA 140 to 180 deg., and CA 180 to 250 deg. These stages are discussed in details in subsection 3.5.
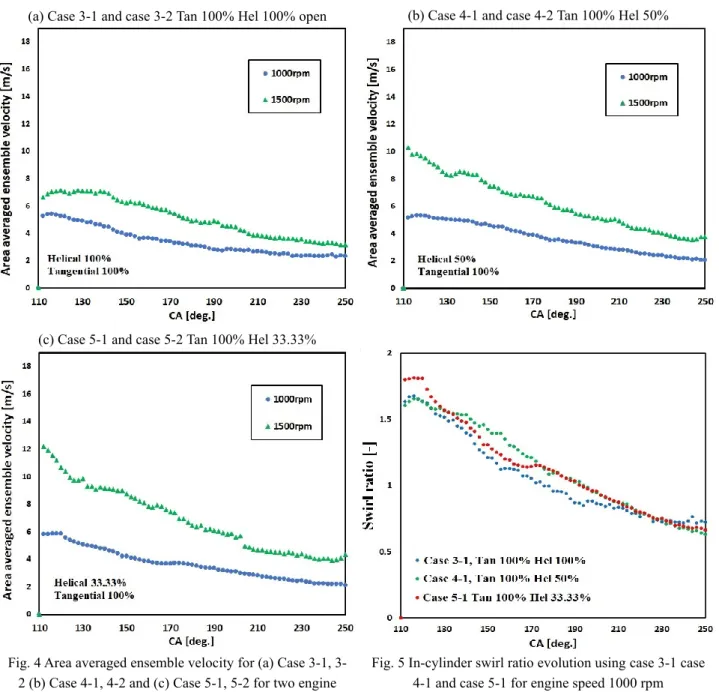
Similarly, the relationship between CA and area-averaged ensemble velocity under a combined intake port condition is illustrated in Fig. 4 for the two engine speeds 1000 rpm and 1500 rpm. To reduce the effect of the helical port on the overall in-cylinder flow, the port aperture was modified from fully open to half-open in cases 4-1 and 4-2 and one-third open in cases 5-1 and 5-2. It is observed from Fig. 4(a) that, due to the strong interference effect between the helical and tangential intake ports, the values of area-averaged ensemble velocity have been reduced. The obtained results show large values of averaged velocities in Fig. 4(b) and (c) compared to that in Fig. 4(a). This is mainly due to the reduction in the helical port open area. Moreover, the change in velocity values is noticeably larger under high engine speed for all cases compared to lower engine speed.
(a) Case 1-1 and case 1-2 Tan 0% Hel 100% (b) Case 2-1 and case 2-2 Tan 100% Hel 0%
Fig. 3 Area averaged ensemble velocity for (a) Case 1-1 and case 1-2 single helical intake port and (b) Case 2-1 and case 2-2 single tangential intake port for two engine speeds (1000 rpm and 1500 rpm)
Aljarf, Singh, Ndizeye, Ichiyanagi and Suzuki, Mechanical Engineering Journal, Vol.8, No.2 (2021)
Furthermore, a comparison study is illustrated in Fig. 5 for the in-cylinder swirl flow evolution at 1000 rpm engine speed during the intake stroke to the compression stroke (CA 110 deg. to CA 250 deg.) for three different cases of combined intake port conditions. These cases include helical and tangential intake ports both are fully open case 3-1, a tangential intake port is fully open, and the helical intake port is half-open case 4-2, and a tangential intake port is fully open and helical intake port is one third-open case 5-2. From the figure, case 3-1 depict the lowest swirl ratio value and this is due to the effect of the vertical flow generated by the helical port. However, a higher value was noticed in case 4-2 and case 5-4-2 compared to case 3-1, as the helical port aperture size decreases the value of swirl ratio increases.
(a) Case 3-1 and case 3-2 Tan 100% Hel 100% open (b) Case 4-1 and case 4-2 Tan 100% Hel 50%
(c) Case 5-1 and case 5-2 Tan 100% Hel 33.33%
Fig. 4 Area averaged ensemble velocity for (a) Case 1, 3-2 (b) Case 4-1, 4-3-2 and (c) Case 5-1, 5-3-2 for two engine
speeds (1000 rpm and 1500 rpm)
Fig. 5 In-cylinder swirl ratio evolution using case 3-1 case 4-1 and case 5-1 for engine speed 1000 rpm
The comparison of average flow velocity for all cases under-tested speeds is summarized in Table 4 and Table 5. It is evident from the results that, at both engine speeds, the highest values for average flow velocity are obtained in the case when only the tangential port is 100% open followed by the case when only the helical port is 100% open. Moreover, the average velocity of the intake stroke in the case of 1000 rpm does not change much even if the opening area of the helical port changes. However, for the higher engine speed, i.e., 1500 rpm, the increase in average velocity can be noticed as compared to the lower speed when the opening area of the helical port decreased.
Table 4: Average flow velocity of CA 110 deg. to CA 250 deg. comparison using all cases (1000 rpm) 1000 rpm Case 1-1, Helical 100% Case 2-1, Tangential 100% Case 3-1, Tangential 100%, Helical 100% Case 4-1, Tangential 100%, Helical 50% Case 5-1, Tangential 100%, Helical 33.33% Average velocity [m/s] 4.7 5 3.4 3.6 3.6
Table 5: Average flow velocity of CA 110 deg. to CA 250 deg. comparison using all cases (1500 rpm) 1500 rpm Case 1-2, Helical 100% Case 2-2, Tangential 100% Case 3-2, Tangential 100%, Helical 100% Case 4-2, Tangential 100%, Helical 50% Case 5-2, Tangential 100%, Helical 33.33% Average velocity [m/s] 7.3 9.9 5.1 6.2 6.9 3.2 Vortex streamlines
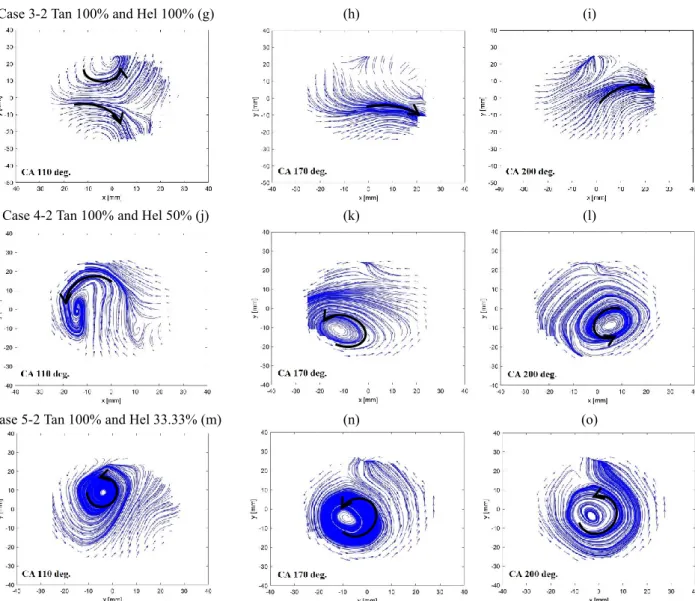
The changes in gas flow for each port condition at various CA positions, i.e., 110 deg., 170 deg. and 200 deg. with a revolution of 1500 rpm are illustrated in Fig. 6. The streamlines illustrate the flow distribution; hence, it is evident from the results of case 1-2 that, a generation of two vortices was observed at CA 110 deg. This tendency is due to the effect of the small-scale swirl flow generated by the helical port. Furthermore, in case 2-2, a single vortex was noticed close to the cavity wall at CA 110 deg. and it moved closer to the center of the cavity between CA 170 deg. to CA 200 deg. Additionally, case 3-2 illustrated a similar overall flow from CA 110 deg. to 200 deg. as case 1-2. Further, as the port opening size of the helical port was reduced in case 4-2 and case 5-2, a single swirling vortex moving in a counterclockwise direction re-appeared close to the concave wall at CA 110 deg. The reason behind this effect is related to the large-scale swirl flow created by the tangential intake port. Moreover, at the varied CA positions, i.e., 170 deg. as well as 200 deg. the vortex center can be closely observed near the outer core of the piston cavity and the inner side of the piston concavity.
Case 1-2 Tan 0% Hel 100% (a) (b) (c)
v
Aljarf, Singh, Ndizeye, Ichiyanagi and Suzuki, Mechanical Engineering Journal, Vol.8, No.2 (2021)
Case 3-2 Tan 100% and Hel 100% (g) (h) (i)
Case 4-2 Tan 100% and Hel 50% (j) (k) (l)
Case 5-2 Tan 100% and Hel 33.33% (m) (n) (o)
Fig. 6 Vortex streamlines at CA 110 deg., 170 deg., and 200 deg. for case 1-2, case 2-2, case 3-2, case 4-2, and case 5-2 (1500 rpm)
3.3 Ensemble velocities and vortex swirl center
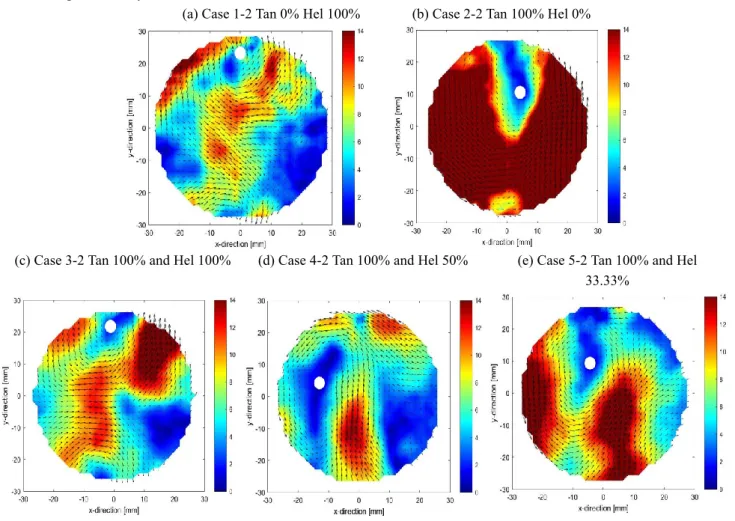
The mean velocity-vectors for in-cylinder gas flow at z = 60 mm from cylinder head are illustrated in Fig. 7 for case 1-2 (a), case 2-2 (b), case 3-2 (c), case 4-2 (d) and case 5-2 (e). The center of swirl at CA 110 deg. was shown in the white dot in the figure with a revolution of 1500 rpm. The effect of the helical port is illustrated in Fig. 7(a). The high-velocity flow remains inside the cavity. This is due to the swirl motion, which was generated with a narrow diameter, as well as the large inclination angle of the helical port as shown in Fig. 2(a). Thus, the vertical component of charged flow has a large quantity and generated a smaller diameter vortex, which remained inside the core of the piston cavity. Finally, this led to a generation of two vortices that counter directly toward each other. Moreover, comparing with the vortex streamlines, shown in Fig. 6 (a) illustrated the behavior of charged flow with generation of two large vortices countering each other. In Fig. 7 (b), the high-velocity flow remains toward the outer edge of the piston cavity. The swirl motion was generated by the tangential port which has a lower intake angle port as shown in Fig. 2(a). Hence, the horizontal component is large in quantity and lead to the outer side of the piston cavity. Furthermore, inside the cavity, the generated flow is slower than the outer side of the piston cavity. Figure 6 (d) represents the streamlines motion of the fluid particle and justified the motion of the swirl flow, which is near the outer side of the cavity wall. In addition, due to the uniformity motion of the swirl velocity of the charged flow, a single large vortex is generated, and the vortex is closer to the center of the piston cavity. The effect of 100% opening of tangential and helical ports have been shown in Fig. 7(c). and influence of the helical port is depicted in this figure, where it overcomes the effect of the tangential port on the charged flow. The
flow is remained near the core of the piston cavity and induced the two vortices, which are countering each other. However, the vortices are offset from the piston cavity. In addition, the effect of the helical port has been revealed from Fig. 6 (g), which illustrated the streamlines effect of induced vortices. The combined effect of helical and tangential port has been evaluated in Fig. 7(d). The vortex is generated at the offset of the piston core. Whilst the tangential and helical ports lead to an intermixture effect on the swirl velocity of the charged flow. The inner core of the piston cavity and the outer side of the piston concavity illustrate the higher velocity. In conclusion, the effects of fully, partially opened tangential and helical ports respectively have been shown in Fig. 7(e). Since the size of the opening of the helical port was reduced, the horizontal velocity component generated by the tangential port overcomes the effect of the helical port and resulted to a higher velocity towards the outer skirt of the piston concavity. Moreover, the vortex center can be closely observed at the axis of the piston cavity.
(a) Case 1-2 Tan 0% Hel 100% (b) Case 2-2 Tan 100% Hel 0%
(c) Case 3-2 Tan 100% and Hel 100% (d) Case 4-2 Tan 100% and Hel 50% (e) Case 5-2 Tan 100% and Hel 33.33%
Fig. 7 Mean velocity-vectors at CA 110 deg. (a) Case 1-2 to (e) Case 5-2 (1500 rpm)
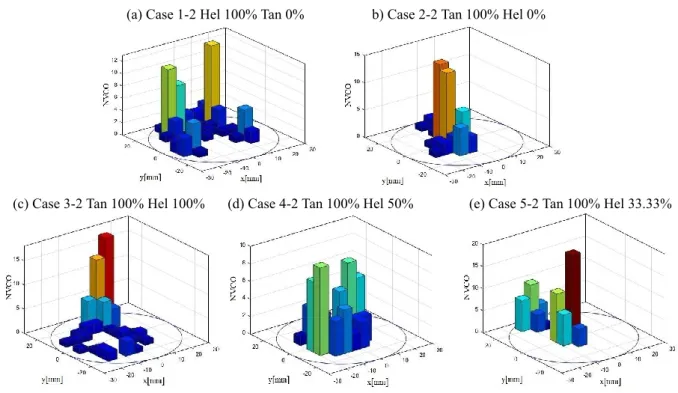
Figure 8 revealed the generation of several vortices centre (NVCO) in
x
andy directions. Comparing with Fig. 6(a) and 7(a), Fig. 8(a) elucidated that the centre of vortices is offset from the piston core. This is due to the helical port which led to a generation of large vortices. Furthermore, numerous vortices centres were inducing, and a large vortices centre has been showing near the outer verge of the piston concavity. Similarly, the effect of the tangential port on swirl flow has been represented in Fig. 8(b). Analysis with Fig. 6(d) and Fig. 7(b), it is illustrated that the lower and higher magnitude of vortices are being induced near to the centre of piston concavity and thus represented the strong generation of swirl flow near the outer wall of the piston. In addition, Fig. 8(c) provides a strong justification of the generation of higher vortices centre near to the axis of piston core. The combined effect of the helical and tangential port has been depicted in case 3-3. Co-relate with Fig. 6(g), Fig. 7(c) elucidated that the centre of the vortices repositioned near the outer edge of the piston and centre of the vortex with the highest magnitude is also moved from centre of piston cavity. Whilst Fig. 7(c) revealed that there is a generation of large vortices and the centre of vortices is near the outer skirt of the cavity. The effect of the half, fully opened the helical port and tangential port respectively has been represented in Fig. 8(d). Relatively with the case 2-3 and reference with Fig. 6(j) as well as Fig. 7(d), the vortices centres are slightly scattered from centre of the piston cavity, which reveals the partial effect of the helical port on the swirl motion. Furthermore, theAljarf, Singh, Ndizeye, Ichiyanagi and Suzuki, Mechanical Engineering Journal, Vol.8, No.2 (2021)
1/3 opened helical and fully opened tangential port illustrated the combined effect on the swirl flow vortices. Comparing Fig. 6(m) and Fig. 7(e), Fig. 8(e) clarified that induced vortices are moving toward the inner as well as the centre of the piston concavity. Although, the vortices with the highest magnitude remained toward the outer edge and the centre is depicted at the inner core of the piston cavity.
3.4 Turbulent kinetic energy
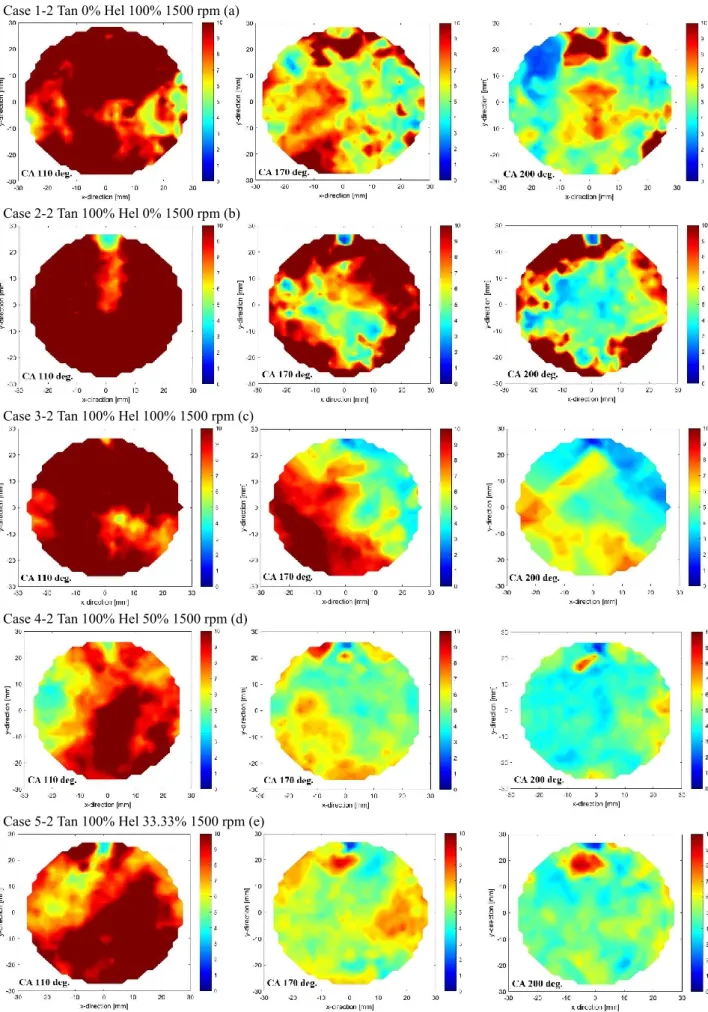
Figure 9 illustrates the distribution of TKE inside the piston cavity for different cases and different crank angles. The effect of helical as well as tangential ports on TKE has been illustrated from case 1-2 to case 5-2 at 1500 rpm. In each case of CA 110 deg., there was a high generation of TKE compared to the CA 170 deg. and 200 deg. This is due to higher mean piston velocity. Among the cases, 1-2 to case 5-2 at 110 deg., the maximum and minimum TKE is depicted in case 2-2 and case 5-2 respectively. Additionally, in case 1-2, the TKE moved towards the inner core while in case 2-2, the TKE is distributed toward the outer edge of the wall. Moreover, the case 4-2 as well as case 5-2 depicts the distortion of TKE over the entire piston concavity. Figures with cases 1-2 to 5-2 at CA 170 deg. have been represented and explained in this section. It has been observed that the maximum TKE has been induced in case 2-2 as compared to other cases. Although, the fully opened, closed tangential and helical ports respectively illustrated their effects on TKE, and led the TKE near the outer sides of the piston wall. Moreover, Fig. 6(e) and Fig. 8(b) which represent the streamlines and NVCO respectively of the swirl flow illustrated the reason for the higher generation of TKE in case 2-2. The consolidate effect of fully opened tangential and helical ports has been shown in case 3-2. It is revealed from the figure that the vortices structure formed due to the tangential and helical ports distorted each other’s TKE. In case 4-2 and case 5-2, the TKE is infinitesimally distributed over the entire piston concavity. The reason behind this is due to the distortion of the vortices structure formed by the helical and tangential ports. The minimum amount of TKE is determined in cases 1-2 to 5-2 at CA 200 deg. as a result of the smallest mean piston velocity. In case 2-2, the maximum amount of TKE is distributed toward the outer periphery of the piston concavity. Whilst the least quantity of TKE is represented in case 4-2 as well as in case 5-2. Furthermore, in the fully opened helical port and complete closed tangential port i.e., case 1-2, there was a generation of TKE close to the inner core of the piston cavity. The combined effects of the lowest mean piston velocity as well as retraction of vortices induced by helical and tangential ports led to the poor generation of TKE in case 3-2. However, the TKE is moved close to the inner core of the piston cavity.
(a) Case 1-2 Hel 100% Tan 0% b) Case 2-2 Tan 100% Hel 0%
(c) Case 3-2 Tan 100% Hel 100% (d) Case 4-2 Tan 100% Hel 50% (e) Case 5-2 Tan 100% Hel 33.33%
Case 1-2 Tan 0% Hel 100% 1500 rpm (a)
Case 2-2 Tan 100% Hel 0% 1500 rpm (b)
Case 3-2 Tan 100% Hel 100% 1500 rpm (c)
Case 4-2 Tan 100% Hel 50% 1500 rpm (d)
Case 5-2 Tan 100% Hel 33.33% 1500 rpm (e)
Fig. 9 Turbulent kinetic energy comparison using case 1-2 to case 5-2 for CA 110 deg. and 170 deg. and 200 deg. at measurement plane 60 mm (1500 rpm)
Aljarf, Singh, Ndizeye, Ichiyanagi and Suzuki, Mechanical Engineering Journal, Vol.8, No.2 (2021)
3.5 Discussion of area-averaged ensemble velocity
In this subsection, the analysis of the effect of intake port on area-averaged ensemble velocity shown in Fig. 3 has been evaluated. At higher engine speed, the averaged velocity of case 1-2 helical port fully open is lower than case 2-2 tangential intake port 100% open as shown in Fig. 3(a) and 3(b), respectively. It can be observed that the highest values were shown at CA 110 deg. to 140 deg. due to higher piston velocity. The value of area-averaged ensemble velocity slowly decreased due to the vertical flow induced by helical port into the chamber led to a generation of two vortices, as shown in vortex streamlines Fig. 6(a). Furthermore, from CA 140 to 180 deg. and compared to Fig 8(a), large generated vortices have been moved around the cavity center and as a result, the averaged velocity rapidly decreased. Moreover, it has been observed that the values between CA 180 deg. to 250 deg. started to decrease gradually as seen from Fig 9(a) wherein the TKE moved inside the piston cavity which means the generated vortices were compressed by the piston and interfered with each other. Also, area-averaged ensemble velocity of case 2-2 tangential port fully open is greater than case 1-2 helical intake port 100% open as shown in Fig. 3(a) and (b) respectively. As observed from the graph at CA 110 deg. to 140 deg. the horizontal component generated by the tangential port caused a formation of a strong single vortex as illustrated in Fig 6(d) and a high generation of TKE as shown in Fig 9(b) which led to a vast decrease in the area-averaged ensemble velocity value. However, in between CA 140 deg. and 180 deg., the area-averaged velocity value steadily reduced due to uniformity motion of the swirl velocity of the charged flow and the large vortex moved closer to the center of the piston cavity as shown in Fig 6(e). Furthermore, from CA 180 deg. to 250 deg., a fast drop in the averaged velocity value was observed as the vortex started to weaken as detected in Fig 6(f), and as a result, 3 different CA were analyzed because they showed the typical feature of vortices. Finally, in both Fig. 3(a) and 3(b), a similar tendency of averaged velocity has been obtained at lower engine speed.
4. Conclusion
The effect of engine rpms and intake port shapes on swirl flow has been investigated at different crank angles. During the investigation, the experiments were performed by varying the opening area of the helical as well as tangential port and their effects on swirl flow were concluded by measuring the velocity vectors, streamlines flow and TKE. The results were discussed as given below:
• In order to understand the flow pattern of swirl flow inside the piston cavity located at the bottom section of the combustion chamber. The streamlines of swirl flow, as well as velocity vectors for x-y plane has been concluded. It has been found from streamlines and velocity vectors of swirl fluid that the helical port plays a vital role in inducing the multiple vortices toward the inner concavity of the piston. The greater helical port opening the larger multiple vortices generation.
• Moreover, the effect of the helical port on the number of vortices center was determined. It has been revealed from the analysis that the larger opening area of helical to tangential port led to the moving of vortices center toward the axis of the piston cavity.
• Furthermore, the TKE which is the most important parameter for TKE distribution has been examined throughout the piston cavity at different engine speeds as well as different CA i.e., 110 deg., 170 deg., and 200 deg. It is determined from the analysis that the tangential port led to high magnitude TKE as compared to helical port. Moreover, partially and fully opened helical port led to the distortion of large vortices which were generated by the tangential port.
• In addition, tangential port leads the TKE toward the outer skirt of the piston concavity. Whilst the TKE is inter-related with the helical port, the larger the opening of the helical port, the higher the TKE distributed toward the inner core of the piston cavity at different CA positions. Finally, in the future, such a relationship will be clarified in 3 dimensions.
References
A.V. Johansson, S. Wallin (1959). Turbulence and transition modelling turbulence and transition modelling - lecture notes from the ercoftac/iutam summer school held in Stockholm, KTH Royal Institute of Technology.
Andreatta, É., F. Barbieri, L. Squaiella and R. Sassake (2008). Intake Ports Development: Euro. IV. Diesel Engine Cylinder Head. SAE Paper 36-0331
Cui, L., T. Wang, Z. Lu, M. Jia and Y. Sun (2015). Full-Parameter Approach for the Intake Port Design of a Four-Valve Direct-Injection Gasoline Engine. Journal of Engineering for Gas Turbines and Power, Vol. 137, No.9, 091502-11. G. Laurent, M. Marc, G. Nathalie (2001). Combining PIV, POD and Vortex Identification Algorithms for the Study of
Unsteady Turbulent Swirling Flows, Measurement Science and Technology, Vol. 12, No.9, pp. 1422-1429.
Heim, D. and Ghandhi, J. (2011). A detailed study of in-cylinder flow and turbulence using PIV. SAE International Journal of Engines, Vol. 4, No.1, pp. 642-668.
Heywood, J. B. (1988). "Internal Combustion Engine Fundamentals." Pub: McGraw Hill International Editions. Huang, R., Yu, J. and Yeh, C. (2009). Manipulating tumble and swirl flows in cylinder of a motored four-valve engine J. L. Sullivan, R. E. Baker, B. A. Boyer, R. H. Hammerle, T. E. Kenney, L. Muniz, and T. J. Wallington. (2004). CO2 Emission Benefit of Diesel (versus Gasoline) Powered Vehicles. Journal of Environmental Science and Technology, Vol. 38, No.12, pp. 3217-3223.
Kawaguchi, A., T. Aiba, N. Takada and K. Ona. (2009). A Robustness-Focused Shape Optimization Method for Intake Ports. SAE.
Kim, Y., Han, Y., and Lee, K. (2014). “A Study on the Effects of the Intake Port Configurations on the Swirl Flow Generated in a Small D.I. Diesel Engine,” J. Therm. Sci., Vol. 23, No.3, pp. 297-306.
Lu, Z., T. Wang, S. Liu, Z. Lin and Y. Han (2014). Experimental and Modeling Study of the Effect of Manufacturing Deviations on the Flow Characteristics of Tangential Intake Port in a Diesel Engine. Journal of Engineering for Gas Turbines and Power, Vol. 136, No.11, 112101- 9.
Mitsuhisa Ichiyanagi, Gerard Ndizeye, Yuji Sawamura, Reina Saito, Kotaro Takahashi, Koki Otsubo, Haoyu Chen, Suzuki Takashi (2020). Improvement of on-board in-cylinder gas flow model and wall heat transfer prediction model for ci engines using cfd analysis and piv measurements under motoring and firing conditions. SAE Technical Paper, P. Brijesh, and S. Sreedhara (2013). Exhaust Emissions and Its Control Methods in Compression Ignition Engines.
International Journal of Automotive Technology, Vol. 14, No.2, pp. 195-206.
Petersen, B., and Miles, P. (2011). PIV measurements in the swirl-plane of a motored light-duty diesel engine. SAE International Journal of Engines, Vol. 4, No.1, pp. 1623-1641.
Rebault, J., Vernet, J., Lindgren, B. and Alfredsson, P. (2016). A study using PIV of the intake flow in a diesel engine cylinder. International Journal of Heat and Fluid Flow (Part A), Vol. 62, pp. 56-67.
Stansfield, P, Wigley, G, Justham, T, Catto, J, Pitcher, G (2007). PIV analysis of in-cylinder flow structures over a range of realistic engine speeds. Exp Fluids, Vol. 43, pp. 135-146.
Yufeng, L. and W. Zhong (2004). Experimental Study of Formation of Intake Swirl in the Cylinder of A 4-Valve Diesel Engine. ACTA Armamentarii, Vol. 25, No.1, pp. 113-115.
Yufeng, L., G. Xiaohui, W. Hai, L. Shuliang and X. Sidu (2001). Effects of Combination and orientation of Intake Ports on Swirl in Four- Valve DI Diesel Engines. Transaction of CSICE, Vol. 19, No.3, pp. 209-214.
Zha, K., Busch, S., Miles, P. C., Wijeyakulasuriya, S., Mitra, S., and Senecal, P. K. (2015). Characterisation of Flow Asymmetry During the Compression Stroke Using Swirl-Plane PIV in a Light-Duty Optical Diesel Engine with the Re-entrant Piston Bowl Geometry. SAE International Journal of Engines, Vol. 8, No.4, pp. 1837-1855.
by inlet deflection valve. Journal of Mechanics, Vol. 24, No.4, pp. 345.