Hierarchy Clustering of Dwellings inside Informal Settlements Case Study: Biryogo Residential Precinct, Kigali City – Rwanda
23
0
0
全文
(2) Urban and Regional Planning Review Vol. 8, 2021. | 51. After the genocide of 1994, a defining period in the city’s history, Kigali city has known a continuous growth mostly due to the massive repatriation of refugees whose majority targeted the capital city. “Migration is the demographic process that links rural to urban areas, generating or spurring the growth of cities” (Salim Neema, 2015). In the same context, the pressure of internal rural to urban migration and a high annual population growth of 2.6% (World Bank, 2019) resulted into administrative reforms leading to an unprecedented expansion of Kigali city, jumping from 314 km2 in 2000 to 730 km2 in 2005 (Kigali city archives, 2019). The city’s urbanization followed a concentric urban land use model, expending from the CBD, to low and medium-class residential areas and to modern high-class housing in the suburbs (University of Rwanda, 2018). A High deficiency between the housing demand and offer resulted to the proliferation of informal settlements in all corners of the city. According to Planet Consortium (2012), “Total housing requirements in Kigali city by 2022 are projected to be 458,265 dwelling units. These requirements could be met by maintaining part of the existing housing stock that is in good condition or upgradeable (114,197 DU) plus building of new dwellings (344,068 DU)”. Rwanda Housing Authority carried out a housing stock survey in 2012. It revealed that among the 223,000 dwelling units existing at that time, 19.15% were in good conditions, 32.06% recommended for upgrading and 48.79% to be replaced (Aime T. and Roger M., 2018). This situation is not unique for Kigali city; Nazire Haroon (2016) conducted a study in Kabul city–Afghanistan and found that 63.2% houses in the studied areas were in poor physical conditions condition, 25% are in moderate conditions, while only 14.7% were in good conditions. Napier (2002) found that there are countries having equal rates of informal settlements, despite the fact that they have varying levels of urbanization, namely: Burkina Faso with 12.4%, Congo with 11.8%, and South Africa with 11.6%. Generally, in developing regions, “the need for decent affordable housing is particularly acute” (UN-Habitat, 2012). At a global level, UN-Habitat (2018) described a slum as “the physical and spatial manifestation of urban poverty and intra-city inequality”. On one hand, UN-Habitat defines a slum household as anyone deprived of one or more of the following conditions: (i) access to improved water; (ii) access to improved sanitation facilities; (iii) sufficient living area–not overcrowded; (iv) structural quality/durability of dwellings; and (v) security of tenure. This perception resembles to the Haroon Sajjad’s (2014) slums household’s condition indicators, namely: construction materials, access to drinking water, sanitation facilities, wastes disposal, family size, and access to healthcare. On the other hand, UN-Habitat (2018) describes informal settlements as residential areas whereby: (i) inhabitants have no security of tenure vis-à-vis the land or dwellings they inhabit. (ii) The neighborhoods usually lack, or cut off from basic services and formal city infrastructure. (iii) Housing may not comply with current planning and building regulations; it is often situated in geographically and environmentally hazardous areas, and may lack a municipal permit. UN-Habitat argues that informal settlements can result from real estate speculation practices that do not necessarily adhere to urban codes, making them poorly planned and unauthorized. The same organization concludes, “Slums are the poorest and most dilapidated form of informal settlements”. According to UN-Habitat (2017), “generating evidence-based knowledge on informal settlements and slums enhances the capacity of stakeholders to develop inclusive citywide plans”. In this regards, this research targeted the upgradable part of housing stock, with a main objective.
(3) Urban and Regional Planning Review Vol. 8, 2021. | 52. to describe in detail informal settlements’ infrastructures and services status quo by evidencebased scientific data to contribute strengthening the socio-economic development of a household, as argued by Beat W. and John M. (2017). Different activities in urban areas crystallize professional and occupational roles, which in turn are attached to positions that help provide access to the daily needs and wishes in life, such as shelter, health care, education, to mention but a few. UN-Habitat (2003) argued, “In varying degrees, these positions form hierarchical structures in which some people have more wealth and power than others”. In order to alleviate the worsening living conditions of informal settlements’ poor dwellers without disrupting their community networks and livelihood opportunities, the best approach is the on-site upgrading. Mercy, Elena and Gubevu (2017) stated, “Physical improvements and a full package of basic services are absolutely crucial to improve the living conditions, reduce vulnerabilities and improve the safety of informal settlement dwellers”. Banashree Banerjee et al. (2012) mentioned the streets as the “starting point for a physical integration of informal settlements into the formal and official systems of city planning”. Furthermore, Daniel Ehebrecht (2017) stated that “technical upgrading of informal settlements can have immense positive effects on the respective beneficiary community’s well-being: through installation of rainwater drainages, sanitation facilities, sewages and the provision of potable water, health conditions can improve greatly”. Providing basic infrastructures and services revealed to be the key focus for sustainable physical informal settlements upgrading. Koen Olthuis, et al. (2015) carried out a study on 88 informal settlements areas and found that “investment into physical slum upgrading is predominantly focused on the provision of basic needs for health and safety”. According to the Kigali City Master Plan (OZ Architecture et al., 2013), the study area is a precinct within upgradable informal settlements. Therefore, findings from this study will guide for a sustainable on-site upgrading approach, hence improve the quality of life of the urban poor. While a recent study on the precinct suggested the on-site upgrading approach (Institute for Energy and Environmental Research, Kigali city and UN-Habitat, 2015); there are no prompt details on key parameters for housing status, accessibility networks and sanitation situation. These three parameters are the most common challenges for the urban poor as highlighted by Joshi Deepa (2020) in a comparative study among informal settlements in Bangladesh, Kenya and India. In order to alleviate the gaps in information for onsite informal settlement upgrading, we designed this study to address answers to following main questions. (i) Are there any forms of hierarchical clusters among the households? If yes, what have been the main causes? (ii) Are there any relationships among the building typologies, sanitation conditions and accessibility network levels? (iii) According to indicators and thresholds for defining informal settlements and slums, how does the study precinct qualify? (iv) What is the key infrastructure and/or service defining the current socio-economic standpoint of the study precinct? (v) How is the housing status in terms of durability and overcrowding, as pre-defined by the United Nations Human Settlement Program? How about the space and density requirements as recommended by the World Health Organization for healthy housing? (vi) How is the housing stock status in the precinct when compared to citywide scale? (vii) Does the current sanitation situation comply with the minimum standards set by the World Health Organization? This study’s findings will redound to developing world cities’ informal settlements and slums upgrading efforts; considering that it will contribute to a better understanding of their inner challenges. Administrators and implementers of cities’ plans will focus on what is essential while considering the onsite upgrading option..
(4) Urban and Regional Planning Review Vol. 8, 2021. 1.2. Study area background. Figure-1: Study area location. Figure-2: Study area historical location context (4). | 53.
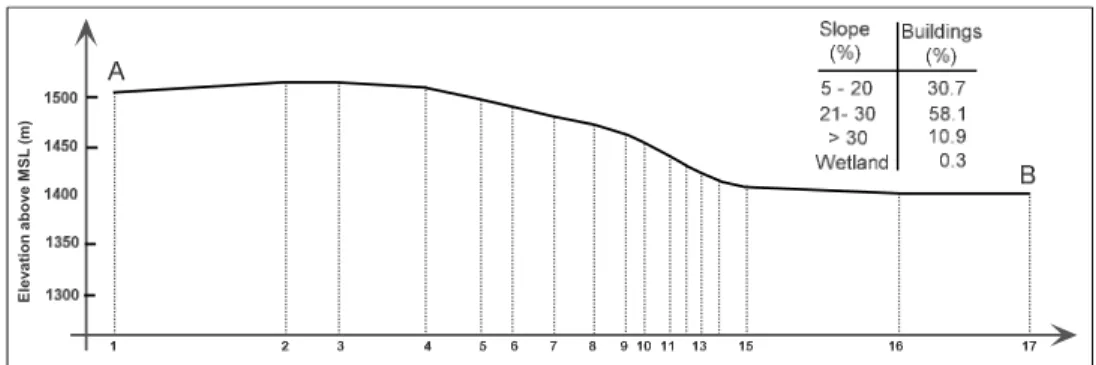
(5) Urban and Regional Planning Review Vol. 8, 2021. | 54. The study area as shown on Figure-1 above is one of the suburbs of the Central Business District (CBD). With a density of 4,605 inhabitants/km2 by 2017 (National Institute of Statistics of Rwanda, 2017), the area is one of the most densely populated in Rwanda (5). Due to its strategical location to the CBD, the area was the first informally settled in the history of the CoK. Pioneer settlers of the area were local employees of the governing colonial regime, followed later by medium, small size as well informal business people. Owing to the settlement history of the study area, from 1900’s until a decade ago, it has unique character of building typologies and materials, as shown on Figure-3 below. Figure-2 above shows the location context of the study area with respect to the newly created Kigali city. The very first physical plans concerned a single hill, following its crest and the gentle slopes of the hillside. The study area was located on the continuity of the same hill, just whereby the physical planning stopped by that time. This strategic location of the study area near the CBD made it to become the target zone of new housing demands. Hence, the area became the cradle of unplanned dwellings since the early age of Kigali city until a decade ago. Therefore, the precinct’s historic unique character led our choice for a research sample to understand the complexity of informal settlement throughout the historical development of Kigali city.. Figure - 3: building typologies throughout settlement history (Source of photos: author’s field survey, September 2019) The study area has a highly varying topography in elevation above mean sea level (MSL), ranging from 1540 meters to 1410 meters. As shown on Figure-5 below, most of the buildings (69%) are located on slopes greater than 20% and about 11% among them built on high risks zones(6). This high number of buildings on sloppy ground mostly relates to typologies 5, 6 and 7 on Figure-3 above..
(6) Urban and Regional Planning Review Vol. 8, 2021. | 55. Figure-4: Hilly structure of Kigali city and topography of the study area Moreover, according to the longitudinal profile from the section AB (Richard, 2004) on Figure-4 through the study area, this high percentage of buildings on high slopes occupy a small area (from point 7 to 14 of the profile AB, Figure-5 below) compared to buildings on flat and gentle slope terrain. Therefore, it reflects a high concentration of dwellings units on sloppy ground than on gentle slope terrain..
(7) | 56. Elevation above MSL (m). Urban and Regional Planning Review Vol. 8, 2021. Figure - 5: Longitudinal profile from section AB on Figure - 4. 1.3.. Existing socio-economic conditions. The study area is predominantly residential with random commercial shops along the access roads and footpaths. Some houses are mix-used as residence and small-scale home-based business, like hair salons, tailoring, boutiques, to mention but a few. While the World Health Organization (1988) suggested the minimum margins for space and density requirements, 78.3% of total plots fall in the range of 200m2 – 300m2, whereas the remaining 21.7% plots are 300m2 and above. The wetland at the foot of the study area is dominated by cultivation of short-term crops and dairy farming. Due to the unplanned settlement, 70% of dwellings have no vehicular access, as noticed from Figures 6 and 7 below, with poor conditions footpaths eroded by storm water.. Figure-6: Accessibility scenarios in the study area (Source of photos: author’s field survey, September 2019) Overall, the mobility in the study area is highly dominated by randomly distributed and irregular in size footpaths. Scarce bitumen paved roads are supplemented by cobble paved roads (cheaper in construction cost and easier maintenance but provide low level of service) and earth.
(8) Urban and Regional Planning Review Vol. 8, 2021. | 57. roads (irregular in sizes, muddy in rain season and dusty in dry season and mostly damaged by soil erosion and runoff water after rain). The current mobility network is a combination of different historical backgrounds. Referring to the Figure-7 below: Early colonialists traced the roads network of the zone shaded in black to serve the residences of their servants. Early government after the independence created the roads within the red shade, to serve the residences of military officers of the newly nearby built military camp. The local government administration created the roads network colored yellow to serve the health center, the two schools as well as the agricultural farms in the wetland. Owing to its ongoing efforts to upgrade on-site the area, the city of Kigali opened the roads network colored green to serve as not only a central distributor corridor, but also easy accessibility to the market and the health center. Landowners (residents or institutions) created some short access roads, whereby they dealt privately to buy a strip of land according to availability or the access width needed. The irregular and randomized footpaths networks are the direct results of a highly disordered plots layout. The more informal settlers fragmented the precinct, the more footpaths augmented at a high rate, each household struggling to find a way for its accessibility.. Figure-7: Accessibility networks throughout history Concerning the public services and utilities, the importance of adequate water supply and sanitation services as drivers for social and economic development, poverty reduction and public health, are fully acknowledged in Rwanda’s flagship policy documents and political goals..
(9) Urban and Regional Planning Review Vol. 8, 2021. | 58. In the study area, 77.2% of dwellings own private water connection from the main water supply pipe. However, there is a routine daily water shortage and cutoffs and residents mostly rely on public water kiosks (image 9 on Figure-8 below). Other sources of water for domestic use include water vendors, borehole and river water. Regarding the drainage of wastewater and storm water, only 24% of the total water drainage network is improved. Considering the sloping character of this area, the storm water becomes a big challenge in heavy rain season, causing the soil erosion, landslides and sometimes loss of human lives due to total or partial collapsing of buildings. About the electricity supply, medium and low voltage electrical lines serve the study area; 76% of residents have access to electricity used mainly for lighting and plugging home appliances like television, radio, refrigerators and mobile phones charging. However, the lighting does not extend to streets and footpaths most of which are dark alleys after nightfall. This further explains a high level of poor accessibility in the area.. Figure-8: Public utilities and services (Source of photos: author’s field survey, September 2019) Apart from poor access streets and footpaths, residents face troubles to reach their homes when it is dark at night due to lack of public lights and scarce private lights. Moreover, the mobility becomes almost impossible after rain because of high velocity runoff, mostly following the footpaths due to scarce rainwater drainage trenches. Figure-8 above highlights the status of public utilities and services in the study area. Figure-9 below summarizes the existing socio-economic conditions analysis throughout the concerned area. Apart from their primary functions, schools, churches and mosques yards and/or play fields provide the only public spaces for residents’ socio-cultural entertainment and gatherings. In addition to primary routine health services, the health centers organize regular counseling and training on both public health and reproduction health to alleviate both high risks of communicable disease propagation and rapid population increase. Due to frequent water shortage and/or cutoffs, water kiosks supply water to majority of residents..
(10) Urban and Regional Planning Review Vol. 8, 2021. | 59. Figure-9: Existing socio-economic conditions About the economic standpoint, the study area has three main key actors: (i) the market and its neighboring mixed-use zone are the economic hub hosting various formal and informal businesses like selling clothes and shoes, fresh foods, restaurants, sewing worships, reparation workshops, street garages for cars and motorcycles, to mention but a few. (ii) The central corridor road, with a mixed-use character, is also a host of different income generating activities like neighborhood boutiques selling routine home necessities, shaving saloons, fresh vegetables from the nearby wetland, fast food restaurants, to mention but a few. (iii) The wetland’s farms produce different kinds of fresh tropical vegetables in all seasons of the year (in dry season the river’s water is used to irrigate the farms). Thereby creating a kind of permanent jobs for farm workers and regular income for farmers.. 2. Methodology We carried out a field surveys in May 2018 and in September 2019 and we collected data by on-site measurements, observations, and questionnaires. We selected survey samples by stratified random sampling (David Walonick, 2007), whereby we divided the whole population (households) into groups of comparable characteristics. Then, within each group, we selected a random cluster sample, keeping the proportionality between the sizes of samples to the size of the groups. The total number of households from the chosen random cluster samples summed up 401. Because of time and financial constraints, the population was too large to carry out a comprehensive socio-economic survey and analysis of all of the households. Therefore, we applied a statistical methodology for computing the appropriate sample size with help of.
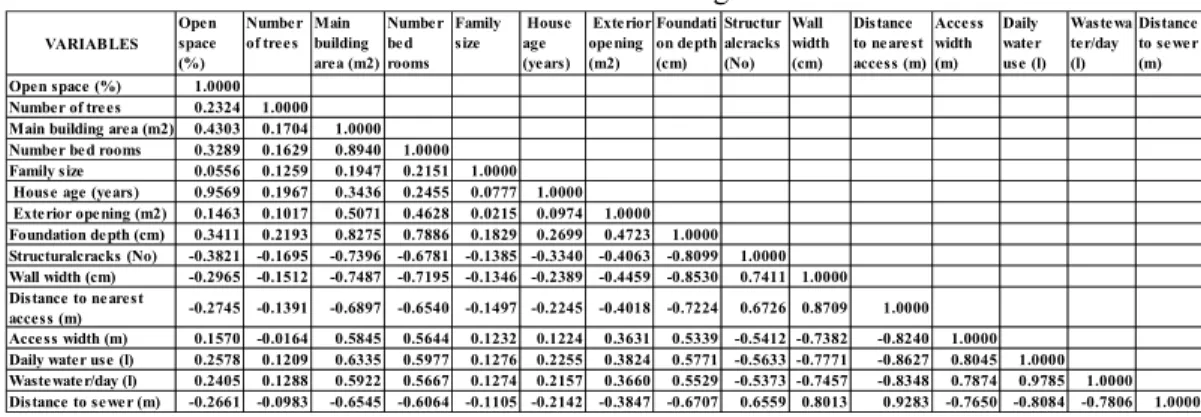
(11) Urban and Regional Planning Review Vol. 8, 2021. | 60. Yamane’s formula (7) (Yamane T., 1973) and we found 200 households as a representative population sample. From first impression, an observation reveals that the settlement structure of the study area have been following a certain clustering order due to historical patterning as well as socioeconomic conditions and increasing housing demand. Guided by this observation, we collected data into various numerical variables. Data were collected systematically, starting from the housing characteristics, accessibility situation and finally to sanitation conditions. In order to highlight possible relationships among different entities of collected data, we relied to Principal Components Analysis (hereinafter referred to PCA) in order to reduce its dimension to a small set that still contains the information in the large set. We took the decision of using the PCA as data processing method after preliminary data examination. Regarding the sample size, the number of observations (178) in this research met the requirement to be factor analyzed. As a rule, the sample size should be 100 or larger. Generally, the minimum is to have at least five times as many observations as the number of variables to analyze, and the more acceptable sample size would have a 10:1 ratio (Joseph F. et al, 2014) (8). We carried out more advanced statistical tests to assume that enough structure does exist for our data to be factor analyzed. In this regards, we checked the Measure of Sampling Adequacy (MSA) to quantify the degree of inter-correlations among the variables and the appropriateness of factor analysis. We found a MSA of 0.875, qualified as meritorious (9) to carry out our data analysis by PCA. After checking the reliability of analyzing our data by PCA, we instructed the processing software to extract eight clusters based on k-means clustering algorithm as well as the size and characteristics of our data. In this regards, based on rules and regulations of PCA, we extracted four factors and eight clusters that summarize the hierarchical socio-economic settlement formations of the study area.. 3. Outcomes of data analysis Housing reflects social, cultural and economic situation of any society and it affects the health, welfare, social attitude, psychological and economic productivity of an individual person (Julia J. Mundo-Hernández, et al., 2014). Moreover, according to the World Health Organization, there are interrelated dimensions that need to be considered when carrying out a housing analysis (WHO, 2011): - The dwelling: in terms of its construction, materials and interior quality; - The immediate built environment including infrastructure and transportation; - The community: which relates to the social environment, characteristics of the residents and local community services. Based on the above statements, we collected data related on housing characteristics and its surrounding built environment data in order to understand the socio-economic standpoint of the community in the study area. Referring to the main objective of this research and considering that all variables are metric, a correlation value does exist among all variables. In this regards, we preferred the R-type factor analysis whereby we used the correlations among variables matrix as the basic data input. Table-1 below shows the extracted correlation coefficients among variables. A visual inspection of the correlation matrix reveals that there are enough substantial number of correlations (10) to carry out factor analysis..
(12) Urban and Regional Planning Review Vol. 8, 2021. | 61. Table – 1: Correlation among variables Open Number Main Number Family space of trees building bed size VARIABLES (%) area (m2) rooms Open space (%) 1.0000 Number of trees 0.2324 1.0000 Main building area (m2) 0.4303 0.1704 1.0000 Number bed rooms 0.3289 0.1629 0.8940 1.0000 Family size 0.0556 0.1259 0.1947 0.2151 1.0000 House age (years) 0.9569 0.1967 0.3436 0.2455 0.0777 Exterior opening (m2) 0.1463 0.1017 0.5071 0.4628 0.0215 Foundation depth (cm) 0.3411 0.2193 0.8275 0.7886 0.1829 Structuralcracks (No) -0.3821 -0.1695 -0.7396 -0.6781 -0.1385 Wall width (cm) -0.2965 -0.1512 -0.7487 -0.7195 -0.1346 Distance to nearest -0.2745 -0.1391 -0.6897 -0.6540 -0.1497 access (m) Access width (m) 0.1570 -0.0164 0.5845 0.5644 0.1232 Daily water use (l) 0.2578 0.1209 0.6335 0.5977 0.1276 Wastewater/day (l) 0.2405 0.1288 0.5922 0.5667 0.1274 Distance to sewer (m) -0.2661 -0.0983 -0.6545 -0.6064 -0.1105. House age (years). Exterior Foundati Structur Wall opening on depth alcracks width (m2) (cm) (No) (cm). 1.0000 0.0974 0.2699 -0.3340 -0.2389. 1.0000 0.4723 -0.4063 -0.4459. 1.0000 -0.8099 -0.8530. -0.2245. -0.4018. -0.7224. 0.1224 0.2255 0.2157 -0.2142. 0.3631 0.3824 0.3660 -0.3847. 0.5339 0.5771 0.5529 -0.6707. Distance Access to nearest width access (m) (m). Daily water use (l). Wastewa Distance ter/day to sewer (l) (m). 1.0000 0.7411 1.0000 0.6726 0.8709 -0.5412 -0.5633 -0.5373 0.6559. -0.7382 -0.7771 -0.7457 0.8013. 1.0000 -0.8240 -0.8627 -0.8348 0.9283. 1.0000 0.8045 0.7874 -0.7650. 1.0000 0.9785 -0.8084. 1.0000 -0.7806. 1.0000. Figure-10 below shows the scree test’s plot whereby only four factors have eigenvalues greater than 1(11) and explain a cumulative variance of 80.68%. These factors will represent the structure of the variables in the analysis.. Figure - 10: Determination of the number of factors and total variance explained Shown below, in Table-2, are factors loadings. They indicate the degree of correspondence between the variable and the factor, with higher loadings making the variable representative of the factor, therefore helped in naming the factors. Table-3 shows the clusters scales and their average values to principal components. We decided the clusters names based on careful check of all factors loadings, starting with the first variable on the first factor and moving horizontally from left to right, looking for the highest loading for that variable on any factor. We repeated the process and checked all eight clusters loadings to the four factors. A visual check on Table-2 below shows that: the component 1 has higher positive loadings on following variables: building area, number of bedrooms, foundation depth, access width as well daily water used and wasted. All these conditions reflect large strong houses with good accessibility to public utilities and services. This component is mostly composed by new modern houses owned by high-income people. The component 2 records higher positive loadings on open space and house age variables; this denotes the character of old houses built on large plots. This component is characterized by old style houses mostly built in large plots during colonial period by local colonialists’ employees. The component 3 shows a moderately high negative loading on house age as well as on public utilities and services. These conditions reveal newly built informal houses in located in areas with.
(13) Urban and Regional Planning Review Vol. 8, 2021. | 62. poor public infrastructures and services. Lastly, the component 4 has the highest positive loading on family size and records too small positive loadings to public infrastructures and utilities. Moreover, this component loads mostly negative to plot size and building area as well as house structural stability. Table - 2: Factors loadings Variables. 1 Open space (%) 0.431456568 Number of trees 0.200033683 Main building area (m2) 0.865897879 Number bed rooms 0.821306133 Family size 0.195402036 House age (years) 0.369890486 Exterior opening (m2) 0.52800384 Foundation depth (cm) 0.854618671 Structuralcracks (No) -0.808842684 Wall width (cm) -0.918186895 Distance to nearest -0.920668405 Access width (m) 0.802233527 Daily water use (l) 0.867807887 Wastewater/day (l) 0.841180106 Distance to sewer (m) -0.875088696 Better Factors housing conditions. Components 2 3 0.839953531 -0.275686591 0.365662991 0.320406613 0.136988192 0.256581663 0.059315597 0.318964637 0.077527226 0.423218554 0.846311177 -0.32681334 -0.05381906 0.301072965 0.079850977 0.321723332 -0.12684314 -0.186009044 0.103614789 -0.027869012 0.190299783 0.154209667 -0.32151163 -0.247151268 -0.21932418 -0.287688042 -0.2259851 -0.300931104 0.18832593 0.180569501 Old houses New houses in large in poor plots conditions. 4 -0.03153098 0.345094527 -0.1514455 -0.11880137 0.742890472 0.015944773 -0.40809926 -0.14574666 0.149773306 0.037120827 -0.09724117 0.09138235 0.166977249 0.189674704 -0.05735794 Big families houses. The variable “number of trees” has neither higher positive nor negative loading on any principal component; this tells us that there have been no orderly or planned trees planting in the study area. In order to assess the significance of the extracted factors, we checked their normality, as shown on Figure-11, compared to the normal distribution. The first factor has a flatter distribution and slightly skewed on the left side; the second factor is slightly skewed on the right side; the third and fourth factor follow the path of the normal distribution graph with some minor deviations. From a statistical standpoint, all the four factors are significant enough for the observed correlations.. Figure – 11: Normality of principal components. 4. Results and discussions 4.1. Determination of clusters memberships “The primary objective of cluster analysis is to define the structure of the data by placing the most similar observations into groups. The procedure must group those observations that are most similar into a cluster, thereby determining the cluster group membership of each observation for each set of clusters formed” (Joseph F., et al., 2014). In this research, a data processing software(12) did the sorting of the most similar observations (households) into eight groups (clusters). Thereafter, we did a scatterplot representation of all 178 observations and we looked at each observation’s membership (from the sorting done by the software) among the eight groups to trace what we termed as “original clusters”, as shown on Figure-12 below. Focusing on practical, not statistical, significance and having a sample size greater than 100(13), also considering significance as the criteria, we can assess the loadings as follows: (1) Factor loadings between ± 0.30 and ± o.40 are considered to meet the minimal level for interpretation of structure. (2) Loadings ± 0.50 or greater are considered practically significant. (3) Loadings exceeding 1.70 are considered indicative of well-defined structure and are the goal of any factor analysis..
(14) Urban and Regional Planning Review Vol. 8, 2021. | 63. Cluster. Scale. Table-3: clusters’ loadings to principal components. 1 2 3 4 5 6 7 8. 36 18 37 18 12 26 16 15. Better housing Old houses New houses in Big family conditions in large plots poor conditions houses PC1 -0.882998674 -1.26551916 3.468158945 2.111436654 -1.086442048 -1.95919189 -5.422271469 2.598146234. PC2 0.47968178 0.905403118 -0.572334968 -1.130141723 3.109529645 -1.004466027 -1.100662161 0.957700069. PC3 1.187209281 -0.495215354 0.157675938 -0.891194712 -0.822263567 0.534052379 -0.861409974 -0.923586684. PC4 0.321558009 -1.16330481 0.554931827 -0.38823013 0.340543212 -0.45202793 0.637118841 -0.44724214. In order to delimitate different clusters based on different respondent’s memberships, we considered their twodimensional distribution with respect to the first two principal components as illustrated on Figure-12 below.. Figure-12: Data values and scatterplot of the 178 observations (households) based on the 15 clustering variables. 4.2. Clusters naming In order to find representative and meaningful names of clusters, we firstly grouped related variables into sub-sets, each one defining a specific character. Table-4 below shows the subsets. After grouping related variables into sub-sets, we calculated the average values of houses sharing same membership to clusters and for all variables. Table-5 summarizes the resulted values..
(15) Urban and Regional Planning Review Vol. 8, 2021. | 64. Table-4: Subsets of variables Subsets House age House scape Construction materials (14) and structure Sanitation. Variables House age Open space, Number of trees Foundation depth Structural cracks, Wall thickness Daily water use, Wastewater /day, Distance to sewer. Subsets Ventilation and aeration Interior comfort Accessibility. Variables Building area, Exterior openings Number of bedrooms, Family size Distance to nearest access , Access width. Table-5: Average values of clusters’ members Hou se age. 70.71. 2.93. 3.00. 6.43. 51.07. 1.46. 25.50. 24.75. 1.79. 82.14. 59.29. 24.00. 1.39. 62.28. 2.89. 2.44. 3.11. 44.72. 1.61. 25.61. 27.06. 1.67. 72.78. 50.56. 24.44. Distance to sewer (m). Waste water /day (l). Access width (m). Foundation depth (cm). Daily water use (l). 2.82. 38.94. Distance to nearest access (m). Family size. 27.07. 20.00. Wall thickness (cm). Number bed rooms. 12.61. 2. Structural cracks (No). Exterior opening (m2. S an i tati on. Main building area (m2). Acce ssi bil ity. Open space (%). Number of trees. C on stru ction m ate rials an d stru cture. House age (years). Inte ri or com fort. 1. Clusters Average values. Ve n ti lati on an d ae ration. Hou se scape. 3. 15.30. 30.27. 2.35. 84.54. 3.51. 3.78. 6.35. 61.08. 0.38. 22.16. 5.78. 5.01. 192.43. 145.95. 8.27. 4. 12.89. 26.72. 1.17. 74.33. 3.06. 3.28. 4.00. 54.44. 0.94. 22.83. 7.00. 4.49. 172.78. 127.22. 8.61. 5. 37.17. 59.92. 2.33. 62.83. 2.58. 2.50. 5.17. 34.58. 2.00. 26.33. 28.17. 1.56. 83.33. 60.00. 31.00. 6. 5.00. 11.43. 1.26. 59.78. 2.87. 2.39. 4.96. 41.96. 2.04. 25.83. 27.57. 1.70. 70.43. 49.78. 27.78. 7. 3.67. 5.60. 1.00. 39.40. 2.07. 1.27. 4.73. 0.00. 4.33. 29.53. 40.73. 1.27. 55.33. 38.67. 38.00. 8. 28.93. 50.47. 1.87. 81.20. 3.40. 3.33. 4.47. 56.33. 0.60. 23.13. 8.53. 3.93. 162.67. 117.33. 9.00. Table-6: Guidelines values for clusters naming GENERAL GUIDELINES. 1 House age : (ye ars): T he age impact depends on the Moderate construction materials and the structure condit ions House scape (buil ding cove rage rati o %):. 2. 3. C LUSTERS C HARAC TERISTIC S 4 5 6. Old. moderate. moderat e. Old. New. 7 New. 8 old. 100-70:poor , 69-50:moderat e, 49 and below:good. 62.9%: moderat e. 61.1%: moderate. 68.1%: moderate. 73.3%: poor 40.2%: good 88.2%: poor. 94.4%: very 49.5%: good poor. Ve nti lati on and ae rati on (% of ope ni ngs to bui lding are a):. 4.1%: poor. 4.6%: poor. 4.2%: poor. 4.1%: poor. 4.8%: poor. 5.3%: poor. 4.2%: poor. 2.1: tolerable. 1.3: 1.7: 1.2: 2.1: comfortable comfortable comfort able t olerable. 2.1: tolerable. 3.7: unbearable. 1.3: comfortable. Stable mud blocks. Stable mud blocks. Narrow access. T iny access Wide access Wide access T iny access T iny access T iny access Wide access. 4.3%: poor. 0 – 9: poor, 10 – 20: moderate, Above 20: good Inte rior comfort (pe opl e /be droom): <2: comfort able, 2-3: tolerable,>3:unbearable C onstruction mate rial s and structure W al l thickne ss (cm) 22-24: burnt bricks or cement blocks, 24.1-26: mud blocks, Above 26cm: wood and mud. Foundati on (cm). C racks (numbe r). 0: critical, 300-1: strong, 1.149.9: shallow, 1.9:st able, 2- 3: 50 and above: inst able, >3:critical deep. Strong St rong burnt cement bricks blocks. Stable mud blocks. Critical Inst able mud wood and blocks mud. Strong cement blocks. Acce ssi bili ty Di stance (m) <10: easy, 10 -20: moderat e, >20-30:difficult, >30: crit ical. W idth (m) <1.8:tiny, 1.8-3.5: narrow, >3.5: wide. Sanitation W ate r/capita/ day. W aste wate r/ Distance to se we r family (m). <20:survival, <100:low, 20<W<70: good, >100: high >70: bet ter. <10:short, >10: long. 12.8 L : survival sanitation. 23.4 L: good sanit at ion. 30.3 L: good 43.2 L: good sanitation sanit at ion. 16.1 L: survival sanit at ion. 14.2 L survival sanitation. 11.7 L : survival sanitation. 36.4 L: good sanit at ion. With respect to our research objectives, we designed a cluster analysis solution to interpret the clusters, understand the characteristics of each one, and develop a name or label that appropriately defines its nature. A cluster being a set of observations with similar predefined characteristics, given names below highlight the general status of households within each cluster with respect to essential functions, as recommended compulsory by the United Nations Human Settlement Program (2010). Those functions are: durable housing, accessibility, not overcrowded, access to.
(16) Urban and Regional Planning Review Vol. 8, 2021. | 65. improved water, improved sanitation and security of tenure (in case of Kigali city, all lands are legally registered to tenants). In order to classify and name clusters with respect to their average values to variables, we used guidelines values (15) as summarized in Table-6 above. After crosschecking the clusters’ average values to the standards and/or guidelines, we decided the appropriate name to each cluster as follows: Cluster 1: Mud blocks houses on narrow access and survival sanitation. Cluster 2: Mud blocks houses on a tiny access and good sanitation. Cluster 3: Burnt bricks houses on wide access and good sanitation. Cluster 4: Cement blocks houses on a wide access and good sanitation. Cluster 5: Old mud blocks houses on a tiny access and survival sanitation. Cluster 6: Instable mud blocks houses on a tiny access and survival sanitation. Cluster 7: Critical wood and mud houses on tiny access and survival sanitation. Cluster 8: Old cement blocks houses on wide access and survival sanitation.. 4.3. Distribution of clusters. Figure-13: Clusters distribution pattern The pattern shows most occurring clusters in different zones of the precinct, that is what we termed as “dominated”. From uphill to downhill, there is a high variation in slopes (as shown on Figure-5, page 7). Historically, the settlement on this area started on flat terrain on the hillcrest along the road from the city center; alongside this road there are still very old building styles built during colonial regime mostly built in cement blocks or burnt bricks and roofed by asbestos sheets. Due to continuous pressure on residential housing demand, caused by the economic growth and development of the CBD, the land value dramatically increased pushing away low income.
(17) Urban and Regional Planning Review Vol. 8, 2021. | 66. residents towards steep slopes of the hillside, mostly dominated by mud blocks houses. Following the itinerary of the main road passing all along the middle of the hillside, there is a mixed use of both residential and commercial building; the land value in this zone is increasingly rising up since the construction of the road six years ago. The west side zone of the hill towards the wetland has steep slopes, hence settled mostly by very low-income people living in structurally critical houses.. 4.4. Relating clusters to income classes. By the time of data collection, the Government of Rwanda used to categorize its citizens into six major income classes (16) as described in Table-7. Table-7: major income classes Income class 1 2 3 4. 5 6. General descriptions. Homeless, beggars, no hope of life and wishing to die rather than living miserably. Living in small and risky houses, no regular job, malnutrition, families with out-of-class children, cannot afford medical care. Living in small houses, informal jobs with little incomes, undernourishment, poorly educated children, poor medical care. Own a low-cost house, can afford children education until high school, can afford basic medical care, have enough income for survival, have some bank savings. Own a decent house, run a medium scale business or senior officials with high salaries, can employ other people. Class 6: Living in villas, owners of factories, industries, commercial and/or consultancy companies, high-income people who can afford their desired lifestyle.. Monthly net income range (US dollars) Not applicable Less to 100 Between 100 and 300 Between 300 and 1,000 Above 1,000 to 5,000 Above 5,000. Apart from income classes 1 and 6, as described above, the study area is a host of the four remaining classes. Figure-14 points out the relationship between the clusters and income classes. The figure highlights the relationships between clusters, as named in section 4.2, and major income classes described in Table-7. A cluster or group of clusters matches with its corresponding income class, based on housing conditions from both clusters’ names and income classes’ description. Figure-14: relationship between clusters and households income Table-8 below contains the average values of different clusters to different variables. We obtained these values by calculating the mathematical averages of all members included in a given cluster..
(18) Urban and Regional Planning Review Vol. 8, 2021. | 67. Structural cracks (number). 6.43 3.11 6.35 4.00 5.17 4.96 4.73 4.47. 51.07 44.72 61.08 54.44 34.58 41.96 0.00 56.33. 1.46 1.61 0.38 0.94 2.00 2.04 4.33 0.60. 25.50 25.61 22.16 22.83 26.33 25.83 29.53 23.13. 24.75 27.06 5.78 7.00 28.17 27.57 40.73 8.53. Distance to sewer (m). Foundation depth (cm). 3.00 2.44 3.78 3.28 2.50 2.39 1.27 3.33. Daily water use (l). Family size (number). 27.07 38.94 30.27 26.72 59.92 11.43 5.60 50.47. Access width (dm). Number bed rooms. 27.07 38.94 30.27 26.72 59.92 11.43 5.60 50.47. Wall thickness (cm) Distance to nearest access (m). House age (years). 1 2 3 4 5 6 7 8. Open space (%). Average values. Clusters. Table-8: Clusters average values to key variables. 17.90 16.70 50.10 44.90 15.60 17.00 12.70 39.30. 82.14 72.78 192.43 172.78 83.33 70.43 55.33 162.67. 24.00 24.44 8.27 8.61 31.00 27.78 38.00 9.00. 3,4 ,8. Switching the above tabular values to linear graphs representation, we came up to the scenario shown on Figure-15 below. Clusters tend to group together into different blocks each of them following a regular pattern towards different variables.. Figure-15: clusters grouping to key variables From the Figure-13 above, old houses (clusters 2, 5 and 8) have larger open spaces whereas newly built houses (clusters 6 and 7) have smaller open spaces. The same figure also shows that the houses in mud blocks built along tiny access (clusters 2, 5 and 6) have shallow foundation and, consequently, bear high structural damages (Table-7). In contrast, from the same table, houses with deeper foundation (clusters 1, 3, 4 and 8) present mere insignificant structural damages. From building characteristics variables, a clear grouping of clusters can be noticed: (3,4,8), (1,2,5,6) and 7 alone. The groups patterns did not came out by simple coincidence: the triplet of clusters 3, 4, and 8 is mostly composed by houses with deepest foundations, strongest construction materials, located to the shortest distances from the widest roads and using the highest daily water quantity..
(19) Urban and Regional Planning Review Vol. 8, 2021. | 68. The quartet of clusters 1, 2, 5, and 6 mostly composed by houses built by mud blocks on shallow foundation, located a bit far from norrow roads and whereby the daily water quantity is for survival use conditions. The cluster 7, composed of wood and mud houses without foundation and structurally critical, has a personal behavior of scoring the poorest and mostly critical conditions for both accessibility and sanitation conditions.. 5. Conclusion The strategic location of the study area with respect to the historical development context of Kigali city resulted in a complex variety of informal housing typologies with different income levels. Our simplistic exploratory data exercise has shown that hierarchies do exist among the households, whereby they sort into clusters groups with respect to their socio-economic standpoints, expressed by the differences in levels of housing quality as well as the accessibility to public infrastructures and services. From our analysis, the households divide into three major blocks. The first includes easily accessible strong houses with good sanitation conditions. The second block encompasses the majority of mud blocks houses, on narrow roads and survival sanitation services. The last block englobes structurally critical houses and mostly built in highrisk zones subjected to landslides in heavy rains, their hazardous accessibility inflicts them very poor sanitation status. Nonetheless, the empirical results reported herein should be considered in the light of some limitations. The first was the allocated budget that constrained us to select the minimum acceptable sample size for multivariate statistical data analysis; the results could have been better with larger sample. The second limitation was the heterogeneity in religions, whereby we omitted some social related questions that appeared to be taboos or not in line of beliefs of some religious groups. Without this constraint, we could have achieved a better understanding of socio-economic standpoint. The third limitation was the lack of demographic evolution within the precinct that could have revealed the pressure exerted on available public infrastructure and services. Further research should consider larger sample size and design the questionnaire keeping in mind of different religious affiliations to meet their respective beliefs. According to UN-Habitat’s indicators and thresholds for defining slums and informal settlements, our findings from data analysis showed that the study precinct has both types of dwellings at proportions of 24% and 76% respectively. The slums’ share in the precinct’s dwellings is half the rate of overall Kigali city’s slums (49%); this makes a strength for the precinct’s on-site upgradability, as fewer dwellings will have to be replaced. In terms of durability of houses according to UN-Habitat guidelines, this study found that 11% of dwellings are built on high slopes subjected to landslides during heavy rain seasons, whereas 24% of them are structurally unstable. Concerning space requirements, 16% of houses are overcrowded with more than three people sharing one room. Referring to the World Health Organization (WHO) recommended standards for minimum essential levels for health and hygiene per capita per day, 52% of the precinct dwellers use below 20 litters. According to the same organization’s guidelines, 56% of dwellers lack access to improved sanitation. Concerning the space and density requirements, while WHO recommends a maximum of 350 habitable rooms to the hectare, the precinct has an average of 520. This reveals a high housing demand that out-striped the supply and it worsen the sanitation conditions..
(20) Urban and Regional Planning Review Vol. 8, 2021. | 69. The hierarchical clustering behavior of households in the study area links to its settlement history since the colonial period as well as the socio-economic development of the area throughout different decades. In line with Banashree B et al. (2012) publication endorsed by the UN-Habitat, this research’s findings have proven that scarce roads traced within the precinct played a leading role for housing structure, piped water supply and wastewater drainage. Therefore, we conclude that the accessibility conditions is the key factor governing the households clustering character. Well accessible dwellings are the strongest in terms of construction materials and have a good connectivity to water and wastewater drainage system. As the accessibility narrow down, the dwellings’ quality and water supply reduce until becoming critical or worse. Hence, we recommend these research findings to the administrators and implementers of the on-site informal settlements and slums in the developing world’s cities as guidance towards a sustainable solution.. Notes (1) Conceptual and detailed physical master plans, local urban development plans, sector specific plans and layout plans. (2) The Government of Rwanda adapted two strategies, namely the on-site upgrading and land re-adjustments. (3) In order to ease pressure on the capital city and help achieve a sustainable urbanization growth rate, the Government of Rwanda selected six cities countrywide as poles of economic growth and development to decongest the capital city. (4) The photo on Figure-2 is an aerial photo shot in 1968 and it is the only one still present in Kigali city’s archives. By that time, all buildings were rectangular shaped single-story. There were four types of elevation materials for walls: cement blocks, burnt bricks, mud blocks and wood. Roof shapes varied among three types: gable roof, hip roof and shade roof; covering materials either were asbestos cement sheets or burnt clay tiles. (5) According to the National Institute of Statistics of Rwanda (NISR), the overall national population density by 2017 was 495 inhabitants/km2; whereas the density of Nyarugenge sector, where the study area is located, was 4605 inhabitants/km2. (6) The Government of Rwanda considers ground slopes of 30% and beyond as high risks zones for human settlement. (7) Yamane’s formula for computing sample size is stated: n = N / (1+Ne2) Where: n: corrected sample size; N: population size (401) and e: margin of error, e = 0.05. Applying the stated parameters in the formula, gives a corrected sample size of 200 households. (8) In this research, the ratio between the number of observations and number of variables is12:1. (9) MSA classification: 0.80 or above is meritorious; 0.70 or above is middling; 0.60 or above is mediocre; 0.50 or above is miserable; and below 0.50 is unacceptable. The MSA increases due to either one of the following: the sample size increases, the average correlations increase, the number of variables increases, or the number of factors decreases. (10) According to the book entitled “Multivariate Data Analysis, seventh edition” by Joseph F. et al., the visual inspection should reveal enough substantial number of correlations greater than 0.30..
(21) Urban and Regional Planning Review Vol. 8, 2021. | 70. (11) With component, only the factors having eigenvalues greater than one are considered significant; all factors with eigenvalues less than 1 are considered insignificant and are disregarded. (12) Excel Tokei 2006 by SSRI, https://www.ssri.com/co_profile/ (13) Guidelines proposed by the Multivariate Data Analysis book, seventh edition. (14) In Rwanda informal settlement context, thicker walls refer to wood and mud, whereas thinner wall correspond to either burnt clay bricks or cement blocks. (15) Some values are international standards while others are suggested by building codes, codes of practice and/or thumb rules from experience. (16) Every five years the Government of Rwanda update the classification of all countrywide households into different income groups, based on pre-defined socio-economic indicators.. References 1) Aime Tsinda and Roger Mugisha, Centre for Global Development - University of Aberdeen, Synthesis of the Literature of Studies on Affordable Housing in Kigali-Rwanda, 2018. Pg117, Eng. https://www.researchgate.net/publication/325540702_Synthesis_of_the_Literature_of_Studi es_on_Affordable_Housing_in_Kigali_Rwanda (Last visited Feb. 2020). 2) Banashree Banerjee et al., Streets as Tools for Urban Transformation in Slums: A Street-Led Approach to Citywide Slum Upgrading, Nairobi-Kenya, 2012. Pg1-97, Eng. www.unhabitat.org HS Number: HS/016/14E ISBN Number:(Volume) 978-92-1-132606-2 3) Beat Weber and John Mendelsohn, Informal Settlements in Namibia: their nature and growth. Exploring ways to make Namibian urban development more socially just and inclusive, 2017. Pg1-104, Eng. https://www.raison.com.na/sites/default/files/Informal-Settlements-in-Namibia-BookWeb.pdf (Last visited Nov.2020). 4) Codere H., the Biography of an African Society: Rwanda 1900-1960, Minessota – United States of America, 1973. Pg1-194, Eng. 5) Daniel Ehebrecht, The Challenge of Informal Settlement Upgrading, Potsdam University – South Africa, 2017. Pg 1-190, Eng. https://publishup.unipotsdam.de/opus4ubp/frontdoor/deliver/index/docId/6981/file/pgp07.pd f (Last visited Dec.2020). 6) David S. Walonick, Survival Statistics, StatPac, Inc., ISBN 0-918733-11-1, Bloomington, United States of America, 2007. Pg1-143, Eng. 7) Deepa Joshi, Sanitation for the urban poor: whose choice, theirs or ours? United Kingdom, 2020.Pg1-206, Eng. https://assets.publishing.service.gov.uk/media/57a08cc3ed915d622c00156b/R8028-FTR.pdf (Last visited Nov.2020). 8) Haroon Sajjad, Living Standards and Health Problems of Lesser Fortunate Slum Dwellers: Evidence from an Indian City, International Journal of Environmental Protection and Policy, Vol. 2, No. 2, 2014. Pg. 54-63, Eng. doi:10.11648/j.ijepp.20140202.13.
(22) Urban and Regional Planning Review Vol. 8, 2021. | 71. http://www.sciencepublishinggroup.com/j/ijepp (Last visited Nov.2020). 9) Institute for Energy and Environmental Research, Kigali city and UN-Habitat, Upgrading of Unplanned settlements in Nyarugenge Sector-Kigali city, 2015. Pg.1-295, Eng. 10) Joseph F., William C., Barry J. et al, Multivariate Data Analysis Seventh Edition, United States of America, 2014. Pg1-761, Eng. 11) Julia J. Mundo-Hernández, Designing Sustainable and Healthy Homes, European Scientific Journal, volume10, issue 20, 2014. Pg232-243, Eng. https://www.researchgate.net/publication/268802295_Designing_Sustainable_and_healthy_h omes (Last visited Dec. 2020). 12) Kigali city archives, accessed in September 2019. 13) Koen Olthuis, Jiya Benni, Kristin Eichwede and Chris Zevenbergen, Slum Upgrading: Assessing the importance of Location and a Plea for a Spatial Approach, Habitat International, Volume 50, 2015. Pg270-288, Eng. https://doi.org/10.1016/j.habitatint.2015.08.033 http://www.sciencedirect.com/science/article/pii/S0197397515001812 (Last visited Nov. 2020). 14) Mercy Brown-Luthango, Elena Reyes and Mntungwa Gubevu, Informal Settlement Upgrading and safety: Experiences from Cape Town, South Africa. Journal of Housing and the Built Environment, Issue 32, 2017. Pg471-493, Eng. https://doi.org/10.1007/s10901-016-9523-4 (Last visited Dec.2020) 15) Mineprisec, Histoire du Rwanda, Tome I (History of Rwanda, Volume I), Kigali-Rwanda, 1987. Pg1-373, French. 16) Napier Mark, Informal settlement integration, the environment and sustainable livelihoods in sub-Saharan Africa, Department for International Development (DFID), 2002. Pg125-148, Eng. 17) National Institute of Statistics of Rwanda, Thematic Report: Population size, structure and distribution, 2017. Pg1-102, Eng. 18) Nazire Haroon, A Study on Characteristics of Informal Settlements and Effects of Upgrading from Aspects of Houses, Land Acquisition, and Social Factors in Kabul City-Afghanistan, doctoral dissertation – Osaka University, 2016. Pg1-102, Eng. https://ir.library.osaka-u.ac.jp/repo/ouka/all/61724/29136_%E8%AB%96%E6%96%87.pdf (last visited Nov.2020) 19) OZ Architecture, EDAW Tetra Tech ERA and Engineers without Borders, Kigali Conceptual Master Plan, Kigali-Rwanda, 2013, Pg1-107, Eng. http://www.masterplan2013.kigalicity.gov.rw/downloads/Docs/RWF1101_03_Kigali%20Cit y_Master%20Plan%20Report_03062013-s.pdf (Last visited Feb.2020). 20) Planet Consortium, EuropeAid/127054/C/SER/multi: Housing Market Demand, Housing Finance, and Housing Preferences for the City of Kigali. Final report, Kigali-Rwanda, 2012. Pg1-65, Eng. https://kigalicity.gov.rw/fileadmin/templates/Documents/reports/1._Executive_Summary___ Synopsis_Housing_Demand_study.PDF (Last visited Nov.2020). 21) Salim Neema, Rural-Urban migration: An empirical study of socio-cultural situation on slum dwellers of Nairobi in Kenya, International Journal of Migration Research and Development (IJMRD), 2015, Volume 01, Issue 01. Pg105-119, Eng..
(23) Urban and Regional Planning Review Vol. 8, 2021. | 72. 22) Richard, J.L., Geological Structures and Maps: A Practical Guide Third Edition, Pergamon Press - United Kingdom, 2004. Pg1-116, Eng. 23) UN-Habitat, Global Activities Report: Strengthening partnerships in support of the New Urban Agenda and the Sustainable Development Goals, Nairobi-Kenya, 2017. Pg1-159, Eng. https://fr.unHabitat.org/wp-content/uploads/2017/05/GAR2017_web_160517.pdf (last visited Dec. 2020). 24) UN-Habitat, Sustainable Housing for Sustainable Cities: A Policy Framework for Developing Countries, Nairobi-Kenya, 2012. Pg1-82, Eng. https://unhabitat.org/sites/default/files/download-managerfiles/Sustainable%20Housing%20for%20Sustainable%20Cities.pdf (Last visited Nov.2020) 25) UN-Habitat, the Challenge of Slums: Global Report on Human Settlements, New York – United States of America, 2003. Pg1-345, Eng. https://www.un.org/ruleoflaw/files/Challenge%20of%20Slums.pdf (last visited Nov.2020). 26) UN-Habitat, Tracking Progress towards Inclusive, Safe, Resilient and Sustainable Cities and Human Settlements, SDG 11 synthesis report high-level political forum, New York – United States of America, 2018. Pg1-128, Eng. http://uis.unesco.org/sites/default/files/documents/sdg11-synthesis-report-2018-en.pdf (last visited Nov.2020). 27) University of Rwanda–Centre for Sustainable, Healthy and Learning Cities and Neighborhoods, National Urban Policies and City Profiles for Kigali and Huye, 2018. Pg1-94, Eng. http://www.centreforsustainablecities.ac.uk/wp-content/uploads/2018/10/Research-ReportRwanda-National-Urban-Policies-and-City-Profiles-for-Kigali-and-Huye.pdf (Last visited Feb. 2020). 28) World Bank, United Nations Population Division. World Population Prospects, 2019. Eng. https://data.worldbank.org/indicator/SP.POP.GROW?locations=RW (Last visited Dec. 2020). 29) World Health Organization, Guidelines for Healthy Housing, Copenhagen-Denmark, 1988. Pg1-258, Eng. 30) World Health Organization – Regional Office for Europe, Environmental burden of disease associated with inadequate housing, 2011. Pg1-238, Eng. https://www.euro.who.int/__data/assets/pdf_file/0003/142077/e95004.pdf (Last visited Dec.2020). 31) Yamane, Taro, Statistics: An Introductory Analysis, Second Edition, New York: Harper &Row, 1973. Pg1-1130, Eng..
(24)
図

関連したドキュメント
熱力学計算によれば、この地下水中において安定なのは FeSe 2 (cr)で、Se 濃度はこの固相の 溶解度である 10 -9 ~10 -8 mol dm
Standard domino tableaux have already been considered by many authors [33], [6], [34], [8], [1], but, to the best of our knowledge, the expression of the
Giuseppe Rosolini, Universit` a di Genova: [email protected] Alex Simpson, University of Edinburgh: [email protected] James Stasheff, University of North
This is a consequence of a more general result on interacting particle systems that shows that a stationary measure is ergodic if and only if the sigma algebra of sets invariant
We solve by the continuity method the corresponding complex elliptic kth Hessian equation, more difficult to solve than the Calabi-Yau equation k m, under the assumption that
In [9], it was shown that under diffusive scaling, the random set of coalescing random walk paths with one walker starting from every point on the space-time lattice Z × Z converges
We describe a generalisation of the Fontaine- Wintenberger theory of the “field of norms” functor to local fields with imperfect residue field, generalising work of Abrashkin for
Shen, “A note on the existence and uniqueness of mild solutions to neutral stochastic partial functional differential equations with non-Lipschitz coefficients,” Computers
