Effects of Fluid Ingestion During Intermittent High Intensity Swimming Exercise on Thermoregulatory Responses and Performance
Akihiro TAIMURA1'3, Takaaki MATSUMOTO2'3, Jeong-Beom LEE3, Timothy OTHMAN3, Masaki YAMAUCHI3-4, Masashi SUGAWARA4
and Mitsuo KOSAKA3
Department of Natural Environmental Conservation, Faculty of Environmental Studies, Nagasaki University, Nagasaki 852-8521, Japan
2The Second Department of Physiology, Aichi Medical University, Nagakute 480-1195, Japan
department of Environmental Physiology, Institute of Tropical Medicine, Nagasaki University, Nagasaki 852-8523, Japan
department of Exercise Physiology, Faculty of Education, Nagasaki University, Nagasaki 852-8521, Japan
Abstract: High intensity exercise in the heat causes major alterations in the circulatory and thermoregulatory functions resulting in reduced athletic performance. We investigated whether fluid ingestion during intermittent high intensity swimming exercise in warm water can mitigate adverse thermoregulatory and cardiovascular responses, and improve athletic performance. To do this, eight male college swimmers aged 22.8•}1.0 yr, body weight 66.72•}1.63kg and height 171.7•}0.7cm were used. In a cross-over design, all eight sub- jects performed 20 sessions of intermittent 50m swims with a 1 min interval between each session when they were water replete (WR) or water deprived (WD). Oral temperature (To), heart rate (HR), plasma osmolarity (Posm), sweat water loss (SWL) and rating of perceived exertion (RPE) as well as swimming velocities (SV) were measured. No difference were observed in To, HR, SWL, and Posm between WR and WD conditions. However, WR maintained higher SV and lower RPE. In a second experiment involving a second set of college swimmers, a strong positive correlation was observed between SV and SWL (r=0.881, p<0.05). These findings reveal that during short duration high intensity inter- mittent swimming exercise lasting•`12 mins, fluid intake did not influence cardiovascular and thermoregulatory responses, but improved athletic performance.
Key words: Fluid ingestion, Thermoregulation, Swimming, Osmoregulation, Hyperthermia.
Received for publication, April 23, 1999
Contribution No. 3676 from the Institute of Tropical Medicine, Nagasaki University
INT RODU CTI ON
Exercise patterns involving the performance of intermittent work having bursts of high-intensity, punctuated with intervals of rest are associated with high rates of metabolic heat production, significant loss of body water and hyperthermia (Burke and Hawley, 1997;
Maughan and Leiper, 1994). Athletes involved in these activities can lose up to 3 L of fluid per hour (Horswill, 1998) and, as a consequence, a reduction in exercise performance results
(Maughan and Leiper, 1994). Hyperthermia appears to be the critical determinant of exercise performance in the heat (Burke and Hawley, 1997; Hargreaves and Febbraio, 1998) and, furthermore, the increased evaporative water loss required to offload exercise metabolic heat is a major factor in reducing cardiovascular filling.
In order to prevent dehydration and its adverse effects, fluid replacement is practiced to maintain hydration and allow athletes to perform optimally (Horswill, 1998). Investigations involving exercise dehydrations in athletes on land suggested that adequate hydration prior to exercise and ingestion of fluids during exercise delayed fatigue, blunted body temperature rise and improved athletic performance (Gisolfi and Duchman, 1992 ; Hargreaves and Feb- braio, 1998 ; Maughan and Noakes, 1991 ; Millard-Stafford et at., 1992). Comparative studies involving swimmers are scanty or lacking. Our previous investigations which examined the effect of fluid ingestion on thermoregulation in swimmers centered on sweat water loss (Taimura and Sugahara, 1994 ; Taimura et al.f 1995).
We nowcompared the thermoregulatory and cardiovascular responses as well as exer- cise performance in water replete and water deprived college swimmers. The data could constitute a basis for strategies that can be implemented to minimize the impact of metabolic heat on high intensity swimmers.
MATERIALS AND METHODS
Experimental subjects
Two sets of experiments were performed. In the first set of the experiment which in-
vestigated the effect of fluid ingestion on thermoregulation and exercise performance, sub-
jects were eight male college swimmers (CS I) aged 22.8±1.0 yr, body weight 66.72±1.63
kg, height 171.7±0.7 cm and percentage body fat 15.9+1.63 %. Their average competitive
experience was 9.3±1.5 years. In a second set of experiments which investigated the corre-
lation between swimming velocity and sweat water loss as well as body temperature, 6 male
college swimmers (CS II), 24.2+1.2 years old, 171.8±2.2 cm in height and 69.70±5.04 kg in
weight were used. All the subjects trained regularly for 2-3 hours a day, 5-7 times in a
week. They were informed of the aims, risks, and benefits of this investigation both verbally
and in writing prior to signing an informed consent document.
Experimen tal protocol/measurements
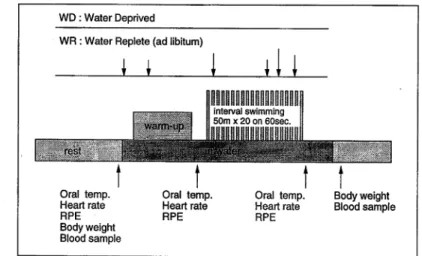
In a cross-over design, the subjects used in the investigation of the effect of fluid in- gestion on thermoregulation and exercise performance (CS I) performed 20 sessions of in- termittent 50 m swims with a 1 min interval between each session when they were water replete (WR) or water deprived (WD). Firstly, one group of four subject were maintained on ad libitum 15 °C water ingestion for water repletion (WR) before and during the exercise bouts, while the other group of four subject was water deprived (WD). After an interval of 3 days the same two groups of subject repeated the same exercise sessions, while the water repletion and deprivation treatment were reversed.
Pool water temperature was measured every 30 min during swimming exercise and the mean(29.95±0.05 °C) was taken as the exposure temperature. Mean ambient temperature where the pool was situated was 31.18±0.31 °C.
Oral temperature (To), heart rate (HR), sweat water loss (SWL), plasma osmolarity (Posm), rating of perceived exertion (RPE) and mean swimming time were measured, before and after the 20 swimming sessions. Blood samples were also taken and used for the deter- mination of plasma volume. To was measured using a clinical thermometer C102 (TERUMO Co. Ltd., Japan). HR was measured by palpation. Changes in plasma volumes were assessed as routinely done, from the changes in haematocrit and haemoglobin, details of which are available from Dill and Costill (1974). Posm was measured by freezing-point depression (OM-6030 KDK Corp., Japan). SWL was determined gravimetrically by weighing each sub- ject before and after the 20 swimming sessions (Digital Scale UC-300 A&D Co. Ltd., Japan).
Blood lactate concentrations were measured by ACCUSPORT (Boehringer Mannheim, Ger- many). Water for ingestion was contained in a graduated water bottle. Water ingested was measured each time a subject had taken water by weighing the water bottle. Total water ingested was calculated at the end of the event by subtracting the water remaining in the bottle from the initial volume.
WD: Water Deprived WR: Water Replete (ad libitum)
i i i ill
"**"i t tr"
Oral temp. Oral temp. Oral temp. Body weight
Heart rate Heart rate Heart rate Blood sample
RPE RPE RPE
Bodyweight Bloodsample
Fig. 1. Experimental protocol (CS I)
In the second set of experiments, the 6 male college swimmers (CS II) having free access to water performed at submaximal velocity for a 1500 m free style swimming exercise in warm (30.4±0.2 °C) water. Swimming time, body temperature (oral temperature), heart rate, and sweat water loss were measured. Body temperature, heart rate and body weight were measured before and after swimming. Changes in To and SWL were measured in the same manneras for the first set of experiments (CS I).
Statistical analysis
All data are expressed as means±SEM. Analysis of variance for repeated measurements was used for comparison of swimming time (CS I), and other parameters were tested by Student's paired t-test. For all statistical procedures the significance level was set at p<0.05.
RESULTS
Physiological changes
To before and after swimming session was 37.1±0.2, and 37.8±0.1 °C in WR, and 37.0±0.1, 37.8±0.1 °C in WD, respectively. There was a slower body temperature rise in WR (0.7±0.13 °C) compared to WD (0.8±0.12 °C), but this was not significantly different.
The total amount of sweat lost during the swimming session was 0.38±0.06 and 0.37±0.04 kg for WR and WD respectively. The sweat loss was only 10 g (2.7%) higher in the WR compared to the WD. In the WR condition, the total amount of fluid taken during the swimming session was 0.100+0.017 1, producing a fluid intake ratio of 26.7±4.08%.
Heart rate during the swimming session was 187.5±3.6 bpm in the WR and 183.8±3.1 bpm in WD. There was no significant difference between the two treatments.
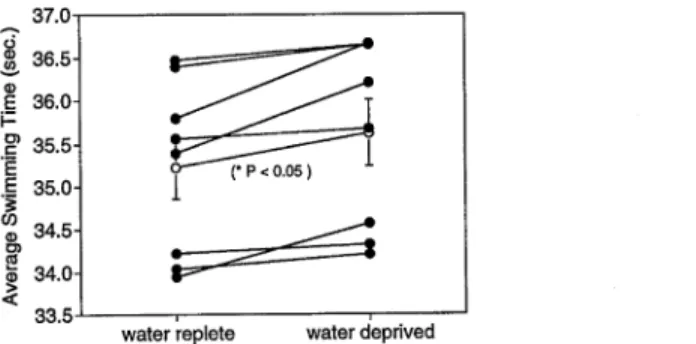
There was, however, a significant difference (p<0.05) in the mean swimming time, with the WR maintaining a highest velocity compared to the WD. The mean swimming time for each session was 35.22±0.36 sec in the WR, but 35.62+0.39 sec in the WD (Fig. 2).
RPE for the WR was 16.2±0.5 and 17.0+0.6 for the WD (Fig. 3). These were statistically different (p< 0.05).
^37.0-1
.1 36-°" *^^\^*^ \
£35.5- f^^^1^^^
*E O- ' (M><0.05)
.1 35.0- 1
0 34.5- ^~^t
1 34.0- f^^-**2^ ~~~
5
335J , , 1
water replete water deprived
Fig. 2. Effect of water intake or deprivation on the average swimming time in
subjects that performed 20 sessions of intermittent 50 m swims with a
1 min interval between each session. Open circles are mean ± SEM-.
Fig. 3. Effect of water intake or deprivation on the RPE in subjects that performed 20 sessions of intermittent 50 m swims with a 1 min in- terval between each session. Values are mean ± SEM.
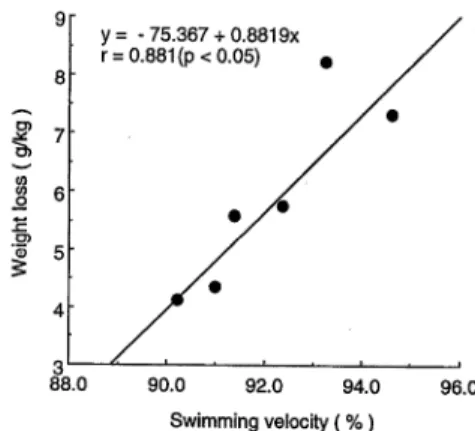
In the second experiment (CS II), The mean swimming time was 1339.67 ± 8.87 sec (1.13 ± 0.01 m/sec). Body temperature (To) changes was 0.7 ± 0.1 °C and sweat water loss was 5.9 ± 0.7 g/kg during swimming. Heart rate before and after exercise was 90.0 ± 4.4 bpm and 146.0 ± 3.3 bpm, respectively. Heart rate and body temperature during swimming was significantly increased. The close correlation was observed between the SV and SWL
(r=0.881, p<0.05) (Fig. 4), but there was no significant correlation between the SV and body temperature changes during swimming (r = 0.700).
y= -75.367+0.8819x
r= 0.881{p < 0.05) *
90.0 92.0 94.0
Swimming velocity { % )
96.0