EVALUATION OF THE CT ANGIOGRAM SIGN AND ITS RELATIONSHIP WITH THE PATHOLOGICAL FINDING
OF RESECTED PRIMARY SOLID LUNG CANCER IN LIGHT OF MODERN ADVANCES IN THE
TECHNOLOGY OF CT SCANNERS
Yuki Wada1), Koichi Ishiyama1), Tomoki Tozawa1), Aoi Otaka1), Noriko Takagi1), Tomoyuki Asano1), Makoto Sugawara1), Hiroshi Nanjo2), Hajime Saito3), Yoshihiro Minamiya3)
and Manabu Hashimoto1)
1)Department of Radiology, Akita University Hospital, Akita, Japan
Departments of 2)Pathology, and 3)Chest, Breast and Endocrine Surgery, Akita University School of Medicine (received 7 December 2017, accepted 10 January 2018)
Abstract
Purpose : To evaluate the usefulness of the CT angiogram sign for solid lung masses on dynamic contrast-enhanced, thin-slice CT. Methods : Between January 2010 and March 2014, 300 patients’ lung masses were surgically resected at our institution. Of these patients, we excluded 177 patients because the CT was not obtained at our institution ; ground-glass opacity component was present ; or neoadjuvant chemotherapy was administered. The CT images were obtained in both arterial and delayed phases at 1.25-mm and 5-mm sections. We evaluated presence of the CT angiogram sign, CT value, and presence of hypo-enhanced areas. Results : Included 123 patients were 89 men and 34 women, with median age of 72 years (range, 38-86). Neither the presence of the CT angiogram sign nor contrast-enhanced pattern had significant correlation with pathologic findings. Conclusions : In our study, the CT angiogram sign was not useful in evalu- ating solid lung masses on dynamic contrast-enhanced, thin-slice CT.
Keywords: CT angiogram sign, lung cancer, solid pulmonary mass
Corresponding author : Yuki Wada
Department of Radiology, Akita University Hospital, 1-1-1 Hondo, Akita 010-8543, Japan
TEL : 81-18-884-6179 FAX : 81-18-836-2623
E-mail : [email protected]-u.ac.jp
subtype in the old classification of lung cancer in 19901) and which is now categorized as a subtype of invasive mucinous adenocarcinoma based on the latest World Health Organization classification2). Until 1999, reports have stated that the sign can likewise be seen in primary pulmonary lymphoma, obstructive pneumonitis, pneumo- nia, metastatic gastrointestinal adenocarcinoma to the lung, and post-radiation fibrosis3-10).
Despite the developments in CT scan machines and techniques of intravenous administration of medium for contrast enhancement, no further reports about the CT angiogram sign have been published in the 21st century.
Introduction
The computed tomography (CT) angiogram sign, which is the presence of contrast-enhancing vessels within tumors, was first reported to be a highly specific sign of lobar bronchioloalveolar carcinoma, which was a
CT angiogram in resected primary lung cancer (62)
In fact, based on our experience, the CT angiogram sign could sometimes be encountered in non-bronchioloalveo- lar carcinoma cases, such as lung squamous cell carcino- ma, other adenocarcinoma subtypes, and small cell lung carcinoma. Additionally, no previous report is available about relationship between pathological type of lung car- cinoma and the CT angiogram signs ; therefore, the presence of the CT angiogram sign can sometimes con- fuse diagnostic radiologists.
The aim of this study was to evaluate the CT angio- gram and its relationship with the pathological finding of resected primary lung cancer in light of modern advanced in the technology of CT scanners.
Materialsandmethods Patients
At our institution, 300 lung cancer patients who under- went operative resection between January 2010 and March 2014 were enlisted. Of these patients, 177 were excluded because the preoperative CT images were not obtained at our institution ; the lung mass had ground glass opacity component ; and there was neoadjuvant chemotherapy administered. The reason why we ex- cluded the patients underwent neoadjuvant chemothera- py is the therapy might influence on vessel structure in- side of tumors. The clinical and pathologic data were obtained from the medical records. Pathological tumor (T) factor and pathologic stage were determined accord- ing to the 7th edition of the general rule for clinical and pathological record of lung cancer (The Japan Lung Can- cer Society, March 2010) ; The 8th edition of the general rule for clinical and pathological record of lung cancer (The Japan Lung Cancer Society, January 2017) is now available since 2017, however, the patients’ clinical and pathological records included in the present retrospective study had been classified according to 7th edition in medi- cal records, therefore, we used the previous edition of the classification. Patients were divided types (squa- mous cell carcinoma or adenocarcinoma ; adenosquamous carcinoma, small cell lung cancer, or carcinoid were not included because these three types were small number), followed statistical analyses. Informed consent for the use of CT data for analysis was obtained from all patients
included in the present study.
Computedtomographyscanningprocedure During the study period, we used two types of CT scanners (Discovery CT750HD or Discovery CT750HD- A ; GE Healthcare Japan, Tokyo, Japan). All patients were scanned according to our protocol for preoperative evaluation of lung tumors. Scanning images were ob- tained with the helical technique with the patients in a supine position, using slice thickness of 1.25 mm (thin slice) and 5 mm, before and after intravenous injection of 100 ml of non-ionic, iodinated contrast medium at 350- 370 mg/mL in the arterial and delayed phases, followed by flushing with 40 ml of normal saline. For contrast administration, we used an automatic injector that was set to deliver the contrast medium for 20 seconds ; thereafter, scanning was performed at 28 seconds (early phase) and at 90 seconds (delayed phase).
Evaluationofcomputedtomographyimages We evaluated the presence of the CT angiogram sign within the lesion both in the 1.25-mm thin-slice and in the 5-mm-slice axial images. The presence of an intra- tumoral vessel enhancement was considered as positive (Figs. 1-4) ; whereas the presence of vessels that could be seen only on the edge of the tumor was considered as negative. The pattern of contrast enhancement was evaluated on the CT slice that contained the maximum tumor diameter. First, a region of interest (ROI) was manually defined from a widest area that contained con- solidation shadows. Then, using the working station’s system, the area within the ROI that had a CT value low- er than 0 was excluded ; this area was considered to not include the tumor.
We measured three variables : 1) maximum CT value of the tumor, 2) mean CT value of the tumor, and 3) the presence of an area with relatively less enhancement (>10 HU difference from the CT value) within the tumor.
Statisticalanalysis
The characteristics of the 2 groups of patients were compared by univariate analysis using the Welch’s t test for continuous variables and the Mann-Whitney U-test or χ2 test for categorical data. The relationship between
Akita University
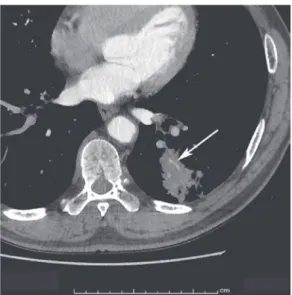
Fig. 1. A 75-year-old woman with lung adenocarci- noma, acinar type
Serial CT scans for follow-up of interstitial pneumonia reveals a lung tumor. A contrast-enhanced chest CT image shows a 45-mm solid mass in the left lower lobe with CT angiogram sign (arrow).
Fig. 2. A 64-year-old man with lung adenocarcinoma, mixed acinar and papillary type
He was noted to have an abnormal density on chest radiograph and was referred to our institution. A chest contrast-enhanced CT image shows a 40-mm solid mass in the right lower lobe with CT angiogram sign (arrow).
Fig. 3. A 79-year-old man with squamous cell carci- noma of the lung with CT angiogram sign
An abnormal density in the right lower lung field was incidentally detected on chest radiograph and he was referred to our hospital for further investigation. CT scan shows a 65-mm homogeneous, low-attenuating mass in the right lower lobe, with highly enhancing branching vessels or the CT angiogram sign (arrow).
Fig. 4. A 76-year-old man with small cell lung carci- noma with CT angiogram sign
An abnormal lung density was detected on preoperative contrast-enhanced CT work-up for gastric cancer. The chest CT image shows a 20-mm homogeneous, low- attenuating solid mass in the right lower lobe, with con- trast-enhancing vessels within the mass (arrow).
CT angiogram in resected primary lung cancer (64)
the CT findings and the three pathologic types of lung cancer was analyzed by the Kruskal-Wallis test or by the n × m analysis. A P value of <0.05 was considered to indicate statistical significance. Excel 2010 software (Microsoft Corporation, Redmond, WA, USA) with the add-in software Statcel 3 software (The publisher OMS Ltd., Saitama, Japan)was used for statistical analysis.
Results
The present study finally included 123 patients ; 89 were men and 34 were women (Table 1). The median age at the time of diagnosis was 72 years (range, 38-86 years). The pathologic types of the lung masses were squamous cell carcinoma, adenocarcinoma, adenosqua- mous carcinoma, small cell lung cancer, and carcinoid.
The maximum and mean CT values of all patients are also shown in Table 1. Less-enhanced areas in the tu- mor mass were seen in 28% in the early phase and in 35% in the delayed phase.
Examination of the relationship of the presence of the CT angiogram sign with CT slice thickness and timing of contrast enhancement demonstrated that compared with the 5-mm slice and delayed-phase scans, the thin-slice CT images in the early phase was the most sensitive set- ting for detection of the CT angiogram sign (Fig. 5). In 59 (43%) patients with primary solid lung cancer, we could find the CT angiogram sign with the thin-slice CT images in the early phase. Univariate analysis of the variables associated with the presence of a CT angiogram sign on thin-slice early phase images showed that tumor size was significantly larger in patients with CT angio- gram sign ; age and sex were similar between the 2 groups (Table 2). Patients without the CT angiogram sign tended to have a lower pathological T factor and pathologic stage than those with the sign. The patho- logic type of lung cancer was not significantly different between the 2 groups. Moreover, the CT angiogram sign was seen in patients with squamous cell carcinoma, adenocarcinoma, adenosquamous carcinoma, and small cell carcinoma. Table 3 shows that the pattern of con- trast enhancement on CT images and the presence of a less-enhanced area in the tumor were not significantly different between squamous cell carcinoma and adenocar-
cinoma.
Discussion
In the present study, there was no significant relation- ship between the presence of CT angiogram sign and the pathologic type of resected primary solid lung cancer.
Furthermore, the patterns of contrast enhancement on Table 1. Patient characteristics
Total (n = 123) Age in years, median (range) 72 (38-86) Sex, n (%)
Men 89 (72%) Women 34 (28%) Tumor size in mm, median (range) 32 (12-135) Pathological T factor, n (%)
1a 15 (12%) 1b 19 (15%) 2a 64 (52%) 2b 8 (7%)
3 15 (12%) 4 2 (2%) Pathologic stage, n (%)
IA 30 (24%) IB 45 (37%) IIA 14 (11%) IIB 11 (9%) IIIA 22 (18%)
IV 1 (1%) Pathologic type, n (%)
Squamous cell carcinoma 35 (28%) Adenocarcinoma 75 (61%) Adenosquamous carcinoma 8 (7%)
Small cell lung carcinoma 3 (2%) Carcinoid 2 (2%) Early phase, median (range)
Maximum CT value (HU) 112 (47-312) Mean CT value (HU) 56 (35-85) Presence of less-enhanced area, n (%) 35 (28%) Delayed phase, median (range)
Maximum CT value (HU) 93 (32.5-105) Mean CT value (HU) 56.5 (27.5-57) Presence of less-enhanced area, n (%) 51 (41%) CT : computed tomography, HU : Hounsfield unit
Akita University
CT scan did not significantly vary among the pathologic types. These results supported our hypothesis that the CT angiogram sign was not specific for bronchioloalveo- lar carcinoma and was likewise observed in squamous cell carcinoma and small cell lung cancer.
The CT angiogram sign was first reported as a specific sign for bronchioloalveolar carcinoma by Im et al.1), who discussed that the sign represents structures with nor- mal bronchovascular bundle and mucin-producing bron- chovascular carcinoma. After this report, several arti- cles have reported that the sign was also seen in primary pulmonary lymphoma, obstructive pneumonitis, pneumo- nia, lung metastasis from gastrointestinal adenocarcino- ma, and post-radiation fibrosis3-10), therefore, the sign be- came less specific and not useful for identifying co n so lidation shadow in chest CT images is tumor or not tumor. R.M.
Shah et al.7) evaluated early-phase, contrast-enhanced CT scans and discussed that the appearance of the CT angiogram sign did not necessitate lung consolidation caused by mucin or fluid, but a sufficient difference in the
attenuation between vessels and consolidation of cellular materials or retained secretions. According to their re- port, development of CT scan machines and techniques of contrast enhancement could enable identification of the CT angiogram sign in a wide variety of diseases if the vessel structures in the area of lung consolidation could be preserved.
The vessels (i.e., pulmonary artery, pulmonary vein, bronchial artery, bronchial vein, or angiogenic vessels) that account for the CT angiogram sign in a tumor are not known. As far as we searched PubMed, no previous re- port has mentioned about this point. As shown in Fig. 5, the arterial phase CT was more sensitive than the de- layed phase in finding the CT angiogram sign. This was probably because the vessels that made up the CT angio- gram sign enhanced earlier than the mass lesions and that in the delayed arterial phase, contrast enhancement was stronger in the mass than in the vessels. A previ- ous report indicated the transit time of the contrast me- dium after intravenous injection ; after about 10 seconds, Fig. 5. Relationship between detection of the CT angiogram sign and the CT scan conditions of contrast enhance- ment phase and scan thickness
The arterial phase thin-slice CT was the most sensitive condition for detecting the CT angiogram sign (n = 69).
The remaining 64 patients in whom there was no CT angiogram sign on arterial phase thin-slice CT also did not demonstrate the CT angiogram sign under the other CT conditions.
CT angiogram in resected primary lung cancer (66)
it begins to enter the intravascular space in the lungs via the pulmonary arteries ; after 11-19 seconds, it travels via the bronchial arteries ; and at 60 seconds, more than half of the injected dose has reached the extravascular spaces11). In the present study, scanning after contrast medium administration was done at 28 seconds for the arterial phase and at 90 seconds for the delayed phase.
Our results supported the idea that the vessels that made up the CT angiogram sign might be branches of the pul- monary arteries or bronchial arteries, which are one of the important nutrition vessels for malignant pulmonary tumors12). If so, identification of these vessels within a mass, independent of the pathologic type, would be rea- sonable because nutrition vessels are essential for malig- nant tumor growth ; however, further study and patho-
logic evidence are needed.
There was no significant difference between the pat- tern of contrast enhancement on CT scan and the patho- logic types (squamous cell carcinoma and adenocarcino- ma) of solid primary lung cancer. Some reports13-15) on dynamic CT for evaluating solitary pulmonary nodules stated that contrast enhancement tended to be stronger in malignant solid lesions than in benign lesions, such as inflammatory changes, granulomas, hamartomas, and so on. Several reports16,17) showed that dynamic CT may reflect solid lung tumor angiogenesis. However, to the best of our knowledge, there is no available report on the relationship between pathologic type of malignant lung tumor and pattern of contrast enhancement. Using our CT protocol for preoperative evaluation, we did not find Table 2. Correlation of the CT angiogram sign with the patient characteristics and pathologic findings
Patients with
CT angiogram sign (n = 59) Patients without
CT angiogram sign (n = 64) p-value
Age in years, median (range) 71 (38-83) 72 (52-86) 0.6545
Sex, n (%) 0.8866
Men 41 (69%) 48 (75%)
Women 18 (31%) 16 (25%)
Tumor size in mm, median (range) 40 (20-135) 28 (12-60) <0.0001
Pathological T factor, n (%) 0.0023
1a 2 (3%) 13 (20%)
1b 7 (12%) 12 (19%)
2a 33 (56%) 31 (48%)
2b 7 (12%) 1 (2%)
3 8 (14%) 7 (11%)
4 2 (3%) 0 (0%)
Pathologic stage, n (%) 0.0025
IA 7 (12%) 23 (36%)
IB 21 (36%) 24 (38%)
IIA 11 (19%) 3 (5%)
IIB 7 (12%) 4 (6%)
IIIA 12 (20%) 10 (16%)
IV 1 (2%) 0 (0%)
Pathologic type, n (%) 0.5583
Squamous cell carcinoma 18 (31%) 17 (27%)
Adenocarcinoma 35 (59%) 40 (63%)
Adenosquamous carcinoma 5 (8%) 3 (5%)
Small cell lung carcinoma 1 (2%) 2 (3%)
Carcinoid 0 (0%) 2 (3%)
CT : computed tomography
Akita University
significant relationships between these two factors in the present study. One of the major factors for this result might be related to the timing of scanning after injection of the contrast medium. Compared to our study, previ- ous reports13-17) on angiogenesis and malignancy adjusted their scan timing individually or scanned more than three times in order to make time-attenuation curves. Con- sidering these, further investigations on the pattern of contrast enhancement of solid lung masses on CT are needed.
We acknowledge that there were several limitations in this study. First, this study was a retrospective analysis
and included patients who were pathologically diagnosed as lung cancer. However, a clinical setting would first entail diagnosis of the cause of a lung consolidation (e.g., pneumonia, benign or malignant tumor, etc.). Second, we evaluated only axial CT images ; this may have led to an underestimation of the actual number of cases with the CT angiogram sign, which might have been observed on sagittal and coronal images. Third, the number of patients with small cell lung cancer, carcinoid, and aden- osquamous carcinoma were small compared with that of patients with squamous cell carcinoma or adenocarcino- ma.
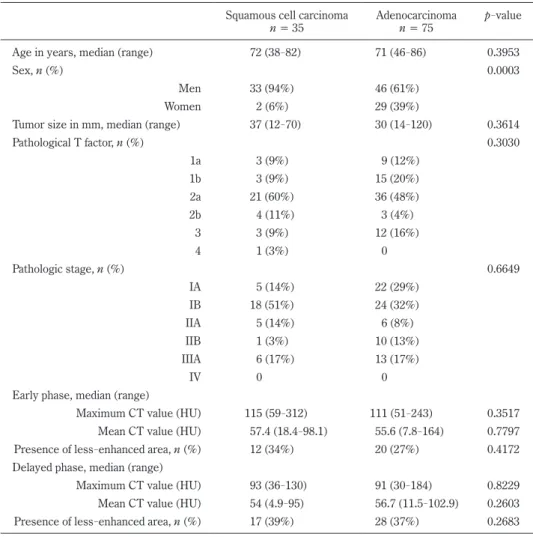
Table 3. Correlation of each pathologic type with patient characteristics, pathologic findings, and radiographic characteristics
Squamous cell carcinoma
n = 35 Adenocarcinoma
n = 75 p-value
Age in years, median (range) 72 (38-82) 71 (46-86) 0.3953
Sex, n (%) 0.0003
Men 33 (94%) 46 (61%)
Women 2 (6%) 29 (39%)
Tumor size in mm, median (range) 37 (12-70) 30 (14-120) 0.3614
Pathological T factor, n (%) 0.3030
1a 3 (9%) 9 (12%)
1b 3 (9%) 15 (20%)
2a 21 (60%) 36 (48%)
2b 4 (11%) 3 (4%) 3 3 (9%) 12 (16%) 4 1 (3%) 0
Pathologic stage, n (%) 0.6649
IA 5 (14%) 22 (29%)
IB 18 (51%) 24 (32%)
IIA 5 (14%) 6 (8%) IIB 1 (3%) 10 (13%) IIIA 6 (17%) 13 (17%)
IV 0 0
Early phase, median (range)
Maximum CT value (HU) 115 (59-312) 111 (51-243) 0.3517 Mean CT value (HU) 57.4 (18.4-98.1) 55.6 (7.8-164) 0.7797 Presence of less-enhanced area, n (%) 12 (34%) 20 (27%) 0.4172 Delayed phase, median (range)
Maximum CT value (HU) 93 (36-130) 91 (30-184) 0.8229 Mean CT value (HU) 54 (4.9-95) 56.7 (11.5-102.9) 0.2603 Presence of less-enhanced area, n (%) 17 (39%) 28 (37%) 0.2683 CT : computed tomography, HU : Hounsfield unit
CT angiogram in resected primary lung cancer (68)
In conclusion, the CT angiogram sign can also be de- tected in lung squamous cell carcinoma, adenocarcinoma other than the bronchioloalveolar carcinoma subtype, and small cell lung carcinoma. Our findings in the study confirmed that despite the modern advanced in CT tech- nology, the CT angiogram sign is still believed to be non- specific for primary lung tumors. This finding support- ed the results of the previous studies and the available literature. However, prospective study is needed to confirm these retrospective results.
References
1) Im, J.G., Han, M.C., Yu, E.J., Han, J.K., Park, J.M., Kim, C.W., Seo, J.W., Yoon, Y., Lee, J.D. and Lee, K.S.
(1990) Lobar bronchioloalveolar carcinoma :
“angiogram sign” on CT scans. Radiology, 176, 749-753.
2) Travis, W.D., Brambilla, E., Nicholson, A.G., et al.
(2015) The 2015 World Health Organization Classi- fication of Lung Tumors : Impact of Genetic, Clinical and Radiologic Advances Since the 2004 Classification.
J. Thirac. Oncol., 10, 1243-1260.
3) Vincent, J.M., Ng, Y.Y., Norton, A.J. and Armstrong, P.
(1992) CT “angiogram sign” in primary pulmonary lymphoma. J. Comput. Assist. Tomogr., 16, 829-831.
4) Murayama, S., Onitsuka, H., Murakami, J., Torii, Y., Masuda, K. and Nishihara, K. (1993) “CT angio- gram sign” in obstructive pneumonitis and pneu- monia. J. Comput. Assist. Tomogr., 17, 609-612.
5) Gaeta, M., Volta, S., Scribano, E., Loria, G., Vallone, A. and Pandolfo, I. (1996) Air-space pattern in lung metastasis from adenocarcinoma of the GI tract. J.
Comput. Assist. Tomogr., 20, 300-304.
6) Blandino, A., Gaeta, M., Scribano, E. and Pandolfo, I.
(1996) The angiogram sign in lung consolidation : what is its diagnostic value?. Radiol. Med., 92, 381- 385.
7) Shah, R.M. and Friedman, A.C. (1998) CT angio- gram sign : incidence and significance in lobar con- solidations evaluated by contrast-enhanced CT.
Am. J. Roentgenol., 170, 719-721.
8) Morisako, T., Kobayashi, H., Kanou, S., Uwave, Y., Nagata, N., Aoki, T., Ozeki, Y., Aida, S. and Tamai, S.
(1998) Clinicopathological study of six cases of pri- mary pulmonary lymphoma diagnosed by gene rear- rangement analysis. Nihon Kokyuki Gakkai Zasshi, 36, 236-240.
9) Maldonado, R.L. (1999) The CT angiogram sign.
Radiology, 210, 323-324.
10) Sandomenico, F., Catalano, O., Cusati, B., Esposito, M. and Siani, A. (1999) The angiogram sign in pul- monary atelectases studied by spiral computed tomography. Its incidence and semeiologic value.
Radiol. Med., 98, 477-481.
11) Littleton, J.T., Durizch, M.L., Moeller, G. and Her- bert, D.E. (1990) Pulmonary masses : contrast enhancement. Radiology, 177, 861-871.
12) Cudkowicz, L. and Armstrong, J.B. (1953) The blood supply of malignant pulmonary neoplasms.
Thorax., 8, 153-156.
13) Zhang, M. and Kono, M. (1997) Solitary pulmonary nodules : evaluation of blood flow patterns with dynamic CT. Radiology, 205, 471-478.
14) Swensen, S.J., Morin, R.L., Schueler, B.A., Brown, L.R., Cortese, D.A., Pairolero, P.C. and Brutinel, W.M. (1992) Solitary pulmonary nodule : CT evalu- ation of enhancement with iodinated contrast mate- rial ─a preliminary report. Radiology, 182, 343- 347.
15) Yamashita, K., Matsunobe, S., Tsuda, T., Nemoto, T., Matsumoto, K., Miki, H. and Konishi, J. (1995) Sol- itary pulmonary nodule : preliminary study of evalu- ation with incremental dynamic CT. Radiology, 194, 399-405.
16) Tateishi, U., Nishihara, H., Watanabe, S., Morikawa, T., Abe, K. and Miyasaka, K. (2001) Tumor angio- genesis and dynamic CT in lung adenocarcinoma : radiologic-pathologic correlation. J. Comput. Assist.
Tomogr., 25, 23-27.
17) Li, S., Xiao, X., Liu, S., Li, H., Li, C., Zhang, C. and Tao, Z. (2003) Preliminary study on the dynamic enhanced multi-slice spiral CT in the evaluation of blood flow patterns of malignant solitary pulmonary nodules. Zhongguo Fei Ai Za Zhi, 6, 18-21.