Student Surveys from the SE Course of the
General Education English Program at Shizuoka University
著者 Urick Steven T.
journal or
publication title
Journal of Shizuoka University Education
volume 8
page range 19‑33
year 2012‑03‑15
出版者 Shizuoka University. Educational Development Center
URL http://doi.org/10.14945/00006688
Student Surveys from the SE Course of the
General Education English Program at Shizuoka University
STEVEN T. URICK
The General Education English Program at Shizuoka University is to undergo change, and in the very near fufure, a general framework for a new curriculum will emerge. While much discussion has already occurred, it is hope that this report on data from student surveys can contribute in some degree to a better understanding of sfudent perspectives. Such understanding is a valuable resource
to be applied to curriculum evaluation and development (Brown, 1995, p. 236; McDonough &
McDonough, 1997, p.181; Richards, 2001, p. 301). In order to collect data from students, two surveys were implemented in the 2010-2011 academic year. The results from a survey for students who had completed the Power English (PE) Course were discussed in Urick, Suto & Komachi
(2011). This article reports on a survey that was filled out by students who were in the final semester of the Standard English (SE) Course. The purpose of the survey was to better understand how students felt about the program, and what changes would, from the students' perspective, be
:
lesirable.
A two-course system was begun in 2006, consisting of the SE Course and the PE Course.
Ihe main purpose of creating two courses was to give students with higher motivation and ability m alternative to the standard curriculum. Under the current system, students are given the option of ryplying for the PE Course before classes begin in their first year. Placement decisions are based on
;est scores. As the number of students who may join the PE Course is limited, the majority of
itudents are assigned to the SE course. In addition, all students in the Faculty of Engineering are rssigned to the SE Course. At the beginning of the 2010-11 academic year, 355 first-year students Mere assigned to the PE Course, and 1,702 first-year students were assigned to the SE Course. The
iE Course places comparatively less emphasis on communicative ability, and is less demanding in effns of the level of coursework and amount of studying outside the classroom. SE students are 'equired to take four courses from the General Education English Program over two years in order o graduate, with the exception of the Faculty of Engineering, where students are required to take
ive courses. Regardless of which faculty they belong to, many SE students also take the two :lective English courses that are offered in the first and second semesters of the sfudents' freshman tear.
-19-
METHOD
The students who participated were in their second year at the university and filled out the surveys during classes in January 2011. The students were about a month from completing the required courses for the SE course, and thus in a good position to give feedback on the program as a
whole. Of the 1,689 students who were enrolled in second-year SE classes in January 2011,1,34I completed surveys. The large percentage of students from which data was obtained (79.4%) suggests that the results should be considered as representative of the group as a whole.
Many of the items for the SE survey were identical to questions on the PE survey, from which datawas collected earlier in the same academic year. Some questions from the PE survey did not apply to SE students and were changed or not used. Other items were added to help provide information directly relevant to ongoing discussion about curriculum development at the university.
Also included were questions about students' basic information (gender and university faculty), test scores, and attitudes toward English. The three final questions of the survey ask for sfudents' opinions about the difficulty level and amount of assignments as well as the amount of time they spent outside of class on assignments. The survey also provided space for written somments on its reverse side. This article does not contain any analysis of the written comments.
RESUTTS
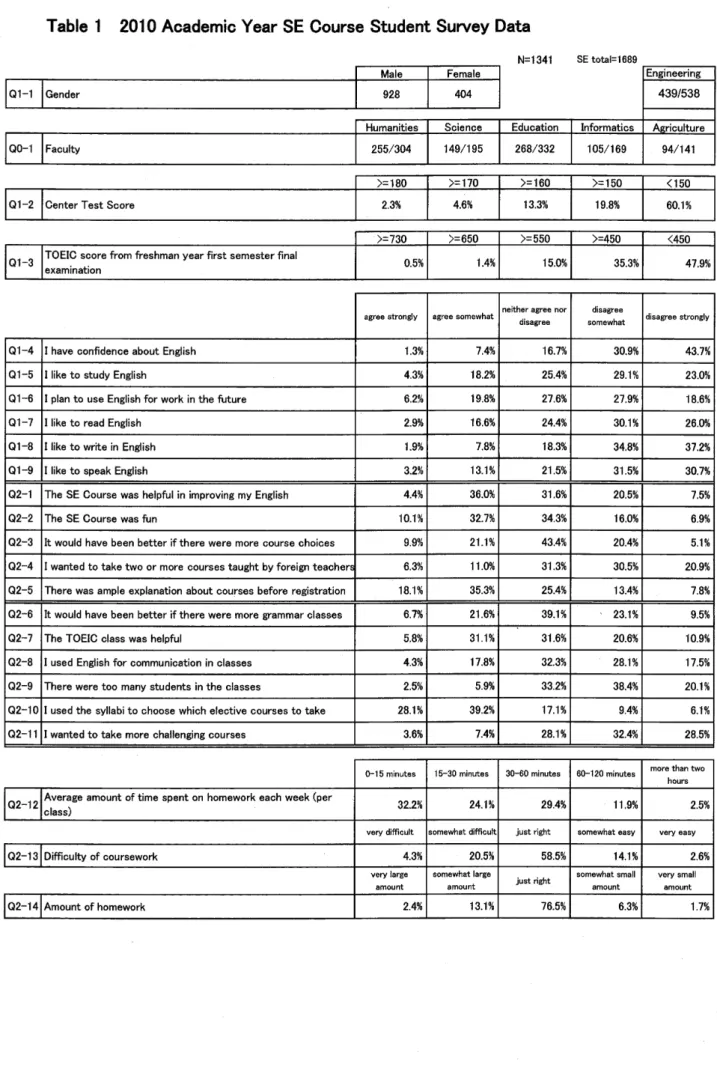
Results from the survey, translated into English, are shown in Table 1. The same data with the original items in Japanese are attached as the Appendix. This section details the results from each item.
Q0-1
Well over half of the students in each faculty responded to the survey. The Faculty of
Engineering is the largest at the university, and 439 of this faculty's 538 students who were enrolled at the time of the survey filled out surveys. For the Faculty of Education, the number was 268 of
332, and for the Faculty of Humanities and Social Sciences , 255 of the 304 students in the target
group provided data.94 of 141 second-yearAgriculture students filled out surveys, as did 105 ofthe 169 second-year students in the Faculty of Informatics. In addition to these numbers, 31 respondents did not answer this question. It is likely that the placement of this item in an isolated box at the top of the survey sheet led to the comparatively high number of participants who did not respond.
Q0-1 Faculty
HlllFlanities* Science Education Informatics Agriculture Engineering 255/304 149/195 268/332 105/169 94/141 439/538
*The fullname of the facultv is the Faculw of Humanities and Social Scrences.
-20-
Table 1 2010 Academic Year SE Gourse Student Survey Data
N=1341 SE tota:=1689
I Male I Female̲J EneineerinE
I J 1 928 F │ 439ノ538
Humanities Science Education Informatics Aericulture
00‑1 Faculty 255/304 149/195 268/332 105/169 94/141
〉 =180 〉 =170 〉 =160 >=150 く150
01‑2 Center Test Score 2.3% 4.6% 13.3% 19.8% 60.1%
〉 =730 〉〓 650 〉 =550 〉 =450 く 450
01‑3 TOEIC score from freshman year first semester final
examination 0.5%
1.4%15.0% 35.3% 47,9%
agree stronglv agree somewhat neither agree nor disagree
disagree
somewhat disagree strongly
Ql‑4 I have confidence about English 1.391 7.喘 16.7% 43.7%
01‑5 I like to study=nglish 18.2% 29.1% 23.0%
01‑6 I plan to use English for work in the future 19.8% 27.6% 27.9% 13.6%
01‑7 1like to read Engiish 2.9% 16.6% 24.4% 30.1% 26.0%
Ql‑8 I‖
ke to write in Ettglish1.9% 7.8% 18.3% 37.2%
01‑9 I‖ ke to speak English 13.1% 21.5% 31.5% 30.7%
02‑1 The SE Course was helpful in improving my English 4.4% 36.0% 31.6% 20.5% 7.5%
Q2‑2 The SE Course was fun 10.1% 32.7% 16.0% 6.9%
02‑3 It would have been better if there were more course choices 9.9% 21.1% 20.4% 5.1%
Q2‑4 I wanted to take two or more courses taught by foreign teachers 11.0% 31.3%
Q2‑5 There was ample explanation about courses before registration 18.1% 35.3% 13.4% 7.8%
Q2‑6 It would have been better if there were more grammar classes 6.7% 21.6% 39.1% 23.1%
Q2‑7 The TOEIC class was helpful 31.1% 31.6% 20.6% 10.9%
Q2‑8 I used English for communication in olasses 4.3% 17.3% 32.3% 28.1% 17.5%
Q2‑9 There were too many students in the classes 2.5% 5.9% 33.2% 38.4% 20.1%
02‑10 I used the syllabi to choose which elective courses to take 23.1% 17.1% 9.4% 6.1%
02‑11 I wanted to take more challenging courses 3.6% 7.4% 28.1% 32.4% 28.5%
0-15 minutes 15‑30 minutes
30‑60 minutes 60‑120 minutesmore than two hours
02‑12 Average amount of time spent on homework each week (per
class) 32.2% 24.1% 29.4% 11,9%
very difficult :omewhat difficufi just rttht somewnat €asy
02‑13 Difficulty of coursework 14.1% 2.6%
very large amount
somewhat large
amount Just nght
somewhat small amount
very small amount
02‑14 Amount of homework 2.4% 13.1% 6.3% 1,7%
一 ‑21‑―
Q1-1
There were more male students than female students among the respondents. 928 male students and 404 female students filled out surveys. This is a reflection of the general student population; as of May I,20tl there were 6,170 males and2,725 females enrolled as undergraduate students at the university (National University Corporation Shizuoka Universiry 2011, p.16). Nine respondents did not answer this question.
Ql‥ 1
Gender Male Female
928 404
Q1-2
More than half of the respondents (60 .l%) reported scores of less than 150 points on the non-listening portion of the English section of the Center Test. 19.8% reported scores between 150- 159 points. 13.3% reported scored between 160-169 points, and 4.6% reported scores between I70-
179 points. Only 2.3% reported scores over 180 points.
Q1-3
Almost half of the respondents reported scoring less than 450 points on the TOEIC exam.
The students had taken TOEIC as the final exam for a course in the first semester of their freshman year. 47.g% reported scores less than 450 points. 35.3% reported scores between 450-545 points, and 15.0% reported scores between 550-645 points. Higher scores were rare, with L.4% reporting scores of 650-725 points, and 0.s%reporting scores of 730 or higher.
Ql‑2 Center Test Score 180 points or
more
170 points or more
160 points or more
150 points or rnore
Less than 150 points
2.3% 4.6% 13.30/0 19。 80/0 60.1%
Ql‐ 3
TOEIC Score (first semester of
freshman year)
730 points or more
650 points or more
550 points or more
450 points or more
Less than 450 points
0.5% 1.4% 15.00/0 35.3% 47.9%
― ‑22‑―
Q1-4
Not many students reported having confidence in their English ability. When asked to respond to the statement, "I have confidence about English," 43.7yo strongly disagreed, and 30.9%
disagreed somewhat. 16.7% responded neutrally to the statement. T.4o/o agreed somewhat, and I.3%
strongly agreed.
Ql-s
A majority of respondents (52.1%) demonstrated a dislike for studying English. 29.1%
disagreed somewhat and 23.0% disagreed strongly with the statement, "I like to study English."
25.4% responded neutrally, 18.2% agreed somewhat, and 4.3% agreed strongly with the statement.
Q1-6
About a quarter of respondents (26 .0%) reported that they plan to use English for work in the future, while a little bit less than half (46.5%) reported having no such intention. Responding to the statement, "I plan to use English for work in the future," 6.2% strongly agreed, while l9.S%
agreed somewhat. 27.9o/o disagreed somewhat, while 18.6% strongly agreed. 27.6% of the students who responded neither agreed nor disagreed.
Q1-4 I have confidence about English
strongly agree
agree somewhat
neither agree nor disagree
disagree
somewhat
strongly
disagree
1.3% 7.4% 16:70/0 30。 9% 43:7%
Q1-5 I like to study English strongly
agree
agree somewhat
neither agree nor disagree
disagree somewhat
strongly
disagree
4.3% 18.20/。 25.4% 29.10/0 23.0%
Q1-6 I plan to use English for work in the future
strongly agree
agree somewhat
neither agree nor disagree
disagree somewhat
strongly
disagree
6.2% 19.80/0 27.6% 27.9% 18.6%
Q1-7
A majority of respondents (56.1%) reported disagreed somewhat, and 26.0% disagreed strongly 24.4% responded neutrally to the statement, while agreed.
that they did not like reading English. 30.1%
with the statement, "I like to read English."
16.6% agreed somewhat and 29% strongly
Ql-7 I like to read English strongly
agree
agree somewhat
neither agree nor disagree
disagree somewhat
strongly
disagree
2.9% 16.60/0 24.4% 30.1% 26.0%
-23-
Q1-8
Writing in English was less popular than reading. Responding to the statement, "I like to write in English," 37.2o4 strongly disagreed, and 34.8 percent disagreed somewhat. 18.3% neither agreed nor disagreed. 7 .8% agreed somewhat with the statement, and 1 .9o/o strongly agreed.
Qr-e A majority of respondents (62 .2%) also do not like speaking in English. 30.7% disagreed
strongly with the statement, "I like to speak English," while 31.5% disagreed somewhat. 2I.5%
answered neutrally, while 13.lo/o agreed somewhat, and 3 .2o/o strongly agreed.
Q2-r
Responding to the statement, ooThe SE Course was helpful in improving my English," 36.0%
agreed somewhat, making this the most frequent response. 4.4% strongly agreed, for a total of 40.4% agreeing. 31.6% responded neutrally, while 28% disagreed. 20.5% of the respondents disagreed somewhat, and 7 .5% strongly disagreed.
Q2-2
The most frequent response to the statement, "The SE Course was firn" was neutral, at 34.3%. Those agreeing somewhat accounted for 32.7% of the responses, and those strongly agreeing amounted to 10.1%. Respondents who disagreed somewhat amounted to I6.0yo, and6.9%o strongly disagreed.
Q1-8 I like to write in English strongly
agree
agree somewhat
neither agree nor disagree
disagree somewhat
strongly
disagree
r.9% 7.8% 18.3% 34.8% 37.2%
Q1-e I like to speak English strongly
agree
agree somewhat
neither agree nor disagree
disagree
somewhat
strongly
disagree
3.2% 13.1% 21.5% 31.5% 30。 70/0
Q2-1 The SE Course was helpful in improving my English
strongly agree
agree somewhat
neither agree nor disagree
disagree somewhat
strongly
disagree
4.4% 36.0% 31.6% 20.5% 7.s%
Q2-2 The SE Course was fun strongly
agree
agree somewhat
neither agree nor disagree
disagree somewhat
strongly disagree
10。 1% 32.7% 34.3% 16.00/。 6.9%
-24-
Q2-3
Reacting to the statement, "It would have been better if there were more course choices,"
the neutral response was again the most frequent, at 34.3%. Those agreeing oufirumbered those disagreeing, with 31.0% agreeing and 25.5% disagreeing. zI.L% agreed somewhat with the statement, and 9.9% agreed strongly. 20.4% disagreed somewhat, and 5.1% strongly disagreed.
Q2-4
A majority of respondents (52.7%) did not demonstrate a desire to learn from foreign instructors. 30.5% disagreed strongly, and 20.9% disagreed somewhat with the statement, "I wanted
to take two or more courses taught by foreign teachers." n.0% agreed somewhat, and 6.30/o
strongly agreed with the statement. The neutral response was the most frequent , il 31.3%.
Q2-s
2I.2% of respondents indicated dissatisfaction with the explanations they received before registration. Responding to the statement, "There was ample explanation about courses before registration," t3.4% disagreed somewhat, and 7.8% strongly disagreed. The neutral response, at 25.4% was the most frequent.35.3% of students agreed somewhat with the statement, and 18.t%
strongly agreed.
Q2-3 It would have been better if
there were more course choices
strongly agree
agree somewhat
neither agree nor disagree
disagree somewhat
strongly
disagree
9.9% 21.1% 43.4% 20.4% 5.1%
Q2-4 I wanted to take two or more courses taught by foreign teachers
strongly agree
aglee somewhat
neither agree nor disagree
disagree somewhat
strongly
disagree
6.3% 11.0% 31.3% 30.5% 20。 9%
Q2-5 There was ample explanation about courses before
registration
strongly agree
agree somewhat
neither agree nor disagree
disagree somewhat
strongly
disagree
18.1% 35。 3% 25。 4% 13.40/0 7.8%
-25-
Q2-6
More than one in four respondents (28.3%) had wanted more grarnmar instruction.6.70/o of
respondents strongly agreed and 21.6% agreed somewhat with the statement, oolt would have been better if there were more grafirmar classes." 23.1% disagreed somewhat with the statement, and 9.5% strongly disagreed. Here again, the neutral response was the most frequent, rt39.1yo.
Q2-6 It would have been better if
there were more grafirmar classes
sffongly agree
agree somewhat
neither agree nor disagree
disagree somewhat
strongly
disagree
6.7% 21.6% 39。 1% 23.10/0 95%
Q2-7
Responding to the statement, "The TOEIC class was helpful," 5.8% strongly 3I.1% agreed somewhat, for a total of 36.9Yo agreeing.20.6% disagareed somewhat strongly disagreed, for a total of 31 .5o/o disagreeing. 31.6% neither agreed nor disagreed.
agreed and and l0.9o/o
Q2-7 The TOIEC class was helpful strongly
agree
agree somewhat
neither agree nor disagree
disagree somewhat
strongly
disagree
s.8% 31.1% 31.6% 20。 6% 10.90/。
Q2-8
While the neutral response was the most frequent (32.3%), less than a quarter of respondents (22.1%) indicated having used English for communication in classes. 4.3Yo of students responding
strongly agreed, and I7.8% agreed somewhat with the statement, "I used English for communication in classes." 28.1% disagreed somewhat, and 17 .5% strongly disagreed.
Q2-e
Most respondents (9 L.7%) indicated no dissatisfaction with class sizes. 2.5% strongly agreed
with the statement, "There were too many students in the classes," while 5.9% agreed somewhat.
38.4% disagreed somewhat, and 20.1o4 strongly disagreed.33.2Yoneither agreed nor disagreed.
Q2-8 I used English for
communication in classes
strongly agree
agree somewhat
neither agree nor disagree
disagree somewhat
strongly
disagree
4.3% 17.80/0 32.3% 28.1% 17.50/0
Q2-e There were too manv students in the classes
strongly agree
agtee somewhat
neither agree nor disagree
disagree somewhat
strongly
disagree
25% s.9% 33.2% 38.4% 20.1%
-26-
Q2-10
A majorrty of respondents (67.3%) reported using syllabi to choose elective courses.28.t%o
of respondents strongly agreed with the statement, "I used the syllabi to choose which elective courses to take," and 39.2% agreed somewhat. 17 .I% of responses were neutral. 9.4% disagreed somewhat, and 6.1% strongly disagreed with the statement.
Q2-11
Only a small number of respondents (11.0%) expressed the desire for more difficult classes.
32.4% of respondents disagreed somewhat with the statement, "I wanted to take more challenging courses." 28.5yo disagreed strongly, bringing the total disagreeing to 60.9%. Neutral responses amounted to 28.l% of the total. 3.6% agreed strongly with the statement, and7.4 agreed somewhat.
Q2-r2
More than half of the respondents (56.3%) reported spending 30 minutes or less on homework for each General Education English course. 32.2% reported doing 0-15 minutes of homework weekly, and 24.1Yo reported doing 15-30 minutes. 29.4% reported studying 30-60 minutes and 1L.9% reported studying 60-120 minutes. 2.5% reported studying more than two hours.
A majority indicated satisfaction with the difficulty level of coursework. 58.5% reported than the level was 'Just right." While 20.5% reported that the level was somewhat difficult,4.3oA found it to be "very difficult." For l4.l% of respondents, the level was "somewhat easy," and for
2.6Yo, it was "very easy."
Q2… 10 I used the syllabi to choose which elective courses to take
strongly agree
agree somewhat
neither agree nor disagree
disagree somewhat
strongly disagree
28。 1% 39.2% 17.1% 9.4% 6.1%
Q2‑11 I wanted to take more challenging courses
strongly agree
agree somewhat
neither agree nor disagree
disagree somewhat
strongly
disagree
3.6% 7.4% 28.1% 32.4% 28.5%
Q2‑12 Average amount of time spent on homework each week (per class)
0‐ 15 nlinutes
15…
30
‑utes
30‐ 60
■llnutes
60… 120
■linutes
more than two hours
32.2% 24.1% 29.4% 11.9% 2.5%
Q2‑13 Difficulty of coursework very
difflcult
somewhat
difficult
just right somewhat easy
Very easy
4.3% 20.5% 58.5% 14.1% 2.6%
― ‑27‑―
More than three quarters of the respondents approved of the amount of homework. 76.5Yo of
respondents found the amount of homework to be'Just right." I3.l% of respondents reported that the amount of homework was "somewhat large," and 2.4% reported a "very latge amount" of
homework. 6.3% reported that the amount of homework was "somewhat small," and I .TYoreported
a'1ery small amount" of homework.
DISCUSSION
In many areas a majority of students did not express dissatisfaction with elements of the current SE program. Generally speaking, students appear to be satisfied with the amount of
homework (Q2-14) and the difficulty level of coursework (Q2-13). Not many students desired more challenging courses (Q2-11). Only 8.4% reported that the class sizes were too large (Q2-9).Yet only 44.4% reported that the four to six courses they had taken had helped them improve their English (Q2-1). If class size, the amount of homework, and the level of coursework are not problems for most students, what can be done to ensure that more students can leave the General Education English Program having made recognizable gains in ability?
Students in the more advanced PE Course responded favorably to the focus on
communication in their courses. This focus and foreign teachers'contributions were found to be two factors contributing to students'positive evaluation of the PE program (Urick, Suto & Komachi, 2011). One hypothesis about the SE Course would suggest that more focus on communication could help improve the SE students sense of accomplishment. Amajority of students do not appear to want this, however. Only 17.3% of respondents indicated a desire to take two or more classes taught by a foreign teacher (Q2-4). If it is reasonable to assume that most students associate foreign
teachers with communicative classrooms, this can be interpreted as a lack of desire to sfudy English as a tool for communication.
In fact, it is difficult to find at atea where a majority of students agree that a particular kind of change would be desirable. Only 31.0% of respondents reported that more choice would make the program better (Q2-3). The percentage of respondents who wanted more opportunities to study granrmar was 28.3% (Q2-6). While these numbers are significant and should not be ignored, the fact remains that only a minority of students demonstrated a desire for such changes.
One likely reason for the limited success of the SE program is students'lack of affinity toward English, as demonstrated in the responses to Q1-4 through Q1-9. Amajority of the respondents are not confident about their English ability (Ql-4) and do not like to study English
Q2-r4 Amount of
homework
very large amount
somewhat large amount
just right somewhat small amount
very small amount
2.4% 13.1% 76.5% 6.3% 1.7%
-28-
(Q1-5).Amajority of respondents also do not like reading English (Ql-7), writing in English (Q1- 8), or speaking English (Q1-9). Only about a quarter of students reportthatthey plan to use English in the workplace in the future (Q1-6).Although there is no data available that provides evidence about students' attitudes in earlier years, it is most likely that those who lack affinity toward English developed this attitude before beginning college life. Certainly, efforts should be made at the
university level to foster an affinity towards English, but the results of such efforts may remain limited.
Another key issue is motivation. Unfortunately, the survey this article documents did not include items that directly asked about students'motivation. Still, the data as a whole seems to suggest that students are somewhat lacking in concern or interest about their English studies. As noted above, there were no potential changes that a majority of students supported. Furtheffnore, neutral responses were most frequent for many of the items (Q2-2, Q2-3, Q2-4, Q2-6, Q2-7, and Q2-8). This suggests a lack of investment in the SE program on the part of the students.
Given that a majority of students are not demonstrating a sense of achievement after having taken four to six courses in the SE prograrrr, reducing the number or credits that are required may make the program more efficient. It is likely that students who have no or little interest in studying English will benefit very little from their coursework. Rather than attempting to solve this by making coursework more rigorous, allowing such students to take less English courses may be a reasonable solution. However, reducing the number of required English credits would apply not only to the SE group, but also the PE group, which has demonstrated a high level of satisfaction with a six-course, l2 credrtprogram. Making sure that motivated students at a higher level of
proficiency have a suitable menu of course choices is crucial.
In developing the new curriculum, it is also necessary to consider students who are motivated and invested in the program, but are at a lower level of proficiency. Currently these students are asub-group of the SE students. These students also need a variety of alternatives so that they may find courses that suit their interests and perceived needs. Even though only lITo of
responding SE students reported a desire for more grammar classes (Q2-6), it would be wise to provide more instruction in this area, if possible. Similarly, there need to be alternatives for students who want to take more challenging courses (Q2-11) and multiple courses with foreign teachers (Q2- 4). There are also, without doubt, other needs that were not addressed by the current survey. These should be carefully considered, and if possible, more data from students should be collected.
Whatever changes are made to the curriculum, a sense of vision and clear goals for the program are vital (and also logically prior). What sort of internati onalization do we envision for
Japan in the future? What role do we see English playing in domestic academic, industrial, and social realms in years to come? What sort of internati onalization do we want to bring to our
-29-
campus? What kinds of language ability do we need to foster? Only when we have the answers to these questions will we be able to formulate concrete goals for the General Education English Program at Shizuoka University. Certainly, we will need to respond to an array of student needs, but in addition to providing variety and flexibility we will need a strong sense of purpose to guide us in making decisions with regard to curriculum development.
― ‑30‑―
References
Brown, J. D. (1995). The elements of language curriculum: A systematic approach to program development. Boston: Heinle & Heinle Publishers.
McDonough, J. & McDonough, S. (1997). Research methods for English language teachers.
London: Arnold Publishers.
National University Corporation Shizuoka Universiry Public Relations Office. (2011). Outline of
National Univ er s ity C orp or ation Shizuoka Univ ers ity.
Richards, J. C. (2001). Curriculum Development in Language Teaching. Cambridge: Cambridge University Press.
Urick, S., Suto, S., & Komachi, M.(2011). Student surveys fromthe PE Course of the General Education English Program at Shizuoka University. Journal of Shizuoka University Higher Education,T,57-63.
-31 -
Appendix
Sllrvey Dtta(in Ja/pttese)
平成 22年 度 SEコ ース受講者用アンケートの結果
N=1341 SÈ鐘
体=1689
男
女 工 字 郡巨
r̲卜甲 を 教 え て く だ れヽ 酪な し 霊 0
│"81 404
439ノ538
人 文 学 部 理 学 部 教 育 学 部 情 報 学 部 饉 学 部
00‑1 学部
(回答なし霊31) 255/304 149/195 268/332 105/堆 69 94/峰 4瑾
180点 以 上 170点 以̲L 160点
以 上150点
以 上150点
央 競Ql…2 あなたのセンター試験の点数を教えてください (だ いたい
で結構です
) 2.3%13.39/1
19.8%60.1%
730点 以 上
650J駐 〕1」 L 550JttE災 」 L 450Jtt E皮 」 L
4501記JL覇 臨
Q霧 ‑3 あなたの 2008年 前期末のTO=ICの 点数を教えてください
(だ いたしヽ で結構です
)15.0% 47.9%
とてもそう思う 少 しそう思 う どちらでもない あまりそう思わない 全くそう思 わ ない
01‑4 英語に自信 がある 16.796 3019% 43,7%
01‑5 英語を勉強するのが好きだ 18.2% 25.4% 29.1% 23.0%
01‑6 今後仕事で英語を使うつもりだ 19.8% 27.6% 27.9%
18.6%01‑7 英文を読むのが好きだ 16.6y・ 24.4% 30.1% 26.0%
01‑8 英文を書くのが好きだ
7.8%13.3% 34.8% 37.2%
01…9 英語で話すのが好きだ 13.1% 21.5% 31.5% 30,7%
Q2…
1S羅 の授業 │ま 自分の英語の上達に役立った 4.喘 36.096 31.6% 20.5% ア
.5%02‑2 SEの 授業は楽しかった 10.196 32.7% 34.3% 16Ю 眺
6.9%02‑3 もっと科 目の選択肢があつた方がよかつた 21.1% 43.4% 20.496
02‑4 外 国人の先生の授業を二つ以上取りたかつた 霧 1.096 31.3% 30.591 20.996
Q2‑5 履修前 、教 員から授業についての説 明を十分受 │す た 18.1% 35.3% 25.491 13.496 7.396
Q2‑6 もつと文法の授業があつたほうがよかつた 6.7% 21.6% 39.1% 23、 1% 9.596
Q2‑7 TOEICの 授業は役立つた 5.8% 31.囃 % 31.696 20.0% 10,991
Q2‑3
授 業でコミュニケーションの 道具 として英語を使 えた17.896 32.3% 23.1% 17.596
02‑9 クラスの人数が多すぎた 33.2% 38.4% 20.1%
02‑10 選択科 目はシラバスの内容でとる授業を決めた 28.1% 39.2% 17.囃 % 9珊
02‑11 もつとレベルの高い授業をとりたかつた 3.6% 23.1% 32J易 28.596
0‑15分