1
Effects of Visual Context on Information Processing during Tooth Identification
(視覚的文脈が歯種鑑別時の情報処理に及ぼす影響)
日本大学松戸歯学部歯科総合診療学講座
岩橋 諒
(指導:小方 賴昌 教授)
2
Effects of Visual Context on Information Processing during Tooth Identification Ryo Iwahashi
Nihon University Graduate School of Dentistry at Matsudo, Oral Diagnosis, Matsudo, Chiba 271-8587, Japan
Key word
visual context, event-related potential, P300, P600, mandibular first molar
Corresponding author: Ryo Iwahashi
Department of Oral Diagnosis, Nihon University School of Dentistry at Matsudo, Matsudo, Chiba 271-8587, Japan
Phone number: +81-47-360-9423; Fax number: +81-47-360-9426 E-mail address: [email protected]
3
Abstract
Objective: The effects of visual contexts, such as positional relationships among teeth, were analyzed in tooth identification.
Methods: The participants were dental students of Nihon University School of Dentistry at Matsudo, including 15 second-year students who had received only basic lectures and practice on dental anatomy and 15 fifth-year students who had received clinical lectures, practical training, and clinical practical training in addition to those offered to the second-year students. The target stimuli were the occlusal view of the right side of the mandibular first molar. For the single tooth task, only the mandibular first molar was used, and for the contextual tooth task, the first molar within the dentition from the first premolar to the first molar was used. Electroencephalography measurements were acquired, and event-related potentials were analyzed.
Results: Since similar principal component patterns were evident in the single and contextual tooth tasks, the second-year students made decisions focusing on a single tooth. The fifth-year students used the visual context effectively because the components concerned with the visual context (P600) emerged in the
contextual tooth task.
Conclusion: The fact that fifth-year students were able to use visual context
4
effectively was likely due to practical training using dental models and clinical practical training experience at the hospital. The fifth-year students seemed to have individual differences in processing capacity.
5
Introduction
Four types of teeth exist in the human oral cavity: incisors, canines, premolars, and molars. There are 32 permanent teeth in the oral cavity, and each quadrant contains eight teeth (1-4). The shape of the tooth differs between the maxilla and mandible, even within the same tooth classes; however, the adjacent teeth are similar in shape, especially in the same tooth classes (3, 4). Each tooth has its characteristic structure, such as the configuration of the crown, cusp, and groove patterns. It is extremely important for dentists to acquire specialized knowledge of the characteristic features of each tooth shape for tooth
identification (4).
Many textbooks of dental anatomy illustrate the tooth shape of the occlusal view in the figure with the buccal side up (1-3). Dentists usually learn the morphological characteristics of teeth based on these figures in textbooks. By accumulating clinical experience, dentists can perform pattern recognition (5) using the basic tooth shape as explicit knowledge. Dental students recognize tooth figures using mental rotation to compare and collate objects in front of them with the explicit knowledge recalled in the brain (6).
Previous studies on pattern recognition using electroencephalography (EEG) focused on evoked potentials with event-related potentials (ERP) (6, 7).
6
ERP emerges from cognitive processes such as attention, search, and memory.
Among the ERP, the P300 has a high amplitude and changes because of
psychological factors (8). Previous studies have analyzed images of a single tooth rather than a tooth within the dentition.
Dentition includes not only the morphological characteristics of a single tooth but also visual contexts, such as the positional relationship and
arrangement of teeth in the dental arch. The objects that construct the outside world maintain a certain relationship with other objects and have a certain
structure and law. This information is called the visual context (9). Humans learn the relationships among objects through experiences and use the visual context effectively to facilitate object recognition (9-12). Dentists utilize specialized knowledge of not only tooth morphology, but also the visual context for more efficient tooth identification. However, the effect of empirical knowledge on information processing during tooth identification remains unclear.
The purpose of this study was to elucidate how visual context affects tooth identification. Special attention was paid to the relationships between the presence or absence of clinical experience of the participants and the visual context.
7
Materials and Methods 1. Participants
Fifteen second-year students (average age, 20.2 ± 0.4 years) and Fifteen fifth-year students (average age, 23.7 ± 0.5 years), enrolled in Nihon University School of Dentistry at Matsudo, were included in this study. All participants were right-handed and had visual acuity that did not interfere with the experiment.
All participants were healthy and had no history of mental illness.
In this study, second-year students had received only basic lectures and practical training, including dental anatomy. The fifth-year students had received clinical lectures, practical training using dental models, and clinical practical training at the hospital in addition to that of the second-year students.
2. Measurement method of EEG
The measurement method conformed by Momohara et al. (13) was used.
The participants sat on a chair in a shielded room, and their heads were fixed to the chin rest. The images were presented on a screen that was placed 50 cm forward. The EEG signals that appeared during the tasks were recorded using a Nicolet One® (Gadelius Medical, Tokyo, Japan). ERP waveforms were extracted from the records and processed for analysis. The ERP measurement and analysis
8
system is showed in Fig. 1.
The EEG was derived from Pz based on the 10-20 method (14). The electrodes were made of silver-silver chloride electrodes. The sampling frequency was 1000 Hz, and the contact impedance was 10 kΩ or less. The low-frequency and high-frequency filters were set to 0.1 Hz and 100 Hz, respectively.
3. Tasks
The images presented were of a single tooth and contextual tooth from an occlusal view. The images consisted of 480 × 480 pixels and were presented using the Multi-Trigger System® (Medical Try System, Tokyo, Japan). The details were explained as follows.
Single tooth task
The target stimuli were the occlusal surface views of the right
mandibular first molar. The non-target stimuli were the occlusal surface view of the left mandibular first molar, right maxillary first molar, and left maxillary first molar. The images were set to 0° for the presentation image with the buccal side up, as illustrated in many textbooks (1-3). Since an upside-down image is often encountered in clinical dentistry, an image that was rotated 180° was also
Fig. 1
9
used. White dots (3 × 3 pixels) were used to prevent recognition by a part of the visual field. An image of the presentation is shown in Fig. 2. It was reported that the 0° image was based on the textbook knowledge by the learning effect (6); only EEGs when 0° images were presented were analyzed in this study.
Contextual tooth task
The stimuli of the contextual tooth task consisted of three teeth: the first premolar, second premolar, and first molar. The target stimuli were the occlusal surface views of the three teeth on the mandibular right side. The non-target stimuli were the occlusal surface view of the three teeth (the first premolar, second premolar, and first molar) on the mandibular left, maxillary right, and maxillary left sides. The images were set and investigated in a manner similar to that in the single tooth task. A presentation image is shown in Fig. 3.
4. Present method of images
The presentation method was based on the oddball paradigm. The target and non-target stimuli were presented at a ratio of 2:8. The stimuli were
presented randomly. The participants were instructed to push the button only when the images (target stimuli) were presented and not moved to reduce
Fig. 2
Fig. 3
10
artifacts. The number of presentations and presentation times were set to 300 and 1500 ms for each task, respectively. Only correctly answered data for the target stimuli were used. The measured brain waves were added at each angle to extract ERP. The purpose of the experiment was explained to the participants who agreed to participate in this study.
5. Measurement methods of P300
The correct answer rate, which indicated the rate at which the target stimuli could be correctly identified for each task, was calculated, and the
reaction time for each task was recorded. The reaction time is the time required to push the button and represents the information processing time.
The P300 is not evoked by exogenous stimuli, such as reflexes; however, it is evoked by endogenous stimuli, such as cognition and information processing.
Therefore, it was used as an index of cognitive function. The P300 was extracted from the EEG because it appeared at approximately 250–600 ms (8) after
stimulation and was largest at Pz. The P300 latency and amplitude of each task were recorded. The P300 latency reflects the stimuli assessment time, and the P300 amplitude reflects the processing capacity available for task performance (15).
11
6. Introspection report
After completing the two tasks,the participants were interviewed for an introspection report (16). The introspection report was made to know exactly where the tooth was identified. It was used to compare and infer the ERP waveform component and the specific tooth discrimination procedure. The questionnaire consisted of "Please tell me the procedure you identified"
7. Principal component analysis
In this study, principal component analysis (PCA) was performed to examine the effect of participants’ experiences on information processing. The information processing of the brain could be examined by the apparent tendency of ERP waveform components extracted by PCA (17). A 91–750 ms waveform was used for each task for PCA. The waveform was averaged every 30 ms and divided into 22 points. After varimax rotation, each principal component was interpreted.
The eigenvalue indicating the amount of information contained in each principal component was set to 2.0 or more. In addition, when the factor-loading amount, which indicated the magnitude contributing to the principal component, was 0.7 or more, the ERP waveform component was extracted. The cumulative
12
contribution rate represents the effect of the sum of each principal component on the total amount of data. The first and second principal components were named in a descending order of the amount of data. The ERP waveform components are defined as follows:
The mismatch negativity (MMN) appeared in the latency range of 91 to150 ms and represented a simple pattern-matching process. N2b appeared at a latency of 151 to 270 ms and represented an advanced pattern-matching process.
P3a appeared in the latency range of 271 to 450 ms and represented the
localization process of attention. P3b appeared in the latency range of 451 to 600 ms and represented the process of updating working memory. The P600 appeared in the latency range of 601 to 750 ms and represented the semantic factors of the context (15, 18-24).
8. Statistical analysis
Comparisons between the second-and fifth-year students were performed using the Wilcoxon rank-sum test, and between the single and contextual tooth tasks were performed using the Wilcoxon signed-rank test. The significance level was set at 5%. The correction for test multiplicity was corrected using the
Bonferroni method. Statistical analysis was performed using the Statistical
13
Package for the Social Sciences software version 26 (IBM SPSS Japan, Tokyo, Japan).
9. Ethical considerations
The purpose of this study was explained to all participants and informed consent was obtained. This study was approved by the Ethics Review Committee of the Nihon University School of Dentistry at Matsudo (approval number: EC19- 16-15-11-010-3).
Results
1. Correct answer rate of each task
The correct answer rates for all tasks are shown in Table 1. The correct answer rates of all the tasks were 98% or higher, The EGG data for the wrong answer were excluded from the analysis. Since there were very few excluded data, it seemed valid to analyze the EEG data obtained in this experiment (6, 7).
2. The reaction time of each task
Fig 4 shows a box plot of the reaction times for the two tasks. In the single tooth task, the median value was almost the same length and distribution
Table 1
Fig. 4
14
between the second-and fifth-year students. In the contextual tooth task, the reaction time was significantly shorter in the fifth-year students than in the second-year students (p<0.05). In the second-year students, the contextual tooth task was significantly longer than the single tooth task (p<0.05).
3. P300 latency for each task
Fig. 5 shows a box plot of the P300 latency for the two tasks. In the single tooth task, the median value was almost the same between the second-and fifth- year students. In the contextual tooth task, the fifth-year students were
significantly shorter than the second-year students (p<0.05). In both the second- and fifth-year students, the contextual tooth task was significantly longer than the single tooth task (p<0.05).
4. P300 amplitude for each task
Fig. 6 shows a box plot of the P300 amplitude for the two tasks. In the single tooth task, median values were almost the same in the second and fifth- year students, but in the contextual tooth task, the fifth-year students were significantly larger than the second-year students (p<0.05). The fifth-year students had a wider interquartile range than the second-year students,
Fig. 5
Fig. 6
15
especially in the contextual task. In the second-year students, median values in both tasks were almost the same values and interquartile ranges. In the fifth- year students, the contextual tooth task had a significantly larger value than the single tooth task (p<0.05).
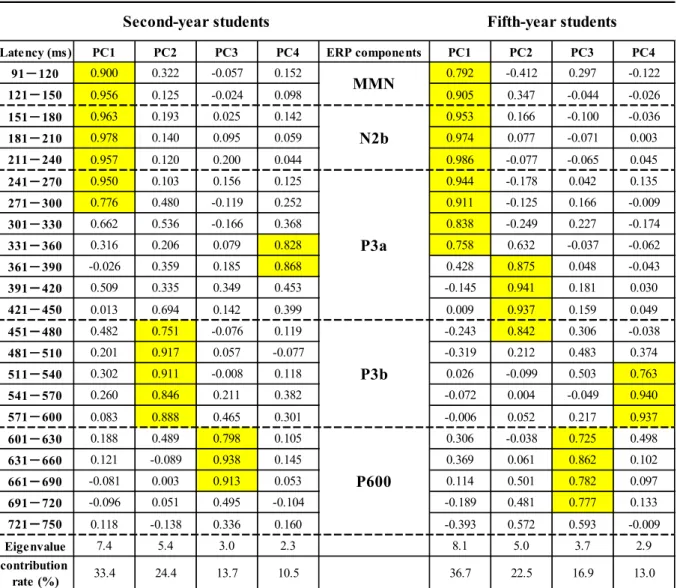
5. PCA appearance trend I. Single tooth task
Table 2 shows the extracted components for the single tooth task by the PCA of the ERP waveform, and Table 3 shows the interpretation of each
component. In the second-year students, the following four components were extracted: the complex component of the MMN and N2b was extracted as the first principal component with a contribution rate of 33.4%, P3b as the second with a contribution rate of 24.4%, the P600 as the third with a contribution rate of 13.7%, and P3a as the fourth with a contribution rate of 10.5%, and the
cumulative contribution rate was 82.0%. In the fifth-year students, the following four components were extracted: the complex component of MMN and N2b was extracted as the first principal component with a contribution rate of 36.7%, P3a as the second with a contribution rate of 22.5%, the P600 as the third with a contribution rate of 16.9%, and P3b as the fourth with a contribution rate of
Table 2 Table 3
16
13.0%, and the cumulative contribution rate of the four components was 89.1%.
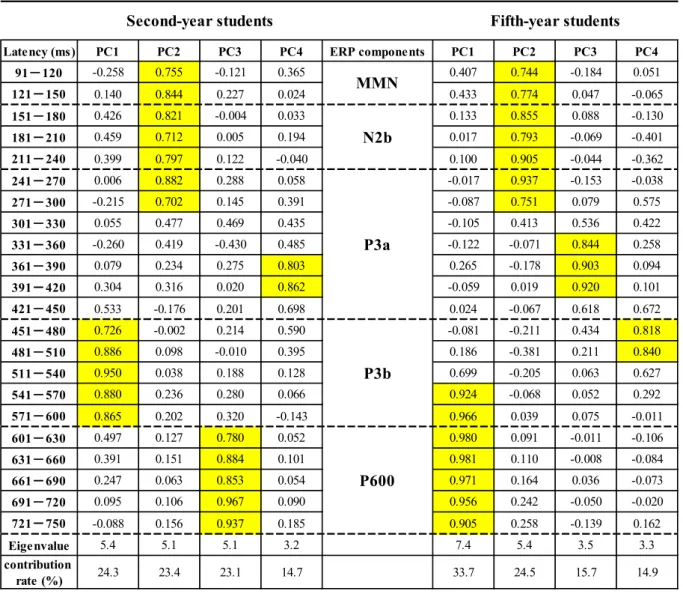
II. Contextual tooth task
Table 4 shows the extracted components for the contextual tooth task by the PCA of the ERP waveform, and Table 5 shows the interpretation of each component. In the second-year students, the following four components were extracted: P3b was extracted as the first principal component with a contribution rate of 24.3%, MMN and N2b as the second with a contribution rate of 23.4%, the P600 as the third with a contribution rate of 23.1%, and P3a as the fourth with a contribution rate of 14.7%, and the cumulative contribution rate was 85.5%. In the fifth-year students, the following four components were extracted: the P600 was extracted as the first principal component with a contribution rate of 33.7%, MMN and N2b as the second with a contribution rate of 24.5%, P3a as the third with a contribution rate of 15.7%, and P3b as the fourth with a contribution rate of 14.9%, and the cumulative contribution rate was 88.8%.
6. Introspection reports
In the two tasks, the participants were instructed to first see the white spots located on the center of the buccal side to prevent false recognition, so all
Table 4 Table 5
17
Table 6 participants saw the white spot in the first stage. The following description
showed the process from the second stage. In other words, an actual discrimination procedure is shown.
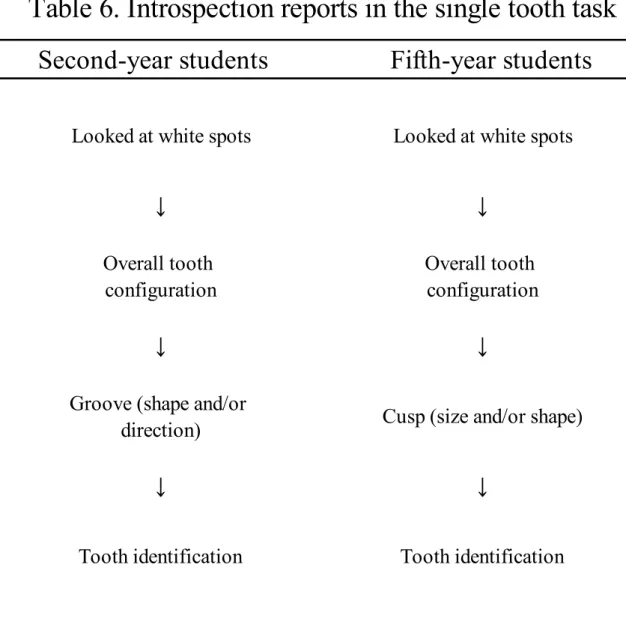
I. Single tooth task
Two examples of second-year students of introspection reports are shown.
A participant looked at the occlusal outline of the first molar and then focused on the direction of the buccal groove. Another participant looked at the overall shape of the five cusps, and secondary focused on the shape of the distobuccal groove.
The second-year students tended to perform tooth identification by observing the overall tooth configuration first and then focused on the shape and/or direction of the groove of the tooth.
As for the fifth-year students, a participant confirmed the cusp number, and secondary paid attention to the distobuccal angle of the distal cusp. Another participant looked at the overall occlusal outline and then focused on the size of the mesiobuccal cusp. The fifth-year students tended to perform tooth
identification by observing the overall tooth configuration at the first stage, and then looked at the size and/or shape of some cusps. Table 6 summarizes the introspection reports for the single tooth tasks.
18
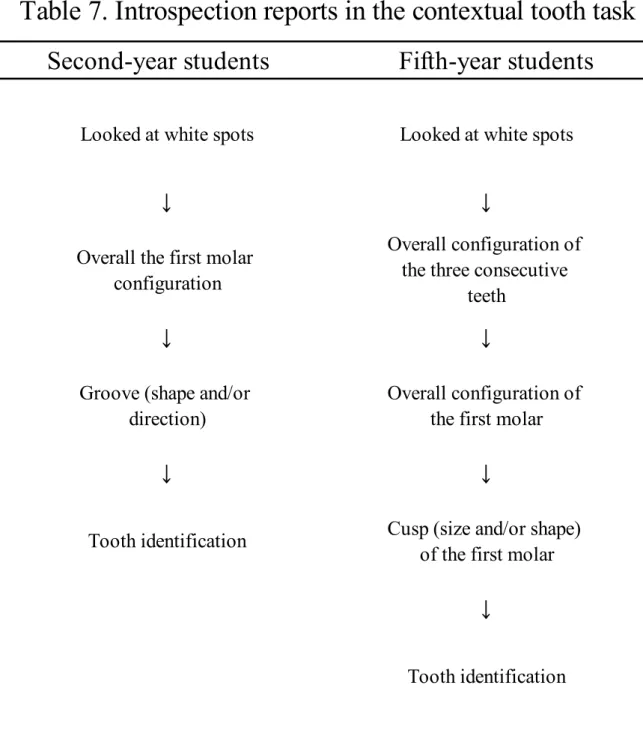
Table 7 II. Contextual tooth task
There were two examples of second-year students. One participant looked at the occlusal outline of the first molar and then focused on the shape of the buccal groove. Another participant checked the cusp number of the first molar (whether there were 5 cusps) and then focused on the direction of the distobuccal groove. The second-year students tended to observe the overall first molar
configuration and perform tooth identification by looking at the shape and/or direction of the groove.
For the fifth-year student, a participant looked at the entire outline of the three consecutive teeth, and paid attention to the first molar, especially near the mesiobuccal cusp. Another participant focused on the outline of the first molars of the three teeth. Second, his attention was paid to the buccal outline of the first molar. The fifth-year students first observed the overall configuration of the three consecutive teeth and paid attention to the overall first molar configuration.
Next, they observed the size and/or shape of the cusp of the first molar. Table 7 summarizes the introspection reports in contextual tooth tasks.
Discussion
19
1. The reaction time, P300 latency, and P300 amplitude
The reaction time and P300 latency indicate the difficulty level based on the length of the information processing time (25, 26). The brain has a limited capacity for information processing to take place at a time. The capacity for information processing is called processing capacity. The capacity for information processing changes depends on the experience of the participants. The P300 amplitude indicates the remaining processing capacity (15).
Since the reaction time, P300 latency, and P300 amplitude were not significantly different between the second-and fifth-year students (Figs. 4 to 6), the information processing time, and processing capacity showed no difference in the single tooth task.
In the contextual tooth task, the fifth-year students had a significantly shorter reaction time and P300 latency than the second-year students (Figs. 4 and 5). The fifth-year students had a significantly larger P300 amplitude than the second-year students, and a large interquartile range was observed (Fig. 6).
The results suggested that the fifth-year students processed information in a shorter time and with a smaller processing capacity than second-year students in the contextual tooth task and that fifth-year students had larger individual differences in processing capacity than second-year students.
20
In the second-year students, the contextual tooth task had a significantly longer reaction time and P300 latency than the single tooth task (Figs. 4 and 5).
However, the P300 amplitude was not significantly different between the contextual and single tooth tasks (Fig. 6). These results suggested that the contextual tooth task required a longer time than the single tooth task in information processing, and also suggested that there was no difference in processing capacity between the two tasks.
In the fifth-year students, the reaction time was not significantly
different between the two tasks, but the P300 latency was significantly longer in the contextual tooth task than in the single tooth task (Figs. 4 and 5). The P300 amplitude was significantly larger in the contextual tooth task than in the single tooth task (Fig 6). These results suggested that the contextual tooth task
required a longer processing time but a smaller processing capacity than the single tooth task.
2. PCA and introspection reports
As for the comparison between second-and fifth-year students in the single tooth task, PCA showed that pattern matching processing appeared as the first principal component, and semantic factors of the context appeared as the
21
third principal component in the second-year students (Table 3). The fifth-year students had the same first and third principal components as the second-year students. These results suggest that the factor patterns of the second-and fifth- year students had similar tendencies. The contribution rates of the pattern- matching processing (first principal component) were higher (>30%) than the other components (10~20% level). These results suggested that the pattern-
matching process occupied the most important position in information processing in the single tooth task. The appearance of P3a as the second principal
component in the fifth-year students also suggested that their attention was paid to theindigenous parts of each tooth.
In the contextual tooth task, PCA showed that pattern matching
processing appeared in the second principal component for both second-and fifth- year students, but the other principal components were different (Table 5). For the second-year students, semantic factors of the context appeared in the third principal component, and the localization process of attention appeared in the fourth principal component. These results showed almost the same pattern in the single tooth task. For the fifth-year students, semantic factors of the context, that is, P600 appeared in the first principal component with a higher contribution rate (>30%) than the other components (10~20% level). The P600 corresponds to the
22
lexical and semantic context when creating syntax in language comprehension (22-24). The context affects the understanding of the meaning of words and facilitates the recognition of words and sentences (5). Since the context in language and visual context has similar effects on cognition (9, 11), the role of P600 can be extended to visual tasks to guide spatial attention. The second-year students indicated information processing patterns approximately the same as the single tooth task, while the fifth-year students utilized the visual context as important in the information process (first principal component).
3. Educational curriculum and visual context
It takes six years to graduate from the School of Dentistry at Japan
University. The curriculum of Nihon University School of Dentistry at Matsudo is as follows: first-year students study liberal arts and include introductory subjects such as dental anatomy, second-to third-year basic dental sciences, third-to
fourth-year clinical and social dentistry, and fifth-to sixth-year clinical practical training at the hospital as a student doctor (27). The second-year students studied tooth morphology in the first year through lectures and practical training. The practice was mainly sketch and identification using individual tooth models. Regarding dentition, that is, the arrangement and positional
23
relationship of teeth, they studied only through lectures. The fifth-year students gave clinical practice using dental models in the third and fourth years and were also taking clinical practical training at the hospital. It can be said that the difference in the curriculum between second-and fifth-year students is the difference in whether or not they practiced using dental models. More opportunities to experience dentition as grade progresses.
In the single tooth task, both second-and fifth-year students used visual information patterns formed by the morphological knowledge of each tooth (17).
In the contextual tooth task, the second-year students identified by similarly focusing on only one tooth in the single tooth task, and they did not make
effective use of the visual context. On the other hand, fifth-year students gained experience in dental work with dentition through clinical practical training and were able to effectively utilize the visual context. Even when students studied the same educational course, they might not be able to use the same abilities. More individual differences were noted in the fifth-year students than in the second- year students.
The fifth-year students were able to use visual context as it was likely due to practical training experience using dentition models and practical training experience at the hospital. The fifth-year students were likely to have large
24
individual differences in processing capacity.
Acknowledgments
I would like to thank Professor Takanori Ito for cooperation in conducting this study.
Conflicts of Interest
The author has no conflicts of interest to declare.
25
References
1. Scheid RC, Weiss G: Woelfel’s Dental Anatomy. 8th ed., 2012, Lippincott Williams & Wilkins, Philadelphia, USA.
2. Nelson SJ, Ash Jr MM: Wheeler’s Dental Anatomy, Physiology, and Occlusion.
9th ed., 2010, Elsevier, St. Louis, USA.
3. Kondo S, Nakamura M, Matsuno M: Dental Anatomy. 2nd ed., 2016, Wakaba Publish., Tokyo, Japan. (in Japanese)
4. Fujita T, Kirino T, Yamashita Y: Textbook of Dental Anatomy. 22th ed., 1995, Kanehara Publish., Tokyo, Japan (in Japanese).
5. Nakazima Y, Andou K, Koyasu M, Sakano Y, Shigemasu K, Tachibana M, Hakoda Y eds.: The Yuhikaku Dictionary of Psychology. 1999, Yuhikaku, Tokyo, Japan. (in Japanese)
6. Ebihara T: Changes in event-related potentials associated with mental rotation. Jpn J Oral Diag, 26: 141-148, 2013. (in Japanese)
7. Kuwahara K, Ebihara T: Event-related potentials related to pattern recognition of teeth based on body schema. Jpn J Oral Diag, 27: 133-141, 2014. (in Japanese)
8. Nageishi Y, Shimokochi M: Brain event-related potentials and human information processing. Bull Fac Human Sci Osaka Univ, 7: 141-172, 1981.
26
(in Japanese)
9. Ogawa H, Yagi A: The effect of visual context on visual attention. Jimbun- Ronkyu, 52: 55-69, 2002.(in Japanese)
10. Oliva A, Torralba A, Castelhano MS, Henderson JM: Top-down control of visual attention in object detection. Proceedings ICIP, 1: 253-256, 2003.
11. Ogawa H, Yagi A: The guidance of visual attention by contextual cueing. Jpn Psychol Rev, 45: 213-224, 2002. (in Japanese)
12. Chun MM, Jiang Y: Contextual Cueing: Implicit learning and memory of visual context guides spatial attention. Cogn Psychol, 36: 28-71, 1998.
13. Momohara S, Aoki S: A study on perceptual processing of teeth images with occluded areas based on the analysis of event-related potential. IJOMS, 18:
277-286, 2020.
14. Klem GH, Lüders HO, Jasper HH, Elger C: The ten-twenty electrode system of the International Federation. Electroencephalogr Clin Neurophysiol, 52 (suppl): 3-6, 1999.
15. Polich J: Updating P300: an integrative theory of P3a and P3b.Clin Neurophysiol, 118: 2128-2148, 2007.
16. Yoshimura H: Introspection in visual transposition experiments. Jpn Psychol Rev, 34: 383-411, 1991. (in Japanese)
27
17. Doi K, Ebihara T, Aoki S: Comparisons based on event-related potentials in dental students with different levels of experience knowledge. IJOMS, 15: 98- 106, 2017.
18. Maekawa T, Tobimatsu S: A practical way to understand evoked potentials (4) Event-related potentials and mismatch negativity. Clin Electroencephalogr, 47: 775-787, 2005. (in Japanese)
19. Patel SH, Azzam PN: Characterization of N200 and P300: Selected studies of the event-related potential. Int J Medical Sci, 2: 147-154, 2005.
20. Nageishi Y, Shimokochi M: Comparison of early negativities (NA, MMN. and N2b) in N200 latency range.Jpn J Physiol Psychol Psychophysiol, 8: 19-30, 1990. (in Japanese)
21. Kok A: On the utility of P3 amplitude as a measure of processing capacity.
Psychophysiol, 38: 557-577, 2001.
22. Kuperberg GR: Neural mechanisms of language comprehension: challenges to syntax.Brain Res, 1146: 23-49, 2007.
23. Friederici AD: Towards a neural basis of auditory sentence processing. Trends Sci, 6: 78-84, 2002.
24. Brouwer H, Crocker MW: On the proper treatment of the N400 and P600 in language comprehension.Front Psychol, 8, 1327, 2017.
28
25. Takada Y: Reaction time and information in the discrimination of length of lines. Jpn Psychol Res, 9: 14-24, 1960.
26. Sata Y, Inagaki M, Shirane S, Kaga M: Visual perception of Japanese characters and complicated figures: Developmental changes of visual P300 Event-Related potentials. No-to-Hattatsu, 34: 300-306, 2002. (in Japanese) 27. Nihon University School of Dentistry at Matsudo: Syllabus for the year 2020.
viewed 5 Feb 2021 <https://www.mascat.nihon-u.ac.jp/> (in Japanese)
29
Figure legends
Fig. 1 Event-related potential measurement analysis system.
Electroencephalography extracted from Pz was used.
Fig. 2 Presentation image used for the single tooth task.
Fig. 3 Presentation image used for the contextual tooth task.
Fig. 4 Box plot of the reaction time.
n = 15 for both second and fifth-year students.
* Wilcoxon rank-sum test and between tasks were compared using the Wilcoxon signed-rank test, with Bonferroni correction (p <0.05). The rectangular box represents the interquartile range, and the line across the box indicates the median value. From the two ends of the box, lines extending outward to the upper end represent the maximum value, and the lower end represents the minimum value.
Fig. 5 Box plot of the P300 latency.
n = 15 for both second and fifth-year students.
30
* Wilcoxon rank-sum test and between tasks were compared using the Wilcoxon signed-rank test, with Bonferroni correction (p <0.05). The rectangular box represents the interquartile range, and the line across the box indicates the median value. From the two ends of the box, lines extending outward to the upper end represent the maximum value, and the lower end represents the minimum value.
Fig. 6 Box plot of the P300 amplitude.
n = 15 for both second and fifth-year students
* Wilcoxon rank-sum test and between tasks were compared using the Wilcoxon signed-rank test, with Bonferroni correction (p <0.05). The rectangular box represents the interquartile range, and the line across the box indicates the median value. From the two ends of the box, lines extending outward to the upper end represent the maximum value, and the lower end represents the minimum value.
31
Table and Figure
32
Table 1. Correct answer rate of task (%)
Correct answer rate were compared by a chi-square test between second and fifth-year students, but the differences were not significant.
n=15, Mean±SD
Single tooth Contextual tooth
98.1 ± 1.4
99.1 ± 1.7 98.4 ± 3.0 98.3 ± 2.8 Second-year
students Fifth-year
students
33
Latency (ms) PC1 PC2 PC3 PC4 ERP components PC1 PC2 PC3 PC4
91-120 0.900 0.322 -0.057 0.152 0.792 -0.412 0.297 -0.122
121-150 0.956 0.125 -0.024 0.098 0.905 0.347 -0.044 -0.026
151-180 0.963 0.193 0.025 0.142 0.953 0.166 -0.100 -0.036
181-210 0.978 0.140 0.095 0.059 0.974 0.077 -0.071 0.003
211-240 0.957 0.120 0.200 0.044 0.986 -0.077 -0.065 0.045
241-270 0.950 0.103 0.156 0.125 0.944 -0.178 0.042 0.135
271-300 0.776 0.480 -0.119 0.252 0.911 -0.125 0.166 -0.009
301-330 0.662 0.536 -0.166 0.368 0.838 -0.249 0.227 -0.174
331-360 0.316 0.206 0.079 0.828 0.758 0.632 -0.037 -0.062
361-390 -0.026 0.359 0.185 0.868 0.428 0.875 0.048 -0.043
391-420 0.509 0.335 0.349 0.453 -0.145 0.941 0.181 0.030
421-450 0.013 0.694 0.142 0.399 0.009 0.937 0.159 0.049
451-480 0.482 0.751 -0.076 0.119 -0.243 0.842 0.306 -0.038
481-510 0.201 0.917 0.057 -0.077 -0.319 0.212 0.483 0.374
511-540 0.302 0.911 -0.008 0.118 0.026 -0.099 0.503 0.763
541-570 0.260 0.846 0.211 0.382 -0.072 0.004 -0.049 0.940
571-600 0.083 0.888 0.465 0.301 -0.006 0.052 0.217 0.937
601-630 0.188 0.489 0.798 0.105 0.306 -0.038 0.725 0.498
631-660 0.121 -0.089 0.938 0.145 0.369 0.061 0.862 0.102
661-690 -0.081 0.003 0.913 0.053 0.114 0.501 0.782 0.097
691-720 -0.096 0.051 0.495 -0.104 -0.189 0.481 0.777 0.133
721-750 0.118 -0.138 0.336 0.160 -0.393 0.572 0.593 -0.009
Eigenvalue 7.4 5.4 3.0 2.3 8.1 5.0 3.7 2.9
contribution
rate (%) 33.4 24.4 13.7 10.5 36.7 22.5 16.9 13.0
P600
Table 2. Trends in extraction of ERP waveform components for the single tooth task
Second-year students Fifth-year students
Factor loadings for the principal components (PC) with eigenvalues were 2 or higher were shown, and 0.7 or more were highlighted by yellow.
MMN N2b
P3a
P3b
34
Pattern matching process
Table 3. Meaning of extracted ERP component of the single tooth task
Pattern matching process PC1
Process of updating working memory
Localization process of attention
Semantic factors of the context
Second-year students Fifth-year students
PC2
PC3
PC1
PC4
Process of updating working memory
Semantic factors of the context
Localization process of attention
PC2
PC3
PC4
35
Latency (ms) PC1 PC2 PC3 PC4 ERP components PC1 PC2 PC3 PC4
91-120 -0.258 0.755 -0.121 0.365 0.407 0.744 -0.184 0.051
121-150 0.140 0.844 0.227 0.024 0.433 0.774 0.047 -0.065
151-180 0.426 0.821 -0.004 0.033 0.133 0.855 0.088 -0.130
181-210 0.459 0.712 0.005 0.194 0.017 0.793 -0.069 -0.401
211-240 0.399 0.797 0.122 -0.040 0.100 0.905 -0.044 -0.362
241-270 0.006 0.882 0.288 0.058 -0.017 0.937 -0.153 -0.038
271-300 -0.215 0.702 0.145 0.391 -0.087 0.751 0.079 0.575
301-330 0.055 0.477 0.469 0.435 -0.105 0.413 0.536 0.422
331-360 -0.260 0.419 -0.430 0.485 -0.122 -0.071 0.844 0.258
361-390 0.079 0.234 0.275 0.803 0.265 -0.178 0.903 0.094
391-420 0.304 0.316 0.020 0.862 -0.059 0.019 0.920 0.101
421-450 0.533 -0.176 0.201 0.698 0.024 -0.067 0.618 0.672
451-480 0.726 -0.002 0.214 0.590 -0.081 -0.211 0.434 0.818
481-510 0.886 0.098 -0.010 0.395 0.186 -0.381 0.211 0.840
511-540 0.950 0.038 0.188 0.128 0.699 -0.205 0.063 0.627
541-570 0.880 0.236 0.280 0.066 0.924 -0.068 0.052 0.292
571-600 0.865 0.202 0.320 -0.143 0.966 0.039 0.075 -0.011
601-630 0.497 0.127 0.780 0.052 0.980 0.091 -0.011 -0.106
631-660 0.391 0.151 0.884 0.101 0.981 0.110 -0.008 -0.084
661-690 0.247 0.063 0.853 0.054 0.971 0.164 0.036 -0.073
691-720 0.095 0.106 0.967 0.090 0.956 0.242 -0.050 -0.020
721-750 -0.088 0.156 0.937 0.185 0.905 0.258 -0.139 0.162
Eigenvalue 5.4 5.1 5.1 3.2 7.4 5.4 3.5 3.3
contribution
rate (%) 24.3 23.4 23.1 14.7 33.7 24.5 15.7 14.9
Factor loadings for the principal components (PC) with eigenvalues were 2 or higher were shown, and 0.7 or more were highlighted by yellow.
MMN N2b
P3a
P3b
Second-year students Fifth-year students
P600
Table 4. Trends in extraction of ERP waveform components for the contextual tooth task
36
Table 5. Meaning of extracted ERP component of the contextual tooth task
Second-year students Fifth-year students
PC1 Process of updating working
memory Semantic factors of the
context PC1
PC4 Localization process of
attention Process of updating working
memory
PC2 Pattern matching process Pattern matching process
PC3 Semantic factors of the
context Localization process of
attention PC2
PC3
PC4
37
↓ ↓
↓ ↓
↓ ↓
Table 6. Introspection reports in the single tooth task
From the content of the introspection reports, the information processing of each participants can be inferred.
Overall tooth
configuration Overall tooth
configuration
Tooth identification Tooth identification Groove (shape and/or
direction) Cusp (size and/or shape)
Looked at white spots Looked at white spots
Second-year students Fifth-year students
38
↓ ↓
↓ ↓
↓ ↓
↓
Table 7. Introspection reports in the contextual tooth task
Tooth identification Cusp (size and/or shape) of the first molar
Second-year students Fifth-year students
From the content of the introspection reports, the information processing of each participants can be inferred.
Overall the first molar configuration
Overall configuration of the three consecutive
teeth
Tooth identification Overall configuration of
the first molar Groove (shape and/or
direction)
Looked at white spots Looked at white spots
39
40
41
42
43
44