The Financial Growth of Multinational Upstream Oil and Gas Companies : M&A, Functional
Currencies, and Impairment Losses
著者 MATSUBARA Fumihiko
著者別名 松原 文彦
その他のタイトル 多国籍石油ガス上流企業の財務成長 : 合併買収、
機能通貨、及び減損損失 page range 1‑120
year 2020‑03‑24 学位授与番号 32675甲第476号 学位授与年月日 2020‑03‑24
学位名 博士(経営学)
学位授与機関 法政大学 (Hosei University)
URL http://doi.org/10.15002/00023030
法政大学審査学位論文
The Financial Growth of Multinational Upstream Oil and Gas Companies: M&A,
Functional Currencies, and Impairment Losses
(邦題:多国籍石油ガス上流企業の財務成長:
合併買収、機能通貨、及び減損損失)
Fumihiko Matsubara
(松原文彦)
ii
Table of Contents Chapter 1. Introduction
1. Background and motivation 2. Focus and macro environment 3. Scope of the study
Chapter 2. Growth through M&A and research questions
1. Introduction
2. Corporate growth by M&A and limitation of Penrose’s theory 2.1 Corporate growth by M&A
2.2 Limitation of Penrose’s theory 3. Valuation of acquisition price: goodwill 4. M&A and impairment losses
4.1 Impairment of goodwill
4.2 Growth through project management 4.3 Impairment of long-lived assets
4.3.1 Research questions: Impairment losses
5. Choice of functional currency and corporate value in international M&A 5.1 Research questions: Functional currencies
6. The case of Japan: A problem of undersized companies
6.1 Research questions: Japanese upstream oil and gas companies 7. Categorization of top performers
7.1 Major oil companies 7.2 National oil companies
7.3 National flag oil companies (NFOCs) 7.4 Independent oil companies
Chapter 3. Growth path of Japanese companies
1. Introduction 2. Previous research
2.1 Players in the market
2.1.1 Government-owned upstream oil and gas companies
2.1.2 Private companies: Petroleum company- (refinery- ) led groups 2.1.3 Private upstream oil and gas companies: General trading firms 3. Discussion and analysis for Japanese upstream oil and gas companies
3.1 Research question (1) for Japanese oil and gas companies: Issues of undersized firms
3.2 Merger between two of Japan’s national flag companies 3.3 Japanese government’s ownership
3.4 Research question (2) for Japanese upstream oil and gas companies: CERA vs. Abo et al.
3.5 Results of interview
4. Implication for Japanese upstream oil and gas companies
Chapter 4. Functional currencies
1. Introduction: Role of functional currencies for multinational oil companies 2. Functional currencies by categories
2.1 Functional currencies for major oil companies 2.2 Functional currencies for national oil companies 2.3 Functional currencies for national flag oil companies
2.4 Functional currencies for independent oil and gas companies 3. Non-US oil and gas companies with US dollars as functional currency
3.1 (a) US dollars as pegged currency
3.2 (b) Globalized operations for independent oil and gas companies 3.3 (c) Functional currency selection in hyperinflation
3.4 (d) Functional currency selection in high-inflation but not hyperinflation states
4. Change in functional currencies 4.1 PTTEP
4.2 Aker BP
5. Implication for Japan’s NFOC: Inpex
Chapter 5. Impairment losses
iv
1. Introduction: Shale revolution and impairment losses
2. M&A and project management in upstream oil and gas companies 3. Data survey and analysis
3.1 Analysis by functional currency: US dollars and non-US dollars 3.2 Analysis by impairment amount: No or reversal of impairment losses 3.3 Analysis by impairment loss: More than US$ 5 billion
3.3.1 Shell (One major oil company)
3.3.2 Pemex, Petronas, and Statoil (Three export-oriented national oil companies)
3.3.3 Total, Petrobras and Eni (Three import-oriented national flag companies)
3.3.4 Anadarko, Devon Energy, Chesapeake, EOG, BHP Billiton, and Occidental (Six independent oil companies)
4. Hedge accounting
5. Oil and gas price hedging
6. Contracts in oil and gas upstream business
7. Implication for Japanese upstream oil and gas companies
Chapter 6. Conclusion
1. Introduction
2. Japanese upstream oil and gas companies 2.1 Too little for too many
2.2 Paved or unpaved road 3. Functional Currency
3.1 Clear tendencies
3.2 US dollars for stabilization and globalization 3.3 Discretion is limited
4. Impairment losses
4.1 Impairment losses: Russian ruble vs. US dollars 4.2 Uniquely positioned
4.3 Companies that are not keen on using hedge accounting and dysfunction in natural hedging
Limitation of study
Acknowledgement References
Internet Access to Annual Reports/Financial Statements Data Sources and News
Appendix 1 Appendix 2
Chapter 1. Introduction
1. Background and motivation
I have been in the energy industry for nearly two decades as an employee of a Japanese general trading firm, in charge of a variety of energy-related businesses. Much of my role entails acquiring overseas upstream oil and gas assets through mergers and acquisitions (M&A). To be clear, it is not a job for just one person, as M&A projects are driven by the team. I joined this team as a subordinate at a young age and went on to lead it. I have performed integral roles as the team’s business development manager to carry out various aspects of M&A, such as conducting feasibility studies, due diligence, negotiating economic valuation with sellers, analyzing risk returns for projects, obtaining and managing corporate approvals, and utilizing project finance as a limited recourse of financial responsibility. The total value of M&A in which I have participated in the upstream oil and gas industry, including both company and asset acquisitions, is approximately US$ 600 million. Our team completed seven M&A deals between 2003 and 2019. The results of my M&A experiences were not all positive. Some projects went well, while others did not due to external factors such as high oil and gas prices, or internal factors, such as poor project management and an underestimation of risks.
In this study, I will examine three points gleaned from my personal experiences: (1) the growth path of Japanese upstream oil and gas companies, (2) functional currencies used in the target companies, and (3) impairment losses in the upstream oil and gas business. These three factors relate to a practitioner’s viewpoint. This work is an empirical study on multinational oil companies since 2010s following the shale revolution in the US. There are many definitions of
“financial growth.” Some scholars argue that it means increasing and maximizing total revenues.
Others argue that it refers to total assets or net profits after tax. In this study, financial growth means increasing total revenues, net profits after tax, and total assets. Total revenues for upstream oil and gas companies are generally the sum of the production volume of crude oil and natural gas times crude oil and natural gas prices. Total revenues are employed as a useful indicator for financial growth in this study. Total assets can be considered business resources for firms. Net profits after tax can be considered as a value created for one fiscal year from the firm’s resources.
Crude oil and natural gas play vital roles in the world economy. Table 1-1 compares the numbers given in Edith Penrose’s book The Large International Firm in Developing Countries:
The International Petroleum Industry (1968) with the 2018 figures. Between 1966 and 2018, world crude oil production has increased by approximately 280%.
Table 1-1. Comparison between 1966 and 2018
Penrose’s data as of 1966 2018
World crude oil production 34 million barrels per day1 94.7 million barrels per day World estimated population 3 billion2 7.6 billion
Crude oil per person More than 0.5 tons 0.59 tons
World’s largest producer The United States The United States
Source: BP Statistical Review of World Energy 2019, United Nations (Department of Economic and Social Affairs)
We see that the US was the world’s largest producer in 1966 and 2018. However, the US was not always the largest producer during this period. The largest producer has always been one among the US, Russia, or Saudi Arabia. The US was the largest crude oil producer from 1966 to 1984, with the exception of 1980 and 1981. Russia was the largest oil producer between 1985 and 1991. From 1992 until 2013, Saudi Arabia took the lead, with the exception of 2009 and 2010. The US again became the largest oil producer from 2014 to 2018, except in 2016.
Figure 1-1 shows the historical oil production trends for the US, Russia, and Saudi Arabia.
Figure 1-1. Historical oil production trend for the US, Russia, and Saudi Arabia (thousand barrels per day)
34
Source: Generated by the author from BP Statistical Review of World Energy 2019.5
1 According to the BP Statistical Review of World Energy 2019, global crude oil production was 34,561 thousand barrels per day in 1966 (https://www.bp.com/en/global/corporate/energy-economics/statistical-review-of-world- energy.html; accessed on July 3, 2019)
2 According to the United Nations Department of Economic and Social Affairs, Population Division, the world population was 3,407,923 thousand in 1966 (https://esa.un.org/unpd/wpp/Download/Standard/Population/ (accessed on April 3, 2019).
3The total volume includes crude oil, shale oil, oil sands, condensates, and natural gas liquids, such as ethane, LPG, and naphtha. The total volume excludes liquid fuels from other sources such as biomass and derivatives of coal and natural gas (BP Statistical Review 2019 of World Energy 2019, p. 16).
4Russia’s figures for crude oil production were unknown until 1985.
5The author downloaded the data from BP Statistical Review of World Energy 2019 and generated Figure 1-1.
3
As global production grows, upstream oil and gas companies become bigger. According to a world investment report of the United Nations Conference on Trade and Development (UNCTAD), five6 of the top 10 companies among the world’s top 100 non-financial multinational enterprises (MNEs) were multinational oil and gas companies when ranked by foreign assets in 2017. Additionally, 14 petroleum companies were listed in the world’s top 100 non-financial MNEs7 when ranked by foreign assets in 2018.
2. Focus and macro environment
Crude oil and natural gas are extracted simultaneously but processed and refined separately.
While crude oil is refined to produce oil products, natural gas can be transported by pipelines or converted into liquefied natural gas (LNG). Some oil and gas companies are highly integrated, while others focus solely on either upstream or downstream processes. Figure 1-2 shows the value chain of the oil and gas industry. Crude oil and natural gas are produced underground simultaneously through wells and follow the separation of liquid and gas. They are processed differently, as shown by the trajectory going from the left of Figure 1-2 to the right. This study focuses on the upstream oil and gas industry, as that is the industry in which I have worked for nearly two decades. Natural gas can be transported by pipelines or ships once it becomes liquefied natural gas.
Figure 1-2. Value chain of oil and gas
Source: The author. Based on the sources in Appendix 1.
Available online at: https://www.bp.com/en/global/corporate/energy-economics/statistical-review-of-world- energy.html (accessed on July 3, 2019)
6 Royal Dutch Shell (1st), Total (3rd), BP (4th), ExxonMobil (7th), and Chevron (10th).
7 United Nations Conference on Trade and Development (UNCTAD), World Investment Report, Annex Tables 19, The world’s top 100 non-financial MNEs, ranked by foreign assets in 2018. Available online at:
https://unctad.org/en/Pages/DIAE/World%20Investment%20Report/Annex-Tables.aspx (accessed on July 25, 2019)
The shale revolution in the US surprised industry participants, leading to steady growth in production (BP 2016, p. 53). Technology developed by George P. Mitchell of Mitchell Energy together with Devon Energy and Chesapeake made it possible to extract hydrocarbons from shale reservoirs (Heck and Rogers, 2014). Since the shale revolution influenced the supply–
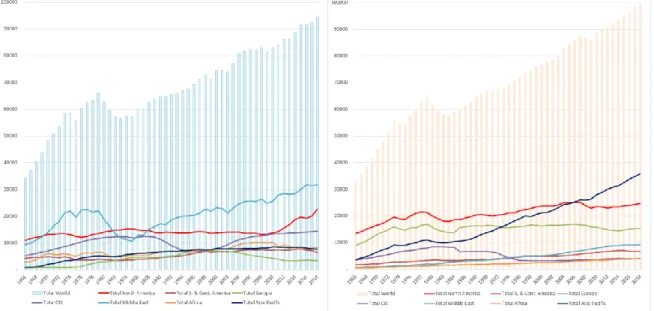
demand balance, upstream oil and gas companies had to cope with the changing environment in order to prevent financial losses. Figure 1-3 shows figures for global crude oil production and consumption since 1966. In general, both production and consumption are increasing steadily.
Figure 1-3. Crude oil production (left) and consumption (right) since 1966 (thousand barrels per day)
Source: Generated by the author from BP Statistical Review 2019.8
Figure 1-4 shows the FOB spot prices of West Texas Intermediate (WTI) at the Cushing, Oklahoma delivery point since 1986. Unlike the steadiness of crude oil production and consumption, crude oil prices (WTI) have been volatile. Figure 1-5 shows a count of the equipment used for drilling, called a “rotary rig,” done by Baker Hughes in the United States;
this count is also volatile. The state of Texas is leading the rotary rig count. The number of rotary rigs indicates a US production increase. Figure 1-5 shows that production in Texas is the key driver of the US production increase, which is one of reasons for the significant oil price decrease since 2014.
8 BP offers downloadable Excel files of crude oil production and consumption data since 1966, organized geographically. Available online at: https://www.bp.com/en/global/corporate/energy-economics/statistical-review-of- world-energy.html (accessed on July 3, 2019).
5
Figure 1-4. West Texas Intermediate (WTI) spot price FOB (USD/barrel) since 1986
Source: Generated by the author from data provided by US Energy Information Administration (EIA).9 Figure 1-5. Rotary rigs for selected US states
Source: Generated by the author from data provided by Baker Hughes, “North America Rig Count.”10
9EIA webpage: https://www.eia.gov/dnav/pet/hist/RWTCD.htm (accessed on October 10, 2018).
10Baker Hughes Rig Count: https://rigcount.bhge.com/na-rig-count (accessed on July 24, 2019).
3. Scope of the study
The scope of analysis for each chapter is as follows. There are six chapters. Chapter 2 explains the theory of firm growth developed by Edith Penrose in her 1959 book The Theory of the Growth of the Firm. I clarify how the three points I raised are related to Penrose’s theory. I also point out how the valuation of the acquisition price in M&A transactions may generate goodwill.
I further point out the limitations of Penrose’s theory in light of these three points. Chapter 2 also explains the difference between Penrose’s theory of firm growth and the notion of financial growth used in this study.
I sorted the top-tier oil and gas companies into four groups: major oil companies, national oil companies (NOCs; export-oriented, government-owned), national flag oil companies (NFOCs; import-oriented companies representing a nation), and independent oil companies.
This classification plays an important role in organizing this study.
Chapter 3 discusses the study’s first main point, regarding the growth paths of Japanese upstream oil and gas companies. Scholars and practitioners have often asked whether Japan can create an internationally competitive upstream oil and gas company (Kikkawa, 2003; Koike et al, 2008; Matsubara, 2019). The key question is whether Japanese companies should pursue the paved road to growth taken by other large oil and gas companies (Jackson and Hobbs, 2006) or whether they should create their own path by adapting technologies to create higher efficiency, which is their core competency (Abo et al., 2008). Chapter 3 shows that, with the exception of China, no other country has more than two national flag oil companies; Japan has two. Previous studies suggest that one of the issues for Japan’s upstream oil and gas companies is that there is
“too little for too many.” Chapter 3 discusses if merging Japan’s two national flag oil companies would make sense.
Chapter 4 discusses functional currencies in oil and gas companies. An entity’s functional currency is the currency of the primary economic environment in which the entity operates (PwC Japan, 2016). The functional currency could be a different currency from the one in the financial statements. The currency in which the financial statements are presented is the presentation currency (PwC Japan, 2016). I conducted data surveys of functional currencies among the top 50 oil and gas companies ranked by Energy Intelligence. I categorized them into four groups: major oil companies, national oil and gas companies (export-oriented), national flag oil and gas companies (an import-oriented nation’s representative), and independents. As cross-border M&A grow, the importance of knowing the issues around functional currencies increases, as they serve as measures of companies’ resources. Managers always seek to improve
7
their managerial decisions, which makes it essential to have a performance-measurement tool (Meyer, 2004).
Chapter 5 discusses impairment losses. The oil price crunch in 2015 revealed the close relationship between impairment losses and the upstream oil and gas industry. The impairment losses were incurred in various currencies, especially after M&A. I examine the general tendencies among the four groups outlined earlier and shed light on impairment losses in the oil and gas industry.
Chapter 6 summarizes the previous chapters and concludes the study. This work sheds light on the operational and financial growth paths for Japanese upstream oil and gas companies. This study asks how multinational upstream oil and gas companies would grow financially through investments in M&A and project management. This study also stresses the close relationship between impairment losses and upstream oil and gas companies. M&A can help companies grow. However, upstream oil and gas companies are also exposed to impairment losses after M&A. This study offers several implications that could help Japanese upstream oil and gas companies become internationally competitive.
Chapter 2. Growth through M&A and research questions
1. Introduction
In chapter 2, I discuss the following five points: (a) corporate growth via M&A and the limitations of Penrose’s theoretical considerations, (b) the valuation of acquisition prices in M&A transactions that may generate goodwill, (c) M&A and impairment losses, (d) the choice of functional currency and corporate value in international M&A, and (e) a case of Japanese upstream oil and gas. Further, I discuss the topic of (e) in chapter 3, the topic of (d) in chapter 4 and the topic of (c) in chapter 5.
2. (a) Corporate growth by M&A and the limitation of Penrose’s theory 2.1 Corporate growth by M&A
Penrose (1959) discussed the growth path for firms using M&A for external expansion (p. 195).
She considered M&A as not just company acquisitions but also asset acquisitions (pp. 173–175).
Penrose (1959) stated that “if a planned expansion is considered profitable regardless of any change in the existing position of other producers or in the distribution of the ownership of existing industrial assets, then the firm will choose to expand through acquisition only if acquisition is considered cheaper than internal expansion” (p. 156). There is evidence that cross- border M&A have increased (UNCTAD, 201811; Xie et al., 2017; Hagen and Prettl, 2017;
Shimizu et al., 2004). A situation in which the target firms’ resources are necessary for the buyer’s business expansion supports M&A, as Penrose (1959) explained. If the target firms’
resources are not only denominated and presented differently but also controlled and managed in different currencies, this impacts the buyer firm’s M&A strategy.
Gadiesh et al. (2001) emphasized the importance of performing integration, designing the new company, and executing strategies. Marks and Mirvis (2011) pointed out the behavioral and cultural factors influencing M&A success, focusing on pessimistic mindsets, downsizing, and restructuring. Appelbaum et al. (2000a; 2000b) also discussed the behavioral approach, focusing on communication and corporate culture during the pre- , during- , and post-acquisition phases.
It appears that M&A are a popular methodology for company growth (Shimizu et al., 2004).
However, they are not always successful. Bower (2001) pointed out that nearly 70% of M&A fail, when they do not meet executives’ financial expectations. Sharifi et al. (2005) pointed out
11 UNCTAD (2018) stated that “the aggregate value of net cross-border M&As, which had been on the rise since 2013, contracted in 2017. The number of M&A transactions, however, sustained its upward trend to almost 7,000” (p.
24). Available online at: https://unctad.org/en/PublicationsLibrary/wir2018_en.pdf (accessed on July 25, 2019)
9
the lack of a strategic approach among M&A failures and explained the importance of sharing the M&A strategy between business groups. They also depicted the pre-M&A process flow, describing the exact steps to take when approaching a target company and executing the transaction. Gomes et al. (2013) divided M&A into pre- and post-M&A phases. The pre-M&A phase evaluates the project, and the post-M&A phase controls the acquired assets.12
M&A have grown in size and become more internationalized. The value of global M&A deal transactions in the upstream oil and gas industry in 2017 was US$ 172 billion (EY, 2017).
Galperina and Klen (2017) presented an overview of the global M&A trends in the energy sector and found cyclical movements—an upward and downward cycle of M&A deals in terms of timing. They also found a high proportion of unsuccessful deals. Domingues and Godoy (2012) discuss impairment losses among 19 multinational13 oil and gas companies between 2003 and 2008, showing that the highest impairment value disclosed among the 19 companies was US$ 2,455 million dollars, for PetroChina in 2008. They also argued that the impact of oil prices and constant discovery rates of proven reserves would prevent companies from incurring impairment losses.
One of consulting companies in the US, AT Kearney (2017), pointed out that 22% of all deals announced in 2015 were not consummated, accounting for US$106 billion (p. 3).
However, some scholars consider the merger between Exxon and Mobil to be successful (Caiazza et al., 2013; Cole, 2013). Previous studies suggest that M&A do not just combine two different corporate entities into one but also include human factors. I consider the relationship among impairment losses, M&A, and project management important, and I discuss it below.
2.2 Limitation of Penrose’s theory
Some scholars have made significant contributions to the study of management strategies.
However, traditional management strategy theories lack a consideration of an important aspect of financial growth for multinational corporations: fluctuations in financial growth due to currency volatility and impairment losses. These fluctuations may be caused by the volatility of crude oil prices and foreign currency risk exposure. As I will discuss in chapter 4, currency exchange rates have a particularly close relationship with crude oil prices, especially for oil- producing countries.
12 In this study, functional currency is an item of the pre-M&A phase and impairment losses is an item of the post- M&A phase.
13 The 19 companies were BP, Chevron, China Petroleum, ConocoPhillips, Eni, ExxonMobil, Hess, Marathon, Murphy, Petro-Canada, Petrobras, PetroChina, Repsol, Royal Dutch Shell, Sasol, StatoilHydro, Suncor, Total, and YPF.
Porter (1979) advocated the Five Forces model as a way to carry out a structural analysis of any industry. Porter’s five forces are the bargaining power of customers, the bargaining power of suppliers, the threat of new entrants, the threat of substitute products, and competitive rivalry within an industry. Nonaka et al. (2013) pointed out, however, that Porter’s five forces are useful for analysts but not helpful to businesses that are dynamically changing.
Kaplan and Norton (1993, 2000, 2005, 2007) developed the Balanced Scorecard tool.
Kaplan and Norton (1993) explained that the Balance Scorecard tool measures a company’s performance from four major perspectives: (1) financial, (2) customer, (3) internal process, and (4) innovation and learning. These four perspectives are vertically interrelated (Kaplan and Norton, 2000). However, Awadallah and Allam (2015) pointed out that the Balanced Scorecard (BSC) is limited, as it does not clearly define the relationship with organization performance, the objectives and definition of measures that exclude key stakeholders, and the success factors for the key performance indicators.
Another theory was advocated by Christensen (1997), who analyzed cheap, low-quality commodities that are seemingly not a threat to expensive, high-quality ones. However, the low- quality commodities influence the market and eventually become the dominant product, pushing the high-quality, expensive commodities out of the market. Christensen (1997) supported his theory by citing examples like hard disk drives, automobiles, mini mills for steel, computers, and printers. Christensen (1997) also pointed out that disruptive innovation requires a separate entity or strong firewalls, as the disrupting organization may not always coexist with the disrupted organization.
Penrose’s theory is extremely useful for explaining the significance of this study. Penrose’s theory explains how the firm can grow by separating its resources from its services. The concept of firm resources and services may seem to have something in common with accounting information, such as the balance sheet (what firms own) and profit and loss statements (what firms produce). Both concepts describe what firms own and what they produce from what they own. The business of the upstream oil and gas sector, where firms have hydrocarbon reserves and conduct oil and gas production, may seem to have something in common with accounting information. Upstream oil and gas companies have hydrocarbon reserves (what that own), and they produce crude oil and natural gas from hydrocarbon reserves (what they produce). I find Penrose’s theory quite helpful as a theoretical framework for this study. Table 2-1 describes what firms own and what firms produce from what they own in accounting and in the upstream oil and gas sector following Penrose’s theory.
11
Table 2-1. Commonality among Penrose’s theory, accounting, and upstream oil and gas business What firms own What firms produce
Penrose (1959) Resources Services
Accounting Balance Sheet Profit and Loss Statements
Upstream Oil and Gas Business Reserves and Resources Production of Oil and Gas Source: Elaborated by the author.
Penrose (1955) pointed out that firms do not grow automatically; they grow in response to human decisions (p. 532). Penrose (1955) also asked questions about the limitations of a firm’s growth in terms of size, which remain unanswered. Penrose (1959) quoted the CEO of a large US company who said that US$10 million in total revenue was the threshold for managing a company efficiently by managements (p. 163). Penrose seems to have considered firm growth to be driven by human decisions but questioned the limitations of firm growth. In this study, however, financial growth is considered in terms of how firms record their resources and managerial services numerically. In pursuing financial growth, especially in the upstream oil and gas business, firms are often exposed to financial turbulence such as impairment losses. In chapter 5, I discuss the close relationship between the upstream oil and gas business and impairment losses. Penrose’s theory concerns firm growth. Firms can grow via internal expansion (p. 66, p. 179), which means business growth without mergers, and via external expansion (p. 65, p. 195), which means business growth via M&A. This study discusses financial growth and how it is influenced by the selection of functional currencies and impairment losses. This point is the difference between Penrose’s theory of firm growth and the notion of financial growth applied in this study.
When Penrose (1959) discussed the theory of firm growth, it was still too early to have an accounting discussion of fair value measurements on assets. Impairment accounting was discussed extensively in the 1980s and was officially implemented in the 1990s with the Statement of Financial Accounting Standards (SFAS) No. 121.14 Fair value is defined as “the price that would be received to sell an asset or paid to transfer a liability in an orderly transaction between market participants at the measurement date” (PwC 2019, p. 4–2). Financial assets and liabilities are initially measured at fair value, but gains and losses are not considered as reversals of impairment losses or impairment losses. PwC (2009) explained that financial assets at fair value do not require impairment tests (if objective evidence), while “loans and receivables,” “held-to-maturity investments,” and “available-for-sale financial assets” do require impairment tests (p. 22).
14Financial Accounting Standards Board (superseded SFAS 121): https://www.fasb.org/jsp/FASB/Document_C/Doc umentPage?cid=1218220124181&acceptedDisclaimer=true (accessed on July 7, 2019).
Fair value measurements are not only a critical part of applying the acquisition method but are also important in post-acquisition accounting, including the various impairment tests required by both US Generally Accepted Accounting Principles (US GAAP) and International Financial Reporting Standards (IFRS). Under US GAAP, guidance for the impairment testing of indefinite-lived intangible assets and goodwill is provided in Accounting Standards Condition (ASC) 350, while guidance for long-lived assets is provided in ASC 360. Under IFRS, International Accounting Standards (IAS) 36 provides guidance for indefinite-lived intangible assets, goodwill, and long-lived assets (PwC 2019, p. 7–61).
Penrose (1959) may not have paid much attention to this. The managerial services that firms create depend on the quality of their resources. If they are impaired due to internal and/or external reasons, impairment losses follow. Management would need to determine how long to continue managerial services by relying on firms’ resources.
3. (b) Valuation of acquisition price: goodwill
The discounted cash flow (DCF) model is a common tool that firms undertaking M&A use to value the target company (Schweiger, 2002; Kanekiyo et al., 2013; Schweiger and Very, 2015).
Since M&A projects are often carried out in a competitive environment, a potential buyer may compete against other rival companies to acquire the same target company or target assets. The valuation of the target company or assets has to be high enough to win the competition once there are good reasons to justify the tender price. Some scholars have discussed the synergy values that acquisitions can create, such as cost synergies, revenue synergies, market power synergies, and intangible synergies (Schweiger and Very, 2015). However, Ficery et al. (2007) pointed out that synergy expectations are often not monetized, as they are usually described as intangible benefits, such as access to new markets, skills, or culture. As shown in Figure 2-1, Schweiger (2002) broke down acquisition amounts into “no synergies required,” “must capture some or all synergies,” and “overpaid” M&A. In this study, “overpaid” indicates impairment losses (p. 3).
13 Figure 2-1. Price, synergy, and value creation
Price Paid for target
Source: Schweiger, D. (2002) “M&A Integration: A framework for executives and managers” (p. 616 on Kindle ver.).
Once the M&A transaction is successfully closed, a process called “purchase price allocation”
(PPA) is conducted to record the transaction under US and international accounting standards for business combination. The purchase price of the target company must be allocated to the fair values of identifiable tangible and intangible assets, such as trademarks, technology, customer relationships, and order backlogs, in order to provide relevant information about the acquisition (Paugam et al., 2015, p. 363). Some scholars have also discussed PPA and goodwill. Goodwill is the residual value left after PPA, which allocates the purchase price to goodwill and identifiable intangible assets with finite lives (Zhang and Zhang, 2007).
Figure 2-2 Simplified depiction of PPA
Source: M&A online (translated by the author from Japanese to English).15
15M&A online, “M&A jitsumu” (Author’s English translation of “Practices in M&A”). Available online at:
https://maonline.jp/articles/ppa0372 (accessed on August 1, 2019).
Figure 2-2 shows a simplified depiction of PPA. Prior to PPA, goodwill includes intangible assets. Following PPA, a value for intangible assets is identified, leaving a residual value of goodwill without intangible assets.
4. (c) M&As and impairment losses
Impairment losses have a close relationship with the shale revolution in the upstream oil and gas industry. The shale revolution significantly influenced the global energy market, and industry participants were “repeatedly surprised by the strength of US tight oil and shale gas” (BP 2016, p. 53). The shale revolution did not originate from the major oil companies, NOCs, or large international oil companies, but from an entrepreneur named George Mitchell, the founder of Mitchell Energy. George Mitchell’s innovative method of hydraulic fracturing and horizontal drilling developed by Devon Energy turned the power balance between oil suppliers and oil buyers upside down (Heck and Rogers, 2014). The dynamism of the crude oil supply changed drastically due to the additional supply of US tight oil, shale gas, together with offshore Brazilian deep-water crude oil and crude oil from Canadian oil sands (BP, 2016, p. 27). The price of crude oil, which was once over US$100 per barrel in 2014, dropped to less than US$40 per barrel in 2016. This is one of the reasons why global upstream oil and gas companies incurred impairment losses. Companies that aggressively pursued business expansion through shale oil and gas M&A were exposed to significant impairment losses. This was especially true for independent US companies.
4.1 Impairment of goodwill
As shown in Figure 2-2, goodwill is defined as “the difference between the purchase price and the aggregate fair values of net tangible assets” (Ampofo and Sellani, 2005), and goodwill impairment is considered as “the difference between the book value of goodwill and the implied fair value of goodwill” (Seetharaman et al., 2006). Beatty and Weber (2006) discussed the FASB’s adoption of SFAS 142, Goodwill and Other Intangible Assets, under US GAAP in June 2001. Prior to this adoption, goodwill was recognized and amortized over a period under 40 years. SFAS 142 requires goodwill to have two-step impairment tests (SFAS 144): the undiscounted cash flow basis and discounted cash flow basis (EY, 2016, p. 36). Chalmers et al.
(2011) examined whether a goodwill impairment regime is better than amortization for determining the underlying economic value of goodwill. Godfrey and Koh (2009) found evidence suggesting that impairment write-offs after the introduction of the US goodwill impairment accounting regime (through SFAS 142) are negatively associated with firms’
15
underlying investment opportunities. Ketz and Schams (2003) discussed whether the new rules would discourage M&A activity. The difference between the impairment tests of US GAAP and IFRS was also discussed. IFRS does not allow two-step impairment tests16 for potential goodwill impairment (Jerman and Manzin, 2008; EY, 2018b, p. 25). Ramanna (2008) found evidence consistent with lobbying support for SFAS 142, which allowed an increase in firms’
discretion under the standard. Some scholars discussed the reasons for overpayment at the time of investment (Hake, 2004; Gu and Lev, 2011) while others investigated whether goodwill impairment is indicated predictively by performance parameters in the post-acquisition phase (Hayn and Hughes, 2006; Kabir and Laswad, 2014). Conversely, some scholars investigated the events after the announcement of goodwill impairment losses, such as declines in stock price (Hirschey and Richardson, 2003) and estimations of near-term future cash flow (Jarva, 2009).
Others argued that there is an incentive for goodwill impairment because of management’s desire to manage earnings (Sevin and Schroeder, 2005; Verriest and Gaeremynck, 2009).
4.2 Growth through project management
M&A are not the only forces causing impairment losses. The failure of project management in upstream oil and gas companies may also cause impairment losses. Project management in the upstream oil and gas industry proceeds in three stages: (1) exploration, (2) development, and (3) production (PwC Japan, 2016). Exploration activities in upstream oil and gas fields are considered risky in terms of project management because investment is necessary before it is determined whether the exploration will succeed. Penrose (1968) pointed out that “the risk that is said to be inherent in exploration is the risk that the knowledge obtained after the expenditure of large sums of money will be of little economic value” (p. 237). The increased risk is due to the lack of information on geological structures, reservoir seals, and hydrocarbon charges (Suslick et al., 2009). Projects in the development and production stages are also exposed to business risk. EY (2014) identified 365 projects with a proposed capital investment above US$1 billion in the upstream oil and gas, LNG, pipeline, and refining sectors in 2014. Of the 365 projects, 163 were identified as upstream oil and gas projects, with an average project capital expenditure of US$6.6 billion per project. EY (2014) further pointed out that 64% of the
16 EY (2018b) stated about long-lived assets that “The two-step approach requires that a recoverability test be performed first (the carrying amount of the asset is compared with the sum of future undiscounted cash flows using entity specific assumptions generated through use of eventual disposition). If it is determined that the asset is not recoverable, an impairment loss calculation is required” (p. 25). As for goodwill under US GAAP, EY (2018b) stated that “Before ASU 2017-04, Simplifying the Test for Goodwill Impairment, the company performs a recoverability test under the two-step approach first at the reporting unit level. After the adoption of ASU 2017-04, the company performs an impairment test under the one-step approach at the reporting unit level” (p. 28).
projects faced cost overruns, while 73% reported schedule delays.17 Project delay and cost overruns can be considered signs of poor project management, which may cause impairment losses. Wit (1988) explained how to determine whether a project was successfully delivered and pointed out that cost overruns and schedule delays are signs of failure. Asrilhant et al. (2004) described strategic project management as occurring in two stages: evaluation elements and control elements. Walkup and Ligon (2006) explained how “the stage-gate process allows the right decision to be made at the right time by the right people” (p. 2), taking upstream oil and gas projects from the feasibility study phase into the development phase followed by the production phase.
4.3 Impairment of long-lived assets18
The question of whether companies should adopt a methodology for successful efforts or the full costs of exploration is a matter of longstanding debate in the upstream oil and gas industry (Baker, 1976; Lilien and Pastena, 1982; Chen, K. and Lee, 1995; Aboody, 1996; Alciatore et al., 2000; Bryant, 2003; Abushaiba and Eldanfour, 2014; PwC Japan, 2016). The main difference between the full cost and successful effort methods is the treatment of costs for unsuccessful activities. Costs are capitalized in the full cost method whereas they are expensed in the successful effort method (Abushaiba and Eldanfour, 2014, p. 120).
The issues around the timing of expenses incurred, such as capital expenditure for exploration, are not limited to the exploration phase. If a project fails, it results in an impairment of long-lived assets. Riedl (2004) found evidence suggesting that the reporting of write-offs for long-lived assets under SFAS 121 has decreased qualitatively since the standard was applied.
Zucca and Campbell (1992) found examples of discretionary write-downs on long-lived assets from financial statements (77 write-downs across 67 firms) and indicated that no significant evidence of positive stock market reaction to the write-downs’ announcements could be found.
Kosi and Valentincic (2013) argued that discretionary write-downs are caused by the tax- minimization incentives of private firms. Cotter et al. (1998) pointed out that discretionary write-downs cause corporate governance issues that influence managers’ write-down decisions.
I argue that discretionary write-downs aggravate issues concerning reversals of impairment losses. EY (2018b) pointed out that impairment reversals are permitted under IFRS (with the exception of goodwill) while US GAAP prohibits such reversals. Some scholars argue that
17 EY (2014) found 205 projects with cost data available and 242 projects with time data available out of the 365 megaprojects identified (p. 4).
18To be clear, poor project management may not be the only cause of impairment losses for long-lived assets. Asset acquisitions that fail may also cause the impairment of long-lived assets.
17
reversals of impairment losses for long-lived assets could cause a “cookie jar” reserve type of earnings management (Duh et al., 2009; Abdelghany, 2005). One can use the reserve when needed to fill in financial losses just as one can eat a cookie when one is hungry. Others argue that managers may reverse impairment losses if they are incentivized by a bonus arrangement (Trottier, 2013). This phenomenon is also observed in regulatory listing requirements in China (Chen et al., 2009) and various performance parameters in Australia (Brown et al., 1992).
Duh et al. (2009) explained that the reversal of impairment losses is permitted under IFRS (IAS 36: revised in 2004) but that US GAAP prohibits such reversals (SFAS No. 121, superseded in 1995, and No. 144, issued in 2001 by FASB). FASB’s stance is that an impairment loss should result in a new basis for the impaired assets and explains that such a reversal provides managers the discretion to undertake earnings management.
4.3.1 Research questions: Impairment losses
Firm resources are regularly exposed to changes in the business environment, such as changes in crude and natural gas prices. Creating financial growth requires that management recognize the true value of the firm’s resources. If this value decreases significantly, it has to be written off as an impairment loss. This study considers that issue, along with financial growth for firms.
How can oil and gas companies manage the risk of impairment losses that arise when business circumstances change? In 2016, after the oil price crash, what were the general tendencies among the group(s) of top-tier oil and gas companies that incurred significant impairment losses? Can any company manage impairment losses? If yes, why? These questions will be explored in chapter 5.
5. (d) Choice of functional currency and corporate value in international M&A To achieve financial growth, firm managers must rely on accounting information. When accounting becomes the language of performance measurement, some aspects of functional currencies should be considered. Some scholars have discussed activity-based costing as a tool to manage costs, as accounting provides the information managers seek (Drucker, 1995; Ness and Cucuzza, 1995). As cross-border M&A become more popular, Revsine (1984) pointed out the potential for incompatibility among financial statements through the misuse of FASB guidelines, as firms could be “ill-advised to select the functional currency in order to gain some near-term income enhancement” (p. 514).
Functional currency issues are beyond simple currency conversion, as it becomes a burden for management and impacts post-M&A integration. In 2016, Shell, whose functional currency is the US dollar, acquired British Gas (BG), whose functional currency was the British pound
(GBP). In the acquisition, Shell chose to keep the US dollar as the functional currency. This meant that BG’s operation had to be adjusted based on Shell’s functional currency. Normally, the buyer can change the target company’s functional currency. However, if another company owns a majority share in the target, the buyer cannot change the target company’s functional currency if the majority shareholder is opposed. In some cases, it also influences the discount ratio for the calculation of acquisition value. Eiteman et al. (2016) explain the method of treating all foreign risk “as a single problem, by adjusting the discount rate applicable to foreign projects relative to the rate used for domestic projects to reflect the greater foreign exchange risk, political risk, agency costs, asymmetric information, and other uncertainties perceived in foreign operation” (p. 545). Penrose (1959) did not fully discuss functional currencies among firm resources. I discuss this in chapter 4.
The major currency translation methods for financial statements are the temporal method, in which the translation gains and losses are included as part of income, and the current rate method, in which the translation gains and losses are taken directly to owner’s equity (Ruland and Doupnik, 1988). Companies with a functional currency similar to that of their parent companies generally use the temporal method. Companies that use local currency as their functional currency employ the current rate method.19
Discussions regarding functional currencies are closely related to those on currency translation for foreign subsidiaries. A foreign subsidiary’s functional currency is the currency of the primary economic environment in which the subsidiary operates and in which it generates cash flows (Eiteman et al., 2016, p. 335). In other words, all other currencies are foreign.
Kikuya (2000) explained that foreign currency translation was not a big issue for practitioners in Japan until 1971 because of its fixed exchange rate system. As cross-border M&A grow, issues around functional currency are becoming more important for companies that have foreign currency exposure, particularly after the transition to a floating exchange rate system. It is also helpful in selecting a joint venture partner; approximately 71% of upstream ventures is financed through alliances or joint ventures (JVs; EY, 2015). The selection of a joint venture partner may also automatically mean the selection of a functional currency for JVs, unless one has absolute power and authority to change it. In minority stake acquisitions, it is important to recognize the consequences.
Arnold and Holder (1986) interviewed the executive managers of 22 US MNEs. Of the 18 companies that used local currencies as functional currencies, they found that only five had taken formal steps to address the six indicators mandated by the Financial Accounting Standards
19This study does not take into account the effect of financial growth resulting from the difference between
19
Board’s (FASB) Statement 52: Foreign Currency Translation. These indicators are cash flow, sales price, market sales, expenses, financing, and intercompany transactions and arrangements.
This survey indicates that, in practice, US multinational companies’ management teams exercised their discretionary power to select their functional currencies under FASB 52, particularly those that used local currencies as functional currencies. However, other scholars found no evidence indicating that the choice of functional currencies or other accounting choices by management were opportunistic or deceptive (Ayres, 1986; Taylor et al., 1990; Aiken and Ardern, 2003).
In 1983, of the 338 multinational corporations that selected a foreign currency as their functional currency, Doupnik and Evans (1988) found that only 126 made the appropriate choice to follow the steps mandated under the framework determined by US GAAP. Further, of the 102 companies that selected the US dollars as their functional currency, 99 followed the appropriate procedures required by the accounting rules. Their study indicates that companies that choose the US dollar as their functional currency adhere to FASB rules more strictly.
Bartov and Bodnar (1995) identified a significant lagged relationship between changes in the US dollar and company value under FASB. Companies using the US dollar as their functional currency have to report exchange-rate gains or losses on their income statement. This significant lagged relationship disappears for companies using a foreign currency as their functional currency, as they report an unrealized exchange-rate adjustment in the cumulative translation adjustment. According to Bartov and Bodnar (1995), the use of a foreign currency as the functional currency enables investors to determine the true foreign currency exposure of US companies.
Mehta and Thapa (1991) studied several US multinationals and the functional currencies of their subsidiaries. They discovered that Exxon’s (ExxonMobil) subsidiaries mainly used local currencies as their functional currencies, with the exception of operations in highly inflationary economies such as Norway, Malaysia, and the Middle East. There, they used the US dollar as the functional currency. However, all of Texaco’s (Chevron) subsidiaries used the US dollar as their functional currency. Both Exxon and Texaco carried out similar operations under US GAAP through their overseas subsidiaries; however, the former chose the local currency while the latter chose the US dollar as the functional currency. Mehta and Thapa (1991) also revealed that some US multinationals had changed their functional currencies in the past. For example, Exxon (ExxonMobil) changed the functional currency of its Norway operations from the US dollar to the local currency in 1985. Other companies whose international subsidiaries changed
companies that adopt the current rate method and those that adopt the temporal method.
to local currencies include Data General, General Electric, and Caterpillar Tractor. These companies’ functional currency was originally the US dollar, but it was changed to the respective local currency in the mid-1980s.
Nobes (2006) asserted that, in the United Kingdom, a company’s functional currency would generally be the currency of the country of operation. Aoki et al. (2016) found the same trend in Japan, indicating that 54 out of 61 Japanese companies that had adopted the International Financial Reporting Standards (IFRS) used the current rate method for currency translation, signifying that their functional currency must be the local currency. Taylor et al.
(1990) discussed functional currency choice and currency translation methods before the introduction of the Australian Accounting Standards, under which an agreement among firms regarding the method of translating foreign subsidiaries’ assets and liabilities has to be reached.
However, no such agreement could be reached regarding the reporting method for the resulting gains or losses. Some scholars have also discussed the choice of functional currency and currency translation from the viewpoint of purchasing power parity (Ruland and Doupnik, 1998), currency risk management in US multinationals (Duangploy et al., 1997; Shin and Soenen, 1999), as well as in hyperinflated20 (Ziebart, 1985; Duangploy and Owings, 1997) and moderately inflated economies (Morrison and Dole, 2014).
Several studies, such as Doupnik and Evans (1988) and Mehta and Thapa (1991), indicated that management has some discretion in choosing the functional currency as long as they abide by accounting rules.
5.1 Research questions: Functional currencies
It is essential to have a currency that measures the financial growth of firms. The functional currency plays this role. The selection of a functional currency also determines what become foreign currencies for firms.21 All impairment losses are also measured by the functional currency and are expressed in the presentation currency in financial statements.
This study asks the following research questions: Do functional currencies differ depending on the type of oil and gas company? Do any upstream oil and gas companies use another country’s currency as their functional currency? If so, why? Do the management teams of oil and gas companies have the discretion to choose the functional currency? If they do, why do they change it? What events cause a change in the functional currency? In addressing these
20Ziebart (1985) defined hyperinflation as a cumulative inflation rate of 100% over a three year period. Ziebart (1985) listed 18 countries that met this criterion: Argentina, Bangladesh, Bolivia, Brazil, Chile, Costa Rica, Ghana, Iceland, Israel, Mexico, Nicaragua, Peru, Sierra Leone, Somalia, Turkey, Uruguay, Yugoslavia, and Zaire (p. 23).
21 Hypothetically, a company in Southeast Asia that chose the US dollar as their functional currency would record
21
questions, I argue that it is necessary to shape accounting strategies to address functional currency issues.
6. (e) The case of Japan: A problem of undersized companies
Financial growth is influenced by the selection of a functional currency and impairment losses.
Turbulence is part of any financial growth. Here, I discuss the growth path that Japanese upstream oil and gas companies take. Two groups of scholars advocate two different directions.
Which strategy is better is debatable. This topic may not be directly related to this study’s focus on financial growth, but financial growth requires a steady growth path.
Why do some oil and gas companies outperform financially compared to others? Studies point to several reasons why the Japanese petroleum industry is vulnerable. First, there are many undersized companies in the industry. This is considered a “one-project, one-company structure,” in which a company is established for a specific project and does not participate in any others (Abo et al., 2008; Kikkawa, 2012; Thorarinsson, 2018). The presence of too many undersized companies leads to a loss of bargaining power, which could be an underlying cause of the “Asian premium” (Kikkawa, 2003). This premium causes oil and gas prices to be higher in the Asian market than in US and European markets (Ogawa, 2002; Doshi and D’Souza, 2010;
Zhang et al., 2018). Second, Abo et al. (2008) and Kikkawa (2012) found that the separation of upstream and downstream processes is at the root of the Japanese petroleum industry’s vulnerability. Upstream businesses are vulnerable to low oil prices because they have to sell crude oil, while the downstream business is vulnerable to high prices when their feedstock for refined oil products becomes costly. Firms that integrate upstream and downstream businesses are naturally hedged regardless of the oil and gas price environment. (I will discuss this point in chapter 5.) Third, Pollio and Uchida (1999) and Koike (2006) pointed out that a shortage of qualified geoscience engineers is another hurdle to creating internationally competitive oil and gas companies. Fujita (2015) mentioned Japan’s high exchange rate and its focus on energy efficiency as additional causes.
Regarding business strategies for addressing this, one major point of academic discussion is the acquisition of shares and the timing of acquisitions (Abo et al., 2008). Abo et al. (2008) recommend that Japanese oil and gas companies acquire interests in assets at a later stage of the project life cycle and enhance the recovery ratio of hydrocarbons by using their competitive advantage in different technologies, which has always been a strength of Japanese manufacturers.
their accounting books in US dollars even if that is not the local currency.
Hayashi (2006) summarized the speeches of Peter Jackson and David Hobbs, two scholars from Cambridge Energy Research Associates, Inc. (CERA), who recommended that Japanese oil and gas companies acquire more shares at the initial stage of a new upstream project, rather than acquiring fewer shares initially and increasing their shareholding later. Jackson and Hobbs (2006) gave their recommendation based on an analysis of top performers in other countries in terms of (1) portfolio focus and depth, (2) capital discipline, (3) acquisition strategies, and (4) long-term vision. In addition to their proposals on acquisition size and timing, they also recommended that Japanese oil and gas companies assume operatorship and acquire strategic alliances with large independent oil and gas companies.
6.1 Research questions: Japanese upstream oil and gas companies
Petroleum Intelligence Weekly (PIW) is an energy-related information service that ranks the top 50 oil and gas companies. The PIW top 50 ranking is published by Energy Intelligence, a publishing company, and is a common tool for measuring energy companies’ performance used by scholars and practitioners in the oil and gas industry. PIW generates its own measurements and ranks oil and gas companies by oil and gas production and reserves, sales of refined products, and refining capacity (Energy Intelligence, 2013). Some scholars have used this ranking in their studies (Victor, 2007; Pirog, 2007; Wolf, 2009; Kikkawa, 2010, 2012; Mitchell et al., 2012). Those scholars use the PIW ranking as a firm performance indicator. The five years between 2012 and 201622 were chosen for two reasons: (1) data accessibility (PIW does not publicly disclose its rankings every year) and (2) the 2014 decline in oil prices from over US$100 per barrel to less than US$50. The business environment changed drastically after the oil price collapse in 2014.
I found no Japanese companies among the top 20 or 30 oil and gas companies in the PIW top 50 between 2012 and 2016. Inpex, a Japanese upstream oil and gas company, was ranked 50th in 2015 and 43rd in 2016 (PIW 2015, 2016). Japanese oil and gas companies such as refinery companies have a strong influence on the demand side of oil and gas. Japan was the world’s 4th-largest oil consumer in 2015 (BP 2016) and the largest importer of LNG (International Gas Union 2019, p. 17). It also depends heavily on oil and gas imports from the Middle East (Motomura, 2014).
22Energy Intelligence (2013), PIW Ranks the World’s Top 50 Oil Companies. Available online at: http://www2.ener gyintel.com/PIW_Top_50_ranking_about (accessed on May 31, 2017).
Energy Intelligence (2014), PIW Top 50 ranking 2014. Available online at: http://www2.energyintel.com/l/19202/20 14-11-18/gp3qp (accessed on January 16, 2017).
Energy Intelligence (2016), PIW Top 50 Ranking. Available online at: http://www2.energyintel.com/l/19202/2016-12 -01/bfx33f (accessed on June 12, 2019).
23
Japanese and US scholars advocate different strategies for Japanese upstream oil and gas companies. In 2006, Jackson and Hobbs (2006) of CERA recommended that Japanese oil and gas companies acquire exploration projects with as large a participation ratio as possible directly from export-oriented NOCs or from underperforming companies. By contrast, Abo et al. (2008) contested CERA’s recommendations and argued that CERA’s strategies were poorly suited to the Japanese context. Abo et al. (2008) recommended acquiring upstream oil and gas projects in the later stages of production. CERA recommended obtaining a larger share in the initial stages of upstream oil and gas projects (which are highly speculative), while Japanese scholars (Abo et al., 2008) recommended acquiring a larger share at a later stage and enhanced recovery (which may be a safer, steadier growth path). These lead to the following research questions:
Research question (1): What can the Japanese government do to create a homegrown, internationally competitive upstream oil and gas company?
Research question (2): Which of the two strategies should Japanese oil and gas upstream companies pursue, and why?
Unlike the questions on functional currencies and impairment losses, these research questions are rooted in the core value of firm growth that Penrose (1959) discussed. However, financial firm growth is impossible without good strategies for firm growth; therefore, these are relevant research questions given the concept of financial growth used in this study.
To answer these questions, I analyzed the financial statements of the top-ranked international energy companies according to the PIW top 50 between 2012 and 2016 (PIW 2013, 2014, 2016). I also conducted four interviews with industry experts—two Japanese, one American, and one Russian.
Figure 2-3. Analytical framework
Source: Generated by the author.
Both “functional currency” and “impairment losses” are accounting terminologies;
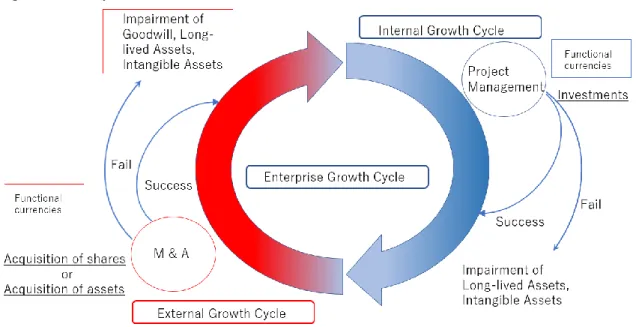
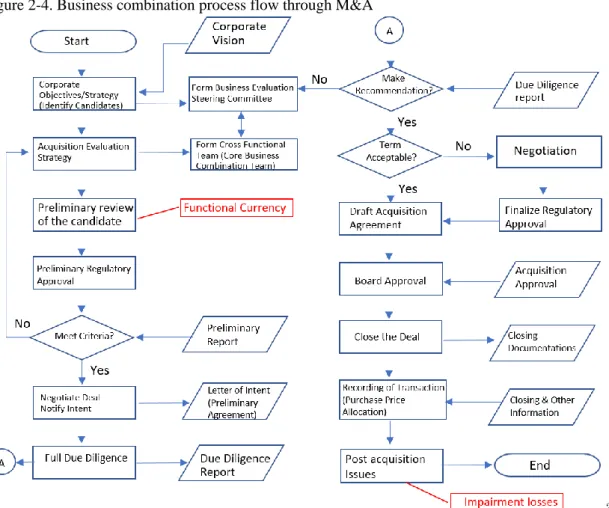
however, they should be built into the M&A process. Figure 2-3 shows the analytical framework used in this study. M&A, including asset acquisitions and share acquisitions, are external actions designed to expand the business. Project management is another force used to expand the business, albeit an internal one. Goodwill is generated by M&A but not by project management. Goodwill is recognized only in a business combination (EY 2018b, p. 23). Figure 2-4 presents the process flow of the corporate approvals required to execute M&A transactions (Sharifi et al., 2005, p. 13). The two red boxes detail where considerations of functional currencies and impairment losses come in. The two left-hand columns show the process to establish a target company or target assets for an M&A deal. The two right-hand columns show the process to obtain corporate approval for completing M&A transactions. As Figure 2-4 shows, functional currencies and impairment losses are integral M&A components for selecting the target company or assets and post-merger integration.
25
Figure 2-4. Business combination process flow through M&A
23
Source: Sharifi, M., Karen, V., and Khan, Z. (2005), p. 13 (except the 2 red boxes, which are written by the author).
7. Categorization of top performers
Table 2-2 depicts the top 50 companies as ranked by PIW and categorized by country of domicile. I divided the 50 companies into four groups: major oil companies, national oil companies (NOCs; export-oriented, government-owned), national flag oil companies (NFOCs;
import-oriented companies representing a nation), and independent oil companies. Here, ExxonMobil, Shell, BP, and Chevron are the major oil companies. NOCs are companies in which the majority of shares are held by their respective national governments and the surplus energy balance is exported. NFOCs are energy companies that are from net energy-import countries and are under government influence to facilitate the nation’s energy policy. NFOCs are considered the country’s representative in the global energy market (Kikkawa, 2015).
France’s Total S.A. (Total) is considered a major oil company; however, it is intentionally categorized as a national flag oil company because, until the early 1990s, the French
23The full-scope due diligence report would usually include a geo-scientific subsurface reserve report; risk analysis of surface facilities; business, legal, accounting, tax, finance, structure, and economic valuations of the target company and assets; and an environmental risk review.
government owned more than 30% of its shares. This study applies the definition of NFOCs. A separate category was created for the remainder of the companies: independent oil and gas companies.
The PIW ranking between 2012 and 2016 is stable, and the classification can be kept when organized across the four categories. The classification shows where Japan’s national flag oil company should be placed (chapter 3), how multinational oil companies would choose their functional currencies (chapter 4), as well as impairment losses (chapter 5) by category. It is important to clarify how different these four categories are for the studies in the following chapters.