Study on the Impact of a Free Trade Agreement between Mongolia and the Eurasian Economic Union*
Nomintsetseg Ulzii-Ochir**
Enkhbold Vorshilov***
Abstract
This study aims to undertake a detailed quantitative analysis on the formation of a free trade agreement between Mongolia and the Eurasian Economic Union (EAEU). Mongolia has recently concluded an economic partnership agreement with Japan; however, the country further seeks to align with integration in other regions in order to accelerate its economic and social development. Therefore, this research work concentrates on the next possible regional integration, namely with the EAEU.
In doing so, we utilize the Computable General Equilibrium (CGE) model and the latest GTAP database, 9.0, provided by Purdue University. Assuming a hypothetical scenario of full liberalization, the macroeconomic and trade effects were investigated.
Keywords: trade agreement, Eurasian Economic Union, CGE analysis, GTAP database JEL classification codes: F13, F14, F17
1. Objective of the Study
This study analyzes the impacts of a free trade agreement on Mongolia and the EAEU members. The study used the Global Trade Analysis Project (GTAP) database for this purpose.
The GTAP model is a comparative, static multiregional computable general equilibrium (CGE) model that uses a common global database. This is an analytical tool used to understand the dynamics of major economic variables in a simulated environment. Utilizing the GTAP database (the latest version, 9.0), a number of simulations were carried out in this study, involving the scenario of the full liberalization of tariffs, being completely eliminated, on all products traded between Mongolia and the EAEU members.
The results of the simulations were then used to assess the impact of liberalization on Mongolia and the EAEU members, as well as on certain other countries. This study tries to shed light on the possibilities for the welfare and macroeconomic implications, which will aid policymakers in assessing the actual situation in quantitative terms.
According to an ADB study, it is necessary to conduct economic evaluations and studies
of FTAs both before negotiation and after implementation. A clear and accurate understanding
of the potential effects of an FTA before its negotiation (an ex-ante evaluation) is necessary in
deciding the overall negotiation position of a country, based on an overall cost–benefit analysis
and the identification of what the country can and cannot provide to its FTA partners in the
negotiations. Pre-negotiation studies are also helpful to exploit the potential export benefits of
FTAs and to draw up necessary adjustment policies for sectors which may be negatively affected
by FTAs. The results of pre-negotiation impact assessment studies should be reflected effectively
in the FTA negotiations.
2. Literature Review
There have been several studies conducted on the possibilities of free trade agreements between Mongolia and other countries. During the past few years, negotiations between Mongolia and other trading partner countries have created considerable interest among Mongolian and foreign researchers.
For example, Sh. Enkhbayar and Tomoyoshi Nakajima (2013) studied the impact of Mongolian FTAs with the countries in Northeast Asia, using the GTAP database. They found that Mongolia’s bilateral FTAs with four Northeast Asian countries would be almost negligible as Mongolia’s import tariff rates are already relatively low and the partners impose zero tariffs on Mongolia’s major export commodities (mining and livestock origin products).
There have been some other studies which assessed the possibility for Mongolia concluding a trade agreement with Japan. In 2010 and 2012, N. Batnasan and N. Otgonsaikhan examined the impact of the proposed EPA between Mongolia and Japan. The studies were both qualitative and quantitative, using CGE analysis. Additionally, N. Batnasan, N. Otgonsaikhan, D. Narandalai, and Ts. Oyunbileg used a CGE model to evaluate the risks and possible paths for concluding trade agreements with Mongolia’s five major trading partner countries, namely Japan, Russia, China, the United States and Canada. They suggested that Mongolia’s domestic consumption and production will accelerate in the case of liberalizing trade with any of these five countries.
However, Mongolia’s GDP will not increase significantly, with less than 1% growth.
Similarly, using a CGE model, a team comprised of members from the Mongolian Academy of Sciences and the Business School of the National University of Mongolia (2014) examined the potential impacts and risks of bilateral trade agreements between Mongolia and its two neighbors, Russia and China. The study suggested that there will not be big impacts on Mongolia’s economy in the short run. However, in the medium to long-term, the proposed agreements might lead to significant increases in the extraction industry. As a consequence, it would bring on the “Dutch Disease” due to the increased exports of the extraction sector.
It is important to emphasize that there is a lack of quantitative studies with regard to trade agreements with the Eurasian Economic Union. Therefore, the objective of this study is to fill this gap and support assessments on the possible economic impacts and risks for Mongolia, utilizing a general equilibrium methodology.
3. Methodology
The actual assessment of the potential and actual impacts of an FTA is performed mainly
using economic data and methods. To analyze the economy-wide impact of trade liberalization,
a CGE model of global trade is employed for the model simulations. A CGE model numerically
simulates the general equilibrium structure of the economy. It is built on the Walrasian general
equilibrium system, in which the central idea is that market demand equals supply for all
commodities at a set of relative prices. Moreover, a CGE model has solid micro-foundations
that are theoretically transparent. Functional forms are specified in an explicit manner, and
interdependencies and feedback are incorporated. Therefore, the model provides a framework for
assessing the effects of policy and structural changes on resource allocation by clarifying “who
gains and who loses”.
1By studying the simulated changes caused by the FTA, this method is able to answer questions, such as: how does real gross domestic product change in a country that joins an FTA?;
how does the country’s trade balance change?; how do the country’s terms of trade change?; how do import and export prices in a particular sector change?; how do output and trade in different sectors within the country change?, and; how does the country’s welfare change?
The main advantage of the CGE method is that, given the FTA-related policy changes in various markets, the analysis can quantitatively capture the effects of these changes on all markets, rather than just one market.
The present study used the GTAP database version 9.0 which contains a total of 140 countries and 57 sectors. Both the factors and product markets of each region in the GTAP model are assumed to be characterized by perfect competition. The reference year used for the database corresponds to the global economy in 2011.
4. Regional and Sectoral Aggregation
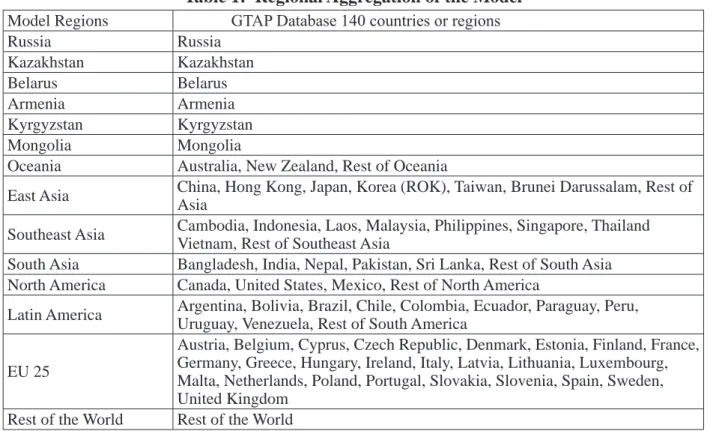
In this study, the 140 GTAP countries or regions were aggregated into 14 regions: Russia, Kazakhstan, Belarus, Armenia, Kyrgyzstan, Mongolia, Oceania, East Asia, Southeast Asia, South Asia, North America, Latin America, 25 EU members, and the rest of the world. However, our main focus is on the five EAEU member countries and Mongolia. The regional and sectoral aggregations of the model are illustrated in Tables 1 and 2.
Table 1: Regional Aggregation of the Model Model Regions GTAP Database 140 countries or regions
Russia Russia
Kazakhstan Kazakhstan
Belarus Belarus
Armenia Armenia
Kyrgyzstan Kyrgyzstan
Mongolia Mongolia
Oceania Australia, New Zealand, Rest of Oceania
East Asia China, Hong Kong, Japan, Korea (ROK), Taiwan, Brunei Darussalam, Rest of Asia
Southeast Asia Cambodia, Indonesia, Laos, Malaysia, Philippines, Singapore, Thailand Vietnam, Rest of Southeast Asia
South Asia Bangladesh, India, Nepal, Pakistan, Sri Lanka, Rest of South Asia North America Canada, United States, Mexico, Rest of North America
Latin America Argentina, Bolivia, Brazil, Chile, Colombia, Ecuador, Paraguay, Peru, Uruguay, Venezuela, Rest of South America
EU 25
Austria, Belgium, Cyprus, Czech Republic, Denmark, Estonia, Finland, France, Germany, Greece, Hungary, Ireland, Italy, Latvia, Lithuania, Luxembourg, Malta, Netherlands, Poland, Portugal, Slovakia, Slovenia, Spain, Sweden, United Kingdom
Rest of the World Rest of the World
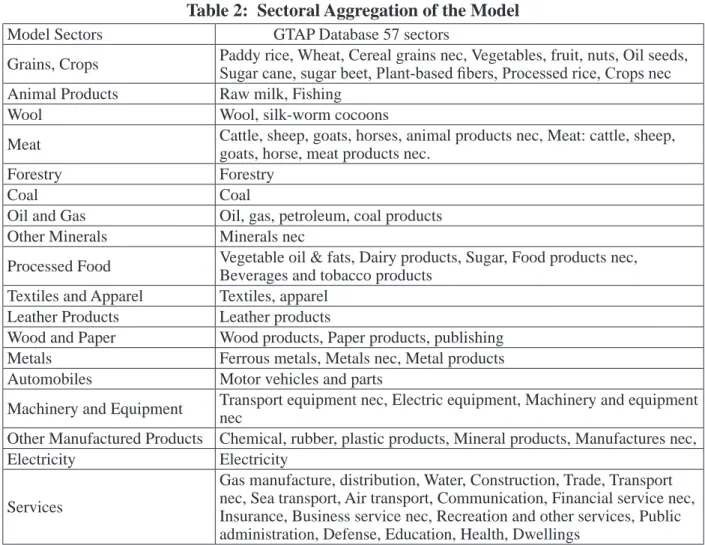
Table 2: Sectoral Aggregation of the Model
Model Sectors GTAP Database 57 sectors
Grains, Crops Paddy rice, Wheat, Cereal grains nec, Vegetables, fruit, nuts, Oil seeds, Sugar cane, sugar beet, Plant-based fibers, Processed rice, Crops nec Animal Products Raw milk, Fishing
Wool Wool, silk-worm cocoons
Meat Cattle, sheep, goats, horses, animal products nec, Meat: cattle, sheep, goats, horse, meat products nec.
Forestry Forestry
Coal Coal
Oil and Gas Oil, gas, petroleum, coal products Other Minerals Minerals nec
Processed Food Vegetable oil & fats, Dairy products, Sugar, Food products nec, Beverages and tobacco products
Textiles and Apparel Textiles, apparel Leather Products Leather products
Wood and Paper Wood products, Paper products, publishing Metals Ferrous metals, Metals nec, Metal products Automobiles Motor vehicles and parts
Machinery and Equipment Transport equipment nec, Electric equipment, Machinery and equipment nec
Other Manufactured Products Chemical, rubber, plastic products, Mineral products, Manufactures nec,
Electricity Electricity
Services
Gas manufacture, distribution, Water, Construction, Trade, Transport nec, Sea transport, Air transport, Communication, Financial service nec, Insurance, Business service nec, Recreation and other services, Public administration, Defense, Education, Health, Dwellings
The composition of GDP of the regions is described in Table 3. Mongolia’s export and import shares each exceed 70% of GDP, which are the highest compared to other regions.
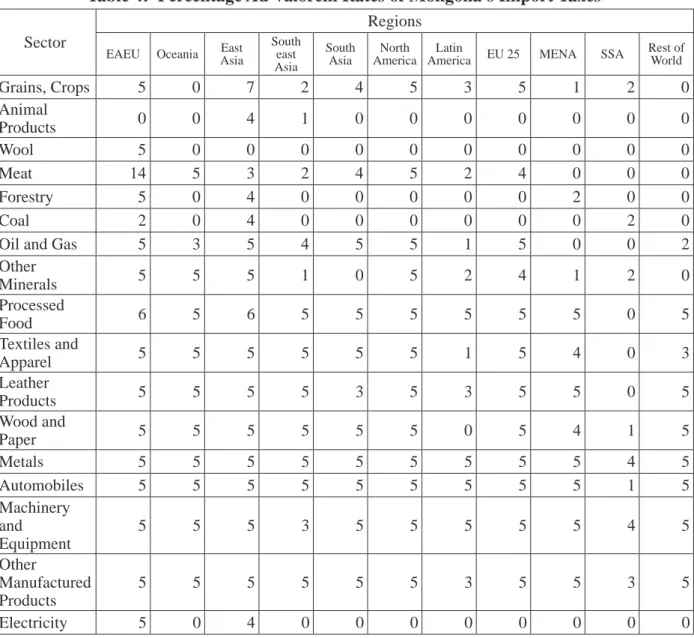
Meanwhile, Mongolia’s ad valorem import tariff rate is relatively low at 5%, as compared with other regions. However, most of those regions’ ad valorem import tariff rates are zero for raw materials, such as animal-origin products, meat, wool, and coal. It should be noted that the Eurasian Economic Union members impose a 4% import tariff, the lowest rate, on coal, grains and crops, and other manufactured products from Mongolia. On the other hand, the EAEU imposes higher ad valorem tariffs on Mongolian products, such as meat (21%) and processed food (19%) (Tables 4 and 5).
Table 3: Composition of GDP (%) Item
Regions
EAEU Mon golia
Ocea nia
East Asia
SE Asia
South Asia
N America
Latin
America EU 25 MENA SSA Rest of World
Private
Consumption 50.1 47.3 54.8 47.7 58.2 66.2 68.3 62.3 59.7 51.9 64.5 57.7 Investment 22.4 47.7 26 33.6 28.3 31.1 19.1 19.7 18.9 24.1 20.1 21.9 Government
Consumption 17.8 12.6 18.3 16 10.7 11.8 16.7 17.5 22.2 16.1 15.1 15.8
Exports 31 71 21.8 27 55.6 19.6 14.7 18.1 39.3 40.7 31.3 45.5
Imports -21.3 -78.6 -20.9 -24.3 -53 -28.7 -18.8 -17.6 -40.1 -32.8 -31 -41
Total 100 100 100 100 100 100 100 100 100 100 100 100
Notes: MENA = Middle East and North Africa; SSA = Sub-Saharan Africa Source: Compiled from GTAP Database 9.0
Table 4: Percentage Ad Valorem Rates of Mongolia’s Import Taxes Sector
Regions
EAEU Oceania East Asia
South east Asia
South Asia
North America
Latin
America EU 25 MENA SSA Rest of World
Grains, Crops 5 0 7 2 4 5 3 5 1 2 0
Animal
Products 0 0 4 1 0 0 0 0 0 0 0
Wool 5 0 0 0 0 0 0 0 0 0 0
Meat 14 5 3 2 4 5 2 4 0 0 0
Forestry 5 0 4 0 0 0 0 0 2 0 0
Coal 2 0 4 0 0 0 0 0 0 2 0
Oil and Gas 5 3 5 4 5 5 1 5 0 0 2
Other
Minerals 5 5 5 1 0 5 2 4 1 2 0
Processed
Food 6 5 6 5 5 5 5 5 5 0 5
Textiles and
Apparel 5 5 5 5 5 5 1 5 4 0 3
Leather
Products 5 5 5 5 3 5 3 5 5 0 5
Wood and
Paper 5 5 5 5 5 5 0 5 4 1 5
Metals 5 5 5 5 5 5 5 5 5 4 5
Automobiles 5 5 5 5 5 5 5 5 5 1 5
Machinery and Equipment
5 5 5 3 5 5 5 5 5 4 5
Other
Manufactured Products
5 5 5 5 5 5 3 5 5 3 5
Electricity 5 0 4 0 0 0 0 0 0 0 0
Source: Compiled from GTAP Database 9.0
Table 5: Percentage Ad Valorem Rates of Import Taxes of Other Regions vis-à-vis Mongolia
Sectors Regions
EAEU Oceania East
Asia SE Asia South Asia
North America
Latin
America EU 25 MENA SSA Rest of World
Grains, Crops 4 0 11 0 0 0 0 0 0 0 0
Animal
Products 0 0 0 4 0 0 0 0 0 0 0
Wool 5 0 9 0 5 0 0 0 0 0 0
Meat 21 0 13 0 0 0 0 0 4 21 26
Forestry 0 0 0 0 0 0 0 0 0 0 0
Coal 4 0 0 0 0 0 0 0 0 0 0
Oil and Gas 0 0 0 0 0 0 0 0 0 0 0
Other
Minerals 13 0 0 1 5 3 6 0 0 1 0
Processed
Food 19 4 12 2 8 0 0 0 39 2 1
Textiles and
Apparel 13 5 13 4 6 25 3 0 2 11 6
Leather
Products 16 2 9 0 0 24 0 0 1 2 0
Wood and
Paper 11 0 1 0 7 0 0 0 0 12 0
Metals 14 1 1 2 10 0 0 0 0 5 1
Automobiles 9 0 0 33 0 0 0 0 0 18 0
Machinery and Equipment
18 2 1 5 7 0 11 0 0 4 0
Other
Manufactured Products
4 2 6 0 13 0 1 0 0 1 2
Electricity 0 0 0 0 0 0 0 0 0 0 0
Source: Compiled from GTAP Database 9.0
5. Macroeconomic Effects
To assess the impact of an FTA, we assume full trade liberalization between Mongolia and the EAEU members. Under this scenario, all tariffs on imports from all the EAEU members to Mongolia were reduced to zero and, similarly, tariffs on all sectors imported by EAEU members from Mongolia were eliminated. In other words, we simulate a scenario of an FTA where tariffs on all products traded between Mongolia and the EAEU members are completely eliminated.
The implications of full liberalization on selected macroeconomic indicators for the regions
are presented in Table 6. The results indicated Mongolia would experience relatively positive
effects as a result of a free trade agreement with the EAEU. For example, Mongolia’s overall
welfare effect, which measures the effect on public welfare, increases by US$6.64 million. It
indicates that Mongolia’s consumers would benefit from price decreases due to tariff reductions
with the EAEU countries. Meanwhile, Mongolia’s GDP increases by 0.14% and household income rises by 0.18%. The GDP price index
2would also experience a 0.16% increase. On the other hand, there are almost no effects for the EAEU member countries. Among those countries, Russia and Belarus had slightly positive effects of 0.55% and 0.36% increases, respectively, in terms of total welfare. In terms of GDP change and household income, there were no effects for all the EAEU members.
The results for East Asia were very remarkable. Its welfare effect decreases by 8.3% when Mongolia enters into an FTA with the EAEU. As mentioned above, the East Asia aggregation consists of countries and regions such as China, Hong Kong, Japan and the ROK, which are Mongolia’s main trading partners. Mongolia’s alignment in an FTA with the EAEU members may lead to trade diversion effects away from the East Asian countries (Table 6).
To sum up, as far as concerns the selected macroeconomic variables of welfare (equivalent variation), GDP, and household income, Mongolia gains effectively if there is complete tariff elimination or tariff liberalization. Under the full tariff elimination (full liberalization), Russia and Belarus would benefit slightly in terms of welfare compared to the other three countries.
In a comparative static applied general equilibrium model, with population, endowment and technology being fixed, the only way to increase welfare is to reduce the excess burden arising from existing distortions.
3Mongolia is a country that consistently earns large positive welfare gains, mostly on account of terms of trade gains. This is due to the fact that even prior to an FTA the tariffs imposed by Mongolia for almost all products exported from the EAEU countries were very low (Table 7).
Table 6: Changes in Selected Macroeconomic Variables
Full Liberalization Scenario (All EAEU Members and Mongolia) Region/Country
Total Welfare Effect,
US$ Million
Change in GDP Price Index, %
Change in Value of GDP, %
Change in Household Income, %
1 Russia 0.5508 0.0006 0.0006 0.0006
2 Kazakhstan 0.1019 0.0003 0.0003 0.0003
3 Belarus 0.3632 0.0015 0.0016 0.0016
4 Armenia -0.0052 0 0 0
5 Kyrgyzstan 0.0075 0.0002 0.0002 0.0002
6 Mongolia 6.6357 0.1438 0.1619 0.1856
7 Oceania 1.4894 0.0003 0.0003 0.0003
8 East Asia -8.2891 -0.0002 -0.0002 -0.0002
9 Southeast Asia 0.3569 0 0 0
10 South Asia -0.6177 -0.0001 -0.0001 -0.0001
11 North America -0.7649 0 0 0
12 Latin America 0.4828 0 0 0
Source: Simulation results
Table 7: Total Welfare and Its Composition, US$ Million Region/Country Allocative
Efficiency Terms of Trade Investment-
Savings Effect Total
1 Russia -0.67 2.11 -0.89 0.55
2 Kazakhstan 0.03 0.13 -0.06 0.1
3 Belarus 0.07 0.18 0.12 0.36
4 Armenia 0 0 0 -0.01
5 Kyrgyzstan 0 0 0 0.01
6 Mongolia 1.58 4.53 0.52 6.64
7 Oceania 0.16 1.34 -0.01 1.49
8 East Asia -1.51 -7.61 0.82 -8.29
9 Southeast Asia 0.01 0.29 0.06 0.36
10 South Asia -0.01 -0.45 -0.16 -0.62
11 North America -0.01 -0.21 -0.54 -0.76
12 Latin America 0.02 0.44 0.03 0.48
13 EU 25 -0.37 -2.61 -0.05 -3.03
14 MENA 0.06 1.35 0.09 1.5
15 SSA 0.06 0.51 0.01 0.59
16 Rest of World -0.01 0 0.06 0.05
Source: Simulation results
6. Trade Effects
Under full liberalization, in Mongolia the volume of exports decreases by 0.15% and the volume of imports increases by 0.18%. Nevertheless, there is almost no change in exports and imports for the EAEU members. It is obvious that the EAEU members’ economic and trade potential is huge compared with Mongolia. Therefore, changes cannot be seen as a result of liberalization with Mongolia. When Mongolia and the EAEU implement a trade agreement, the highest decrease in trade balance is reported by Mongolia, which shows a decline of US$18.1 million. As for Russia and Belarus, their trade balance decreases somewhat by 1.16% and 0.17%, respectively. The terms of trade
4(ToT) do not show any change for all of the countries.
Table 8: Change in Trade Variables, Full Liberalization (All EAEU Members and Mongolia)
Region/Country Change in Volume of Exports, %
Change in Volume of Imports, %
Change in Trade Balance (US$ million)
Change in Terms of Trade, %
1. Russia 0.0005 0.0016 -1.16 0.0004
2. Kazakhstan 0.0001 0.0005 0.0279 0.0002
3. Belarus -0.0001 0.0008 -0.1733 0.0006
4. Armenia 0.0002 -0.0001 0.0051 -0.0001
5. Kyrgyzstan 0.0001 0.0002 -0.0154 0.0001
6. Mongolia -0.1564 0.1883 -18.1661 0.073
7. Oceania -0.0002 0.0003 -0.3009 0.0004
8. East Asia 0.0002 -0.0002 8.6803 -0.0002
9. Southeast Asia 0 0 0.5776 0
10. South Asia 0.0002 0 0.6273 -0.0001
11. North America 0.0001 0 3.4575 0
12. Latin America 0 0 0.5227 0.0001
13. EU 25 0.0001 0 4.6563 0
14. MENA 0 0 0.7837 0.0001
15. SSA 0 0.0001 0.1333 0.0001
16. Rest of World 0 0 0.344 0
Source: Simulation results
Looking at the change in trade balance for 18 sectors, almost all sectors have a deficit in the trade balance, with the exception of the meat sector and other minerals sector. The EAEU members’ trade balance practically does not change, as can be seen in the table. In particular, countries such as Armenia, Belarus and Kyrgyzstan get no effect in their trade balances when Mongolia enters an FTA with the union. There is a positive trade balance effect only in the meat sector (0.9%) and the mineral products sector (1%) for Mongolia.
Terms of trade is defined by the ratio of export and import price indices, which is shown in the following table. From the theoretical standpoint, the terms of trade contribute positively to society if post-simulation export prices rise more than import prices. As we expected, the Mongolian post-simulation export price index for selected sectors can be seen as positive, greater than the import price index. There is almost no change in the import price index for Mongolia and the EAEU members.
The proposed trade agreement increases Mongolia’s export prices more than it does import prices, resulting in positive trade effects.
In order to assess the effects of the trade agreement on the Mongolian economy, one should look at the simulation results by aggregated sectors. The percentage changes in the value-added sectors by selected regions are provided in the following table. The result reveals that most of the value-added industries have negligible and negative effects. The only positive value-added industry was meat products exported by Mongolia to EAEU members. At the same time, in five countries there is no such effect on value added for all 18 sectors. There is evidence that the value added for the meat sector shows high growth (3.9%) in the study by Sh. Enkhbayar and T. Nakajima (2013). They pointed out that the meat, leather, and textile and apparel sectors are competitive export sectors with the mining industry and could generate significant export earnings.
Furthermore, we planned to see the results for demand for endowments in selected sectors
in Mongolia. As shown in Table 13, the change in demand for endowment for meat products is
more positive than for the other 17 sectors. However, change is very low, at 0.3% for both the
skilled and unskilled labor force. In addition to this, demand for endowment in the service sector
has a slight positive effect post-simulation.
T able 9: Changes in T rade Balance by Sector , US$ Million Sector Russia Kazakhstan Belarus Armenia Kyr gyzstan Mongolia Oceania East Asia Southeast Asia South Asia Grains, Crops -0.1898 -0.0084 -0.0128 0.0007 -0.0019 -0.202 -0.0981 0.2156 0.032 0.0688 Animal Products -0.0144 0 -0.0007 0.0001 0 -0.0032 -0.0042 0.018 -0.0018 0.0002 W ool 0.0028 0.0045 -0.0001 0.0001 0.0031 -1.597 0.6409 0.5707 0.002 0.0276 Meat -0.6275 -0.0436 -0.013 0.0001 -0.0039 0.9131 -0.1926 0.1783 0.0173 0.0256 Forestry -0.0277 -0.0001 -0.0048 0 0 -0.0026 -0.0098 0.0257 0.003 0.0047 Coal 0.2066 0.0182 0.0001 0 -0.0004 -1.9538 0.9102 -0.1417 0.6932 -0.1626 Oil and Gas -1.5625 0.0726 0.0473 -0.0014 -0.0046 -0.5392 -0.0552 -1.587 0.1 148 -0.0084 Other Minerals -0.4385 -0.1 152 -0.0003 -0.0015 -0.0008 1.0947 0.9406 -1.6182 0.1712 0.1289 Processed Food 0.8729 0.12 -0.0305 0.0027 0.0047 -0.7414 -0.2475 0.0369 -0.0443 0.0442 T extiles and Apparel -0.1438 -0.0135 -0.0484 0 -0.0014 -0.7555 -0.0661 1.241 1 -0.0374 0.0902 Leather Products -0.0346 -0.0015 -0.0016 0 -0.0003 -0.341 -0.0127 0.3946 -0.0073 0.0139 W ood and Paper -0.2779 0.0901 -0.0246 0.0001 -0.0012 -0.2968 -0.1096 0.4851 -0.0159 0.01 12 Metals 0.7757 -0.0531 -0.1053 0.002 -0.0054 -1.999 -0.4653 -1.0395 0.1486 0.0752 Automobiles -0.097 -0.0036 0.5055 0.0001 0.0013 -1.3788 -0.1043 1.0738 -0.007 0.0088 Machinery and Equipment 2.0964 -0.0276 -0.1407 0.0003 0.0015 -5.846 -0.5665 5.3327 -0.4034 0.0203 Other Manufactured Products 0.0096 0.0878 -0.21 13 -0.0002 0 -0.4532 -0.3257 0.8843 -0.193 0.0528 Electricity 0.0883 -0.0019 -0.0333 0.0003 -0.0002 -0.1 14 -0.0038 -0.0138 -0.0031 -0.0009 Services -1.7985 -0.0965 -0.0988 0.0015 -0.0058 -3.9505 -0.5312 2.6237 0.1088 0.2268 T otal -1.16 0.0279 -0.1733 0.0051 -0.0154 -18.1661 -0.3009 8.6803 0.5776 0.6273 Source: Simulation results
T able 10: Changes in the Export Price Index for Goods in Selected Countries, % Sector Russia Kazakhstan Belarus Armenia Kyr gyzstan Mongolia Grains, Crops 0.0005 0.0002 0.001 0 0.0003 0.1497 Animal Products 0.0005 0.0004 0.0007 0.0001 0.0006 0.2876 W ool 0.0004 0.0002 0.0009 0 0.0005 0.134 Meat 0.0005 0.0002 0.001 0 0.0003 0.3398 Forestry 0.0004 0.0006 0.001 0 0.0002 0.164 Coal 0.0012 0.0005 0.0009 0.0007 0.0004 0.0185 Oil and Gas 0.0004 0.0002 0.0004 0 0.0003 0.002 Other Minerals -0.0003 -0.0002 0.0009 -0.0002 -0.0008 0.1225 Processed Food 0.0006 0.0003 0.001 0 0.0003 0.1 161 T extiles and Apparel 0.0005 0.0001 0.0009 0 0 0.0783 Leather Products 0.0006 0 0.001 0 0 0.21 16 W ood and Paper 0.0006 0.0003 0.001 0 0.0002 0.0843 Metals 0.0002 0.0001 0.0008 0 0.0001 0.0785 Automobiles 0.0004 0.0002 0.001 0 0.0001 0.0584 Machinery and Equipment 0.0005 0.0003 0.001 1 0 0.0002 0.0573 Other Manufactured Products 0.0004 0.0002 0.0008 0.0001 0 0.052 Electricity 0.0005 0.0003 0.0008 0.0001 0.0002 0.1 143 Services 0.0007 0.0003 0.0013 0 0.0002 0.1387 Source: Simulation results
Table 11: Changes in the Import Price Index for Goods in Selected Countries, % Sector Russia Kazakhstan Belarus Armenia Kyrgyzstan Mongolia
Grains, Crops 0 0 0 0.0003 0.0001 0.0001
Animal Products 0 0.0001 0 0 0 0
Wool 0.0037 0.0016 0.0004 0.0023 0.0008 0.0004
Meat 0.001 0.001 0 0 0.0005 0.0002
Forestry 0 0 0 0.0001 0.0003 0.0001
Coal 0.0007 0.001 0.0007 0.0008 0.0005 0.001
Oil and Gas 0.0002 0.0002 0.0003 0.0002 0.0003 0.0003
Other Minerals 0.006 -0.0002 -0.0001 -0.0001 0.0015 0
Processed Food 0 0.0001 0 0.0002 0.0004 0.0002
Textiles and Apparel 0 0 0 0 -0.0001 -0.0001
Leather Products -0.0001 -0.0001 0.0001 0 -0.0001 0
Wood and Paper 0 0.0001 0.0001 0.0001 0.0002 0
Metals 0 0.0001 0.0001 0.0001 0.0001 0.0001
Automobiles 0 0 0 0.0001 0 0
Machinery and
Equipment 0 0 0 0 0 0
Other Manufactured
Products 0 0 0 0.0001 0.0001 0.0001
Electricity 0.0001 0.0002 0.0001 0.0001 0.0001 0.0005
Services 0 0 0 0 0 0
Source: Simulation results
T able 12: Change in V alue-Added Industry of Selected Regions, % Sector Russia Kazakhstan Belarus Armenia Kyr gyzstan Mongolia Oceania East Asia Southeast Asia South Asia Grains, Crops -0.0002 -0.0001 -0.0005 0.0001 0 -0.1367 -0.0003 0.0001 0 0 Animal Products -0.0001 0.0002 -0.0003 0.0001 0.0014 -0.1352 -0.0002 0 0 0 W ool 0.0003 0.0006 -0.0009 0.0002 0.0035 -0.6321 0.0146 0.0045 0.0007 0.0005 Meat -0.0009 -0.0004 -0.0002 0 -0.0004 0.2631 -0.0007 0 0 0 Forestry -0.0006 0.0008 -0.0014 0 0 -0.0086 -0.0002 0.0001 0 0 Coal 0.0003 0.0001 -0.0002 0.0001 0.0001 -0.0798 0.0006 0.0006 0.0008 0.0005 Oil and Gas -0.0003 -0.0001 -0.0004 0.0009 0.0001 -0.1352 -0.0001 -0.0002 0.0001 0.0001 Other Minerals -0.0016 -0.001 1 -0.0004 -0.0003 -0.0008 -0.0642 0.0004 0.0004 0.0004 0.0004 Processed Food 0.0009 0.0007 -0.0002 0.0001 0.0018 -0.3225 -0.0003 0 0 0 T extiles and Apparel -0.001 -0.0007 -0.0029 -0.0001 -0.0001 -0.2442 -0.0006 0.0002 -0.0001 0.0001 Leather Products -0.0009 0.0001 -0.0013 0 0.0002 -1.515 -0.0014 0.0003 0 0 W ood and Paper -0.0007 0.0026 -0.0017 0.0001 0.0001 -0.1451 -0.0002 0.0001 0 0 Metals 0.001 1 -0.0003 -0.0039 0.0004 -0.0004 -0.5186 -0.0008 0 0.0001 0 Automobiles 0.0003 -0.0002 0.0144 -0.0001 0.0027 -0.0974 -0.0004 0.0001 -0.0001 -0.0001 Machinery and Equipment 0.0024 -0.0002 -0.0016 -0.0002 0.0009 0.0004 -0.0008 0.0001 -0.0002 -0.0001 Other Manufactured Products 0 0.0009 -0.0036 0 0.0004 -0.2024 -0.0004 0.0001 -0.0001 0 Electricity 0.0002 -0.0001 -0.0006 0 0.0001 -0.0084 -0.0002 -0.0001 0 0 Source: Simulation results
Table 13: Change in Demand for Endowment for Selected Sectors (Mongolia), %
Endowment Land Unskilled
Labor Skilled Labor Capital
Grains, Crops -0.1334 -0.1412 -0.1413 -0.1221
Animal Products -0.133 -0.139 -0.1391 -0.1238
Wool -0.5511 -0.6681 -0.6682 -0.6508
Meat 0.1484 0.2986 0.2983 0.3374
Forestry -0.0349 -0.0205 -0.0206 -0.0074
Coal -0.1419 -0.1489 -0.149 -0.1358
Oil and Gas -0.2117 -0.2432 -0.2433 -0.2235
Other Minerals -0.0884 -0.0847 -0.0848 -0.0715
Processed Food -0.2337 -0.3756 -0.3761 -0.3021
Textiles and Apparel -0.1963 -0.3089 -0.3095 -0.2262
Leather Products -0.7378 -1.5272 -1.5279 -1.4456
Wood and Paper -0.1502 -0.2048 -0.2055 -0.1221
Metals -0.3202 -0.5884 -0.5891 -0.506
Automobile -0.1367 -0.1744 -0.1751 -0.0917
Machinery and Equipment -0.0959 -0.0821 -0.0828 0.0007
Other Manufactured Products -0.1794 -0.2707 -0.2714 -0.188
Electricity -0.0793 -0.0447 -0.0454 0.0382
Services -0.0555 0.0147 0.014 0.1047
Source: Simulation results
7. Conclusion
The present study provides an analysis of and insight into the impact of a Mongolia–EAEU free trade agreement on the macroeconomic variables and trade variables of Mongolia and the EAEU member economies. Utilizing the latest version (9.0) of the GTAP database, 14 main regions and 18 potential sectors were aggregated in this study. Under the hypothetical scenario of full liberalization, we simulated the impact of a free trade agreement between Mongolia and the EAEU and obtained the following results.
First of all, Mongolia’s welfare gain appears to be positive due to both positive allocative efficiency and positive terms of trade. Meanwhile EAEU members’ welfare gain does not seem to have any noticeable changes. In addition to this, the real GDP growth of Mongolia slightly increased, less than 1%, when there is a trade agreement. Therefore, Mongolia’s benefit from a free trade agreement with the EAEU seems to have a relatively smaller effect on the economy.
Similarly, EAEU members’ GDP growth saw almost no change post-simulation.
Second, Mongolia’s trade effect under full liberalization appears to have a negative or
decreased export volume and a positive or increased import volume. Moreover, Mongolia’s trade
balance has a deficit, amounting to US$18 million. The deficit is mainly due to raw products. The
meat sector alone has a positive effect among all the 18 sectors in terms of the volume of exports,
value-added industry and the change in demand for endowments. On the other hand, the EAEU
members have no greater effect in terms of trade indicators.
In general, this ex-ante study reveals that Mongolia receives better results than the EAEU regarding the total welfare effect and GDP growth. Mongolia’s benefit lies in its attempts to link export-oriented value-added products. Through this approach, Mongolia can accelerate its value- added exports to the EAEU and neutralize the negative effect of export volumes.
It should be noted that this study estimates only the quantitative aspects based on the GTAP database. Furthermore, it is necessary to include non-tariff barriers to trade, and sanitary and phytosanitary measures in order to have a more comprehensive conclusion.
* This study was partially supported by 2015-2016 Research Grant from the National University of Mongolia for faculty promotion.
** Senior Lecturer, Department of Commerce, Business School, National University of Mongolia
*** Director General, Department of Foreign Trade and Economic Cooperation, Ministry of Foreign Affairs of Mongolia
1
Kawasaki, 2003
2
The GDP deflator that measures the price levels of final goods and services produced in an economy during a particular period.
3
C. Sikdar (2011): “Impact of India–ASEAN Free Trade Agreement: A cross country analysis using applied general equilibrium modelling”
4