Multi-criteria Analysis As A Decision-Making Method In Disaster Management - A Case Study for Designation of Appropriate Public Facility Buildings as Evacuation Relief Centre in High-Risk Flooded Area, Town of Kota Tinggi, State of Johor, Malaysia - [ PDF
4
0
0
全文
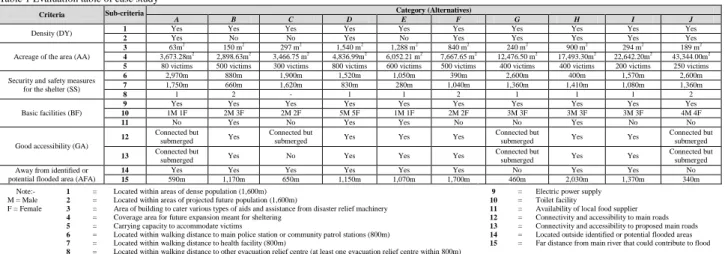
(2) Table 1 Evaluation table of case study Sub-criteria. Criteria Density (DY) Acreage of the area (AA) Security and safety measures for the shelter (SS) Basic facilities (BF). 1 2 3 4 5 6 7 8 9 10 11 12. Good accessibility (GA) 13 Away from identified or potential flooded area (AFA) Note:M = Male F = Female. 1 2 3 4 5 6 7 8. = = = = = = = =. 14 15. A Yes Yes 63m2 3,673.28m2 80 victims 2,970m 1,750m 1 Yes 1M 1F No Connected but submerged Connected but submerged Yes 590m. B Yes No 150 m2 2,898.63m2 500 victims 880m 660m 2 Yes 2M 3F Yes. Category (Alternatives) E F Yes Yes No Yes 1,288 m2 840 m2 6,052.21 m2 7,667.65 m2 600 victims 500 victims 1,050m 390m 280m 1,040m 1 2 Yes Yes 1M 1F 2M 2F Yes No. C Yes No 297 m2 3,466.75 m2 300 victims 1,900m 1,620m Yes 2M 2F No Connected but submerged. D Yes Yes 1,540 m2 4,836.99m2 800 victims 1,520m 830m 1 Yes 5M 5F Yes Yes. Yes. Yes. Yes. No. Yes. Yes. Yes. Yes 1,170m. Yes 650m. Yes 1,150m. Yes 1,070m. Yes 1,700m. Yes. G Yes Yes 240 m2 12,476.50 m2 400 victims 2,600m 1,360m 1 Yes 3M 3F No Connected but submerged Connected but submerged No 460m. Located within areas of dense population (1,600m) Located within areas of projected future population (1,600m) Area of building to cater various types of aids and assistance from disaster relief machinery Coverage area for future expansion meant for sheltering Carrying capacity to accommodate victims Located within walking distance to main police station or community patrol stations (800m) Located within walking distance to health facility (800m) Located within walking distance to other evacuation relief centre (at least one evacuation relief centre within 800m). = = = = = = =. 9 10 11 12 13 14 15. H Yes Yes 900 m2 17,493.30m2 400 victims 400m 1,410m 1 Yes 3M 3F Yes. I Yes Yes 294 m2 22,642.20m2 200 victims 1,570m 1,080m 1 Yes 3M 3F No. Yes. Yes. Yes. Yes. Yes 2,030m. Yes 1,370m. J Yes Yes 189 m2 43,344.00m2 250 victims 2,600m 1,360m 2 Yes 4M 4F No Connected but submerged Connected but submerged No 340m. Electric power supply Toilet facility Availability of local food supplier Connectivity and accessibility to main roads Connectivity and accessibility to proposed main roads Located outside identified or potential flooded areas Far distance from main river that could contribute to flood. the sensitivity of the results.. secondary data, the Problem Tree Analysis for the case study. 4.2 The significance of research Disaster management as a cycle activity, need to be supported. can be explained as shown in Fig. 4. Hence, core problem can be broken down into manageable and definable aspects.. by relevant methods and models since it dealing with various factors either structural or non-structural (Fig. 2). In relation to. Besides, it could assist the process of analysis, which often helps building a shared sense of understanding besides. that, the planning process of providing appropriate evacuation relief is one of the fields that need to be considered in the. supporting justifications and lead to the significant of this study to be conducted.. context of Malaysia besides to accommodate victims that are expected to increase in the near future. Therefore, it is essential. 6.. to understand the significance of these activities and its importance to human and social sustainability within disaster. The AHP, originally developed by Saaty (1980), is one of the most flexible methods that can be implemented with MCA. To. management environment.. solve a MCA problem by AHP and Expert Choice®, the following steps need to be taken into consideration :-. Note := A continuous process as in disaster management cycle = Inter-related. PRE-DISASTER STAGE Planning and improvement the existing plan, mitigation, measures etc.. a. Step 1 : Define the problem and determine its goal. Ten (10) public facility buildings, six (6) criteria and 15 sub-criteria have been identified for the purpose of this research (Fig. 5). b. Step 2 : Develop hierarchical framework as Model of. SHELTERING (EVACUATION RELIEF). POST DISASTER STAGE Displacement and assistance for those who need to stay longer. Analysis (Fig. 5). c. Step 3 : Construct pairwise comparison matrix (size nxn) for. DURING DISASTER STAGE Evacuation, displacement and assistance to victims. all levels of the hierarchy. d. Step 4 : Perform judgment of pairwise comparison using. Fig. 2 Sheltering from the context of Disaster Management Cycle. 5.. MCA AND ITS APPLICATION USING AHP AND EXPERT CHOICE®. STRUCTURE AND METHODLOGY OF MCA. Basically, this method is applied in a sequence of steps that is inter-connected before the final decision is obtained. General. Saaty's 1 to 9 scale (Table 2). There are n x (n-1) judgments required to develop a set of matrices and hierarchy (Table 3).. structure, elements and basic stages involved in applying MCA and its integration with planning DSS can be described as in. Table 2 Fundamental scale of pairwise comparison3) Intensity of importance 1 3 5 7 9 2,4,6,8. Fig. 3. Problem Tree Analysis is applied to assist analyzing the existing situation by identifying the major problems and their main causal relationships. Based on the available primary and Causes Weaknesses in integrating The absence of clear legal provisions Disaster Management related to the need of proper aspects in planning approval buildings for the purpose of disaster process Lack of emphasis in providing The absence of clear guidelines Lack of knowledge in emergency and evacuation in identifying buildings for the determining suitable location planning in the preparation of purpose as evacuation relief of public facility buildings for development plans centres disaster purpose. Explanation Equal importance Moderate importance one over another Essential or strong importance Very strong importance Extreme importance Intermediate values between the two adjacent judgments. Problem Tree Analysis. Problem identification. Formulation and determination of: • Goal and alternatives to be appraised • Objectives and criteria • Evaluation table. Problem Structuring. Decision-maker(s) Weaknesses in Providing Appropriate Evacuation Relief Centre. Less priority is given to the provision of sheltering for people during disaster in formulation of provisions, policies and guidelines development plans. Difficulties and delays occur in providing and delivering assistance such as food, medicine, daily necessities and so on to victims Could cause death and serious injury. Lack of concrete approach and mitigation measures to be enforced in identifying appropriate buildings as evacuation relief centres. Victims could be exposed to various social, health and psychological problems besides issues of overcrowding and spread of diseases. The government and victims need to bare additional cost for further treatment. Core Problem No provision of standard disaster evacuation centres. Instead only public facility buildings are identified based on limited criteria and their availability when the situation is urged Effects. Fig. 4 Problem Tree Analysis. Decision of solution. Fig. 3 General structure and elements of MCA To identify appropriate public facility buildings as designated evacuation relief centre in high risk flooded area, Town of Kota Tinggi, State of Johor DY 1. *. A. AA 3. 2 B. 4 C. BF. SS 6. 5 D. 7. 8. E. 9 F. 10. 11 G. 12 H. * An example of pairwise comparison. Goal. Criteria. AFA. GA. Fig. 5 Model of Analysis. 14-2. Integration with Planning DSS tools (GIS, AHP & Expert Choice®). Problem Analysis Sensitivity Analysis. 14. 13 I. 15 J. Subcriteria Alternatives.
(3) 7 shows the calculation summary for overall priority weights of. Table 3 Pairwise comparison matrix of criteria Criteria DY AA SS BF GA AFA Total. DY 1 1 2 4 5 8 21.000. AA 1 1 2 3 4 7 18.000. SS 1/2 1/2 1 2 3 4 11.000. BF 1/4 1/3 1/2 1 1 2 5.083. GA 1/5 1/4 1/3 1 1 2 4.783. AFA 1/8 1/7 1/4 1/2 1/2 1 2.518. Total 3.075 3.226 6.083 11.500 14.500 24.000 62.385. criteria, sub-criteria and alternatives using Expert Choice®. i. Step 9 : Priority of the alternatives. The overall priority weights can be obtained by multiplying the priority weights for each of the alternatives by the weights of priority of criteria as. e. Step 5 : Synthesizing the pairwise comparison to get the priority of the criteria and weights for Eigenvector (Table 4).. shown in Table 8. The judgment made can be considered consistent and acceptable since the CR is less than 0.1 or 10%.. Table 4 Synthesizing pairwise comparison of criteria. At this point, decision-maker(s) could get a better understanding of which building should be considered to serve. Criteria. DY. AA. SS. BF. GA. AFA. Total. DY AA SS BF GA AFA Total. 0.048 0.048 0.095 0.190 0.238 0.381 1.000. 0.056 0.056 0.111 0.167 0.222 0.389 1.000. 0.045 0.045 0.091 0.182 0.273 0.364 1.000. 0.049 0.066 0.098 0.197 0.197 0.393 1.000. 0.042 0.052 0.070 0.209 0.209 0.418 1.000. 0.050 0.057 0.099 0.199 0.199 0.397 1.000. 0.289 0.323 0.565 1.143 1.337 2.342 6.000. Average (Eigenvector) 0.048 0.054 0.094 0.191 0.223 0.391 1.000. as designated evacuation relief centre. Besides, the priority of criteria and sub-criteria is also able to be indicated accordingly. Table 8 Overall priority weights Alternatives / Criteria Priority vectors CR A B C D E F G H I J. f. Step 6 : Perform the Consistency. Having made all the pairwise comparisons, the consistency is determined by using Eigenvalue(λmax) to calculate the Consistency Index, CI as follows : CI = (λmax- n)/(n-1); where n is the matrix size (Table 5). Judgment consistency can be checked by taking the Consistency Ratio (CR) of CI with the appropriate value using Random Consistency Index (RCI) in Table 6. The CR is acceptable and consistent, if it does not exceed 0.10.. +0.391. 1/4 1/5 1/3 1/4 1/2 1/3 1 1 1 1 2 2 Total Maximum Eigenvalue (λmax) CI=(6.028-6)/(6-1) = 0.006 CR=0.006/1.24 = 0.00 +0.223. 1/2 1/2 1 2 3 4. +0.191. +0.094. +0.054. 0.048. 1 1 2 3 4 7. 1/8 1/7 1/4 1/2 1/2 1. 0.290 0.324 0.565 1.151 1.347 2.356 6.034. =. 2 0.00. 3 0.58. 4 0.90. 5 1.12. 6 1.24. 7 1.32. 8 1.41. 9 1.45. SS. 0.048. 0.054. 0.094. BF. GA. AFA. 0.191. 0.223. 0.391. 0.049 0.088 0.062 0.221 0.062 0.063 0.098 0.111 0.098 0.147. 0.030 0.147 0.028 0.147 0.147 0.146 0.029 0.147 0.149 0.030. 0.102 0.118 0.104 0.112 0.107 0.136 0.024 0.147 0.126 0.023. Overall priority. Rank. 0.065 0.120 0.066 0.142 0.116 0.125 0.049 0.131 0.122 0.066. 8 5 7 1 6 3 9 2 4 7. 0.01 0.118 0.102 0.036 0.114 0.098 0.118 0.118 0.060 0.118 0.118. 0.026 0.035 0.043 0.135 0.110 0.093 0.087 0.146 0.148 0.177. 0.026 0.185 0.031 0.108 0.201 0.170 0.046 0.089 0.071 0.072. performance. For the purpose of this study, the reclassification is divided into three categories (Table 9) and the result is shown. 6.044 6.002 6.014 6.026 6.040 6.041 36.168 6.028. in Table 10. Further, decision-maker(s) could analyze and review each of alternative’s deficiency according to respective sub-criteria. This allows the decision-maker(s) to evaluate individual alternatives based on their individual performance. Table 6 Random Consistency Index (RCI) values3) 1 0.00. AA. j. Step 10 : Reclassification of Individual alternative. Table 5 Calculation to get new weights for criteria 1 1 2 4 5 8. DY. before any decision being made. The reclassification is important and can be used for distribution of allocation,. 10 1.49. g. Step 7 : Perform calculation for all levels in the hierarchy model. The same calculation is applied for all sub-criteria and. operations, criteria considered and proclamation of proper buildings as evacuation relief centres purpose.. alternatives according to steps 3-6. h. Step 8 : Develop overall priority ranking. At this stage, the. Table 9 Reclassification index Recommendation Remain the status quo Recommended to be further improved Need to be improved immediately. comparison is performed in order to know how important the sub-criterion contributes to each of respective alternative. Table. Index >0.6 0.6-0.3 <0.30. Table 7 The summary for all priority weights of criteria, sub-criteria and alternatives using Expert Choice ® Goal (1.00) Criteria Consistency Ratio Sub-criteria Consistency Ratio Alternatives A B C D E F G H I J Consistency Ratio. DY 0.048 1 0.833. AA 0.054 2 0.167. 3 0.286. 0.00 0.116 0.116 0.036 0.111 0.111 0.116 0.116 0.046 0.116 0.116 0.00. 0.129 0.032 0.032 0.129 0.032 0.129 0.129 0.129 0.129 0.129 0.00. 0.019 0.025 0.073 0.273 0.189 0.119 0.044 0.166 0.060 0.032 0.02. SS 0.094. 4 0.571 0.00. 5 0.143. 0.030 0.018 0.023 0.035 0.051 0.074 0.111 0.154 0.220 0.283 0.03. 0.023 0.121 0.059 0.261 0.187 0.120 0.078 0.075 0.035 0.042 0.02. 6 0.286. 0.021 0.150 0.043 0.076 0.104 0.280 0.029 0.207 0.061 0.029 0.02. 7 0.571 0.00 0.020 0.195 0.028 0.138 0.285 0.104 0.053 0.038 0.080 0.059 0.02. BF 0.191 0.02 8 0.143. 0.055 0.216 0.020 0.055 0.055 0.216 0.055 0.055 0.055 0.216 0.00. 9 0.187. 0.100 0.100 0.100 0.100 0.100 0.100 0.100 0.100 0.100 0.100 0.00. GA 0.223. 10 0.715 0.00. 11 0.098. 0.036 0.072 0.055 0.257 0.036 0.056 0.105 0.105 0.105 0.174 0.01. 0.045 0.182 0.045 0.182 0.182 0.045 0.045 0.182 0.045 0.045 0.00. 12 0.750. AFA 0.391 13 0.250. 14 0.800`. 0.00 0.029 0.147 0.029 0.147 0.147 0.147 0.029 0.147 0.150 0.029 0.00. 15 0.200 0.00. 0.031 0.148 0.022 0.148 0.148 0.146 0.031 0.148 0.148 0.031 0.00. 0.119 0.119 0.119 0.119 0.119 0.119 0.024 0.119 0.119 0.024 0.00. 0.033 0.113 0.044 0.084 0.059 0.206 0.025 0.259 0.156 0.021 0.01. Table 10 Overall priority weights for Reclassification purpose using Expert Choice ® Criteria DY AA. SS. BF GA AFA. Sub-criteria 1 2 3 4 5 6 7 8 9 10 11 12 13 14 15 *. A 1.000* 1.000* 0.070*** 0.107*** 0.088*** 0.074*** 0.072*** 0.257*** 1.000* 0.138*** 0.250*** 0.196*** 0.212*** 1.000* 0.126*** Remain the status quo. B 1.000* 0.250*** 0.092*** 0.064*** 0.462** 0.536** 0.682* 1.000* 1.000* 0.281*** 1.000* 0.981* 1.000* 1.000* 0.437**. C 0.314** 0.250*** 0.266*** 0.082*** 0.227*** 0.155*** 0.098*** 0.094*** 1.000* 0.212*** 0.250*** 0.196*** 0.149*** 1.000* 0.172*** **. D 0.961* 1.000* 1.000* 0.123*** 1.000* 0.270*** 0.482** 0.257*** 1.000* 1.000* 1.000* 0.981* 1.000* 1.000* 0.326**. Category (Alternatives) E F 0.961* 1.000* 0.250*** 1.000* 0.691* 0.435** 0.178*** 0.262*** 0.717* 0.459** 0.373** 1.000* 1.000* 0.366** 0.257*** 1.000* 1.000* 1.000* 0.138*** 0.217*** 1.000* 0.250*** 0.981* 0.981* 1.000* 0.985* 1.000* 1.000* 0.229*** 0.797*. Recommended to be further improved. 14-3. ***. G 1.000* 1.000* 0.160*** 0.391** 0.299*** 0.103*** 0.186*** 0.257*** 1.000* 0.407** 0.250*** 0.193*** 0.212*** 0.200*** 0.098***. H 0.396** 1.000* 0.607* 0.544** 0.286*** 0.739* 0.134*** 0.257*** 1.000* 0.407** 1.000* 0.981* 1.000* 1.000* 1.000*. Need to be improved immediately. I 1.000* 1.000* 0.220*** 0.777* 0.133*** 0.218*** 0.280*** 0.257*** 1.000* 0.407** 0.250*** 1.000* 1.000* 1.000* 0.603*. J 1.000* 1.000* 0.118*** 1.000* 0.162*** 0.103*** 0.205*** 1.000* 1.000* 0.674* 0.250*** 0.196*** 0.212*** 0.200*** 0.080***.
(4) 7.. SENSITIVITY ANALYSIS AND DECISION OF. weights for all criteria have significant influence to the changes. SOLUTIONS The main purpose of sensitivity analysis is to examine how. in preference of alternatives priority. It allows decision-maker(s) to decide whether some of the criteria need. sensitive the choices are to the changes in criteria weights4) which performed using Expert Choice®. This is useful in. to be sacrificed if they want to select or increase the performance criteria of alternative that located at lower ranking.. situations such as where uncertainties exist in the definition of the importance of different factors. For instance, based on the. This method also provides platform to justify the possibility of such changes before any decision being made.. actual result, it can be seen that the priority for designation purpose is shown in Table 8. However, as more or less weight. The analysis results show that there are several criteria need to be addressed and taken into account according to their. is assigned, the priority of alternatives will tend to have a change. The changes in the criteria weights can be attributed to. priority. As a result, these criteria can be used, detailed and adapted in formulating guidelines, laws or strategies besides. different variations in the result for decision purpose (Fig. 6). In other words, decision-maker(s) have to sacrifice some of the. become value-added to the existing method in making decision from Malaysia context. As GIS is an open source tool, MCA. criteria if they want to select or increase the performance criteria of alternative that located at lower ranking. It shows. could be integrated to perform spatial analysis (Spatial MCA) and extend it to other fields of disaster management such as. that the sensitivity analysis can help the decision-maker(s) to determine which parameters are the key drivers of a model’s. monitoring and budgeting purpose. It can be realized that the integration of other applications as planning DSS tools such as. results in the process of making decision.. GIS, AHP and Expert Choice® could help assisting the MCA process effectively.. The actual result of the analysis for all criteria, the assigned weights (left) and the scores of the alternatives (right) DY = 4.8% AA = 5.4% SS = 9.4% BF = 19.1% GA = 22.3% AFA = 39.1%. Some advantages are discovered through the application of MCA in this case study such as solving decision problem in. A = 7.7% B = 12.1% C = 7.4% D = 13.5% E = 11.8% F = 12.4% G = 4.6% H = 12.6% I = 12.3% J = 5.6%. terms of group consensus, an interactive medium for sharing of ideas and arguments, multi-disciplinary approach, user-friendly and understandable methodology. However, the study has found some weaknesses in application of this method which. The new assigned weights (left) and the scores of the alternatives (right) DY = 16.6% AA = 16.64% SS = 16.9% BF = 16.2% GA = 16.73% AFA = 16.9%. A = 7.0% B = 11.5% C = 5.9% D = 13.2% E = 12.1% F = 12.4% G = 6.2% H = 11.6% I = 12.1% J = 8.1%. includes lengthy debates, time factor, availability of the data and technical aspects of the methodology. 9. CONCLUSION Ideally, it is difficult to achieve perfect solutions from the decision made since there are a lot of factors and parties involved in the process. It can be concluded that MCA is not a. Fig. 6 Sensitivity analysis of the alternatives. 8. FINDINGS An attempt to apply Problem Tree Analysis in the MCA process able to demonstrate ‘causes’ and ‘effects’ that are well. tool providing the ‘right’ solution in decision problem since there is no solution will be judged as ‘right’ or ‘wrong’. Instead, it might be considered ‘best’ for decision-maker(s) according to their value in the form of weighting or considering factors.. identified and subsequently addressed. It could provide a foundation in supporting further discussion and exploring the. However, to ensure it is on the right track, actions should be taken continuously to work towards this ideal way with the aim. decision problem in hand. It is realized that the MCA assists in filtering the collected information. The actual information. of making it into acceptable level. For this reason, the methodology applied and integrated in the study area has. could be classified according to its importance and at the same time the decision-maker(s) can obtain a greater insight into the. shown its significance to assist decision-maker(s) in decision-making process in the context of disaster management.. data and decision problem in detail which is important in performing analysis stage.. Besides, a framework is provided to design effectively and evaluate the criteria and alternative according to goal and set of. Reclassification methods is applied in MCA as one of additional steps for further recommendation and diversify the to. objectives. It can be said that MCA approach tries to reduce the complexity of the decision problem in aggregating the. The evaluation of criteria, sub-criteria and alternatives is based on individual judgment. Hence, in actual, the whole. information besides developing a ranking of the options according to certain preferences. References. way in finding different solutions according decision-maker(s) preferences at decision stage.. process from determination of decision problems, problem structuring, problem analysis to decision rule particularly in. 1). giving weights and judgment should be conducted in groups so that more accurate and satisfying solutions could be produced.. 2) 3). In addition, the Sensitivity Analysis shows that changes in. 4). 14-4. Nur Farha Zakaria, Halina Mohamed Dahlan, Ab. Razak Che Hussin. (2010). Deriving Priority in AHP using Evolutionary Computing Approach. World Scientific and Engineering Academy and Society (WSEAS) Transactions on Information Science and Applications, Volume 7, Issue 5, May 2010, pp. 714-724. District Council of Kota Tinggi. (2009). Draft Report of Kota Tinggi District Local Plan. (In Malay) Saaty, T.L.. (1980). The Analytic Hierarchy Process, McGraw-Hill International, New York, U.S.A. Expert Choice, Inc. (2004). Quick Start Guide and Tutorials. Arlington, VA, USA..
(5)
図

関連したドキュメント
The result of the observation of Cakranegara is 36 settlement blocks, which include 33 blocks dwelt in by the Hindu community in the center of the city, two blocks by
The earthquake damage assessment is also performed by (1) normalized RGB color composition of the two latter coherence maps and (2) logistic discriminant analysis of uncollapsed
Emerging evidence in recent years shows that sphingosine-1-phosphate (S1P) acts on several types of target cells and is engaged in pro-fibrotic inflammatory process and
We present the optimal grouping method as a model reduction approach for a priori compression in the form of a method for calculating an appropriate reconstruction layer profile for
The 100MN hydraulic press of the whole structural model based on the key dimension parameters and other parameters is analyzed in order to verify the influence of the
Lemma4.1.. This is not true if f is not positively homogeneous as the following example shows.. Let f be positively homogeneous. We shall give an example later to show that
Because of the knowledge, experience, and background of each expert are different and vague, different types of 2-tuple linguistic variable are suitable used to express experts’
Since the optimizing problem has a two-level hierarchical structure, this risk management algorithm is composed of two types of swarms that search in different levels,
