Negative Absorption Phenomenon In Weakly Ionized Mercury Plasma
journal or
publication title
福井大学工学部研究報告
volume 20
number 2
page range 169‑179
year 1972‑09
URL http://hdl.handle.net/10098/4736
Negative Absorption Phenomenon In Weakly Ionized Mercury Plasma
* * *
T. IDEHARA, T. N ODA, Y. ISHIDA
(Received Apr. 13, 1972)
Amplification of radio-frequency wave, which results from the negative absorption due to stimulated cyclotron radiation, is verified in weakly ionized mercury plasma. It does not occur continuously but does pulsively at certain phase of an If oscillation in plasma, and its maximum power gain at electron cyclotron frequency is estimated to be over 5 dB from experimental result.
The time-analyzed probe measurement shows that the excess of electrons is found in the energy region where the large Ramsauer effect is expected in the elastic collision cross section of electron, which is a necessary condition of negative absorption shown in theoretical consideration. If the parameters of plasma generation are adjusted to suitable values, the enormous emission pulse is observed synchronizing with an If oscillation, which is considered to be self-oscillation excited by any mechanism of feedback through plasma.
Various features of this phenomenon is compared with those in the case of Xe, Kr and Ar plasma.
1. Introduction
169
Possibility of negative absorption of electromagnetic wave in plasma was first predic- ted by Twiss, in order to explain the enormous radiation found in radio astronomy.1 Following his description, a necessary condition for the occurence of this phenomenon is that the kinetic energy distribution f (e) of the radiating electrons is markedly non-thermal with an appreciable excess of high energy electrons such that df/de is positive over a finite range of the kinetic energy e, where the stimulated transition probability should have a sharp maximum. This condition can be met for the cases in which the dominant radiation process is due (a) to Cerenkov effect, (b) to cyclotron radiation by non-relativistic electrons and (c) to synchrotron-type radiation by relati- vistic electrons.
After then, Bekefi et al. and Tanaka et al. discussed possibilities of negative absorption for various types of electron distribution function and stimulated transition probability.2-5 As an example of them, it was described that the negative absorption due to stimulated cyclotron radiation and bremsstrahlung occurs in a partially ionized non-relativistic plasma, when population inversion of radiating electrons occurs, i. e.
* Department of Applied Physics
df/de is positive, in a range of electron energy where the Ramsauer effect is appre- ciable in the collision frequency Ii for momentum transfer (which electron-neutral collision in weakly ionized plasma).2,4,5 If the Ramsauer effect and population inversion of electrons are described for mathematical convenience by expressions of )I (v) ocvh and f (v)
ceo
(v-vo) (where v is electron speed), then the condition of negative abso- rption is h>3, which indicates that the large Ramsauer effect is expected for occurence of negative absorption.Experimentally, an anomalous cyclotron emission pulse in microwave region was observed at a certain phase of low frequency oscillation in partially ionized Xe, Kr and Ar plasma, and suggested to be a manifestation of the negative absorption due to stimulated cyclotron radiation predicted theoretically, since it does occur only in the plasmas having large Ramsauer effect. On the other hand, in order to give this phenomenon clear evidence, the amplifications of microwave and radio-frequency wave were verified in partially ionized Xe, Kr and Ar plasma in the vicinities of electron cyclotron frequency and its harmonics (£;::::nf)1,9,lO and the frequency region lower than collision frequency (£<)1).8 In the plasma produced by dc discharge, ampl~
ification as well as an anomalous emission was observed pulsively at a certain phase of If oscillation applied from external source/-9 while in the neutral Xe gas penetrated by electron beam having low energy (several eV) which lies in the region of large Ramsauer effect, it does occur continuously at electron cyclotron frequencyY These experiments verify completely the negative absorption due to the stimulated cyclotron radiation (f~nf) and bremsstrahlung (£<)1) in a non~relativistic plasma.
In this paper, it is described that the negative absorption due to the stimulated cyclotron radiation is found also in mercury plasma where the Ramsauer effect is more conspicuous than Xe, Kr and Ar plasma. In section 2, experimental apparatus and procedures are explained, in section 3 the experimental results and comparison of them with the theoretical consideration are presented and in section 4 the summ~
aries of this paper are described.
2. Experimental apparatus and procedures
Through the experiment, we used a discharge tube (50 mm in inner diameter) filled with mercury vapor, which contains a tungsten mesh grid, a cylindrical probe and an anode disc (30 mm in diameter) which are located 9 mm, 20 mm and 40 mm from the surface of an oxide~coated cathode (25 mm in diameter), respectively. In order to vary the pressure of mercury vapor p, the tube is put in the air bath whose temperature can be increased from 8°C to 120°C, so that p is varied from 2.5xl0- 4 to 0.7 Torr. A uniform magnetic field (its nonuniformity .JB/B is smaller than one percent through the region of plasma) is applied parallel to the tube axis by the Helmholz coil, whose intensity is varied from
a
to 380 gauss. The plasma is produced by a dc discharge and an external low frequency voltage (several KHz) is applied to anode in order to modulate dc discharge so that the plasma electrons may become171 far from the thermal equilibrium. The discharge current Id can be increased from 5 rnA to 100 rnA and the electron density varies from 2xl08 to 9xl09 cm-a at pressure of 1 mTorr.
The experimental apparatus used here is shoWn in Fig. 1. A radio-frequency emission is picked up from the anode and
detected by a field intensity meter (hereafter called FI meter) whose band width and minimum detectable power are about 0.08 MHz and 2 x 10-12 watt.
A dc output of the FI meter is fed to a vertical axis of an XY recorder, while a magnetic field intensity to a horizontal axis, so that the emission intensity spectrum is displayed as a function of magnetic field intensity at a constant discharge current. On the
Fig. 1 Diagram of the experimental arrangement.
other hand, the output voltage from intermediate frequency amplifier contained in FI meter (IF output voltage) is measured on a scope together with a low frequency oscillation picked up by the anode, in order to examine the phase relation between the rf emission and the If oscillation.
The negative absorption does not occur continuously but pulsively synchronizing with If oscillation as deSCribed in section 3. In order to examine plasma electron distribution at each phase of If oscillation and investigate the relation between the state of plasma and occurrence of negative absorption, the time-analyzed probe mea- surement is done, using the apparatus shown in Fig. 1. The current picked up by a probe situated at the center of plasma is fed to the sampling detector whose sampling pulse width is about one hundred nano second, and its dc output is displayed versus the probe voltage on an XY recorder at a constant discharge current Id and constant sampling time T, so that the characteristic curve of single probe at a definite phase of If oscillations is obtained. By doing the same measurement for various times T, we can obtain the characteristic curves for the corresponding phases of If oscillation.
In order to verify the negative absorption phenomenon obviously, we must examine the amplification of waves in plasma. When an rf signal is applied to the grid conti- nuously, the output signal at the anode is detected by the FI meter and its IF output voltage V2 is measured on a scope, while a voltage Vl at the output of rf oscillator is directly picked up and its level is checked On a scope. On the other hand, the If oscillation at the anode is observed at the same time on a scope using another channel, so that the voltage ratio V2/Vl is estimated at each phase of If oscillation. In order to verify the amplification, we must estimate the power gain in plasma between grid and cathode G=P2/PO and show that its value is larger than 0 dB, where P2=V22/R2
is the output power at anode and Po is the incident power to grid. HOWever, it is difficult to determine the precise value of G, because the output and input impedance
R2 and Rg cannot be estimated precisely, so we will consider only the sufficient condition for amplification instead of estimation of G. Considering that the output impeadance of rf oscillator Rl is equal to 50 ohm, the gain G is described as follows.
G=10 log (P2/Pg)=10 log (P2/P1)+10 log (Pl/Po)
=20 log (v2/vl)+10 log (Rl/R2)+10 log (P1/Pg)
The third term of above equation is always positive because of mismatching at grid.
Since we have set up to make R2=50 ohm, the second term is also positive, whatever value discharge impedance may take. Therefore, in our apparatus, the sufficient condition for amplification is that the first term is positive.
3. Experimental results and discussions
(a) Observation of pulsive emission near the electron cyclotron frequency
An enomous pulsive emission Was observed near electron cyclotron frequency synch ronizing with If oscillation, whose feature is similar to that in the case of Xe, Kr and Ar plasma, as shown below.
1) A series of emission spectra which were displayed on XY recorder as functions of normalized magnetic field felf with receiving frequency f as a parameter shows an anomalously large peak near fc/f=l, where fc is the electron cyclotron frequency.
One of them is shown in Fig. 2 (a). The magnetic field fc where the emission is observed on the spectrum for each receiving frequency was plotted on fc-f diagram, in Fig. 2 (b).
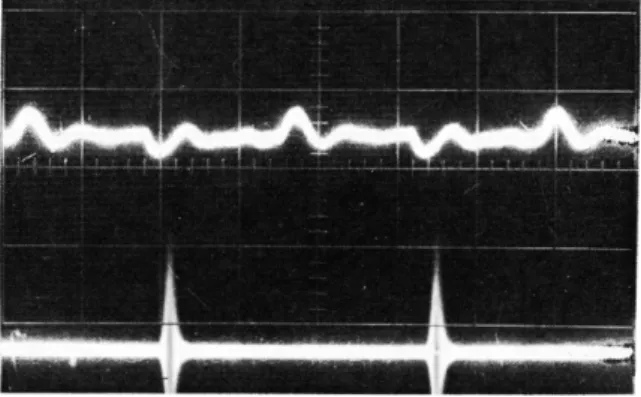
2) The feature of emission was observed On the lower trace of a scope together with If oscillation picked up at anode and fed to the upper trace.
It is emitted as several ten micro second pulse, at a certain phase of If oscillation, as shown in Fig. 3.
3) The maximum power which we observed reaches 2x 10⁻⁶ watt. Consi- dering that the normal cyclotron emission power cannot be over the blackbody emission poWerl l which is estimated to be about 10-12 watt in our plasma, the observed pulse emis- sion power is anomalously large.
4) The width of frequency spec- trum of the emission is several ten MHz and comparable with or smaller than the collision frequency of elect- ron with the neutral atoms /.It which
-
Nf=fc--...s--~
:J: ~ (b) ...,
~
Q,Q
>.200
u
Q'~
c OJ ::J CT
~
Q'
"4-
c 100
~rf ~
0
....
-
0 I I I-
u0 1/2 1 fclf
~ 0
0 100
200
Recieving frequency f (MHz)
Fig. 2 (a) The emission spectrum as a function of normalized magnetic field fe/f.
f=180MHz.
(b) The magnetic field where the anomalous emission apears is plotted versus rece- iving frequency.
p=1.20mTorr. Id=1O.5mA
173
is calculated to be about 30 MHz from our experimental condition. From the charact- ers mentioned above, the emission is considered to be a manifestation of negative absorption due to the stimulated cycl-
otron radiation, which is verified in this section.
(b) Relation between a velocity distri- bution of electron and occurence of emission pulse
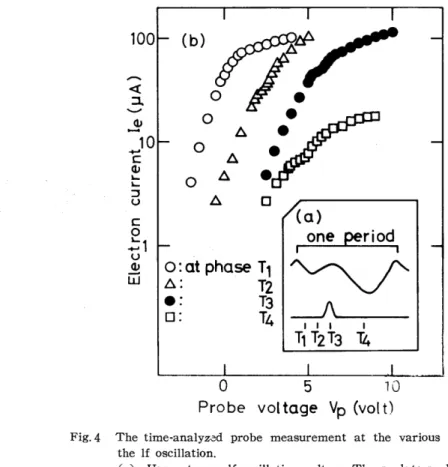
It may be interesting to examine the state of plasma when the emission pulse is observed. Noting that the pulse occurs at a certain phase of If oscilla tion applied from external If oscillator, we do a probe measurement at a fixed phase of If oscillation using a sampling detector and examine pla- sma parameters at various phases over one period of If oscillation. FigA (a) shows the rf emission signal and
Fig. 3 Relation between an rf emission pulse and an 1£ oscillation voltage. Upper trace: an 1£
oscillation voltage applied to an anode. 20 volt/div. Lower trace: an rf emission signal at the cyclotron frequency. The peak power is about 2XI0-7 watt. f=230MHz. fc=236MHz.
p=1.25mTorr. Id=I1.0mA. Sweep time: 0.1 msec/div.
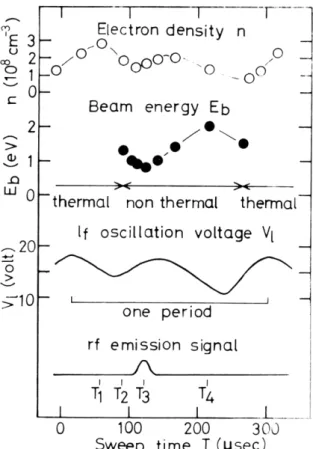
If oscillation voltage both picked up at anode and displayed on a scope. The probe measurements were done at four different phases of If oscillation TJ, T2, Ta and T4 shown in this figure, the results of which are drawn in Fig. 4 (b). The characteristic curve at Tl shows that a plasma at this phase is nearly thermal, while the curves at T2, Ta and T4 show the step feature and imply that the plasma at these phases is nonthermal and beam-like electrons exist in plasma. In Fig. 5, the beam energy which is determined by analyzing the characteristic curves is shown as a function of phase of If oscillation, together with electron density of· background plasma electrons.
The electron density varies with variation of If oscillation voltage, delaying about 30 micro second. The beam energy varies from about 1 eV to 2 eV in the finite region of phase in a period. Comparing the beam energy with the emission signal shown on the lowest trace in this figure, the emission pulse is observed when the beam energy is found at about one electron volt. This value of beam energy does agree with that where the large Ramsauer effect is expected on the elastic electron collision cross section with the mercury atomsY This fact shows that the necessary condition for negative absorption discussed elsewhere2,4,5 is satisfied at the phase where the emis- sion pulse is observed.
(c) Verification of the negative absorption of rf signal
In order to verify the negative absorption in plasma, it must be shown that rf signal applied from an external source is amplified in plasma when the enormous emission pulse mentioned above does not occur spontaneously. After the parameters of plasma generation (i. e. discharge current, If oscillation frequency and voltage and background pressure) were adjusted at suitable values so that the emission pulse was suppressed,
100
o
c..=,
u
W
OJ(0)
one period o:at phase T,
~:
T2
. : T3
0: T4
~----~---~---~
o 5
10Probe vol toge Vp (vo! t)
Fig. 4 The time-analyzed probe measurement at the various phase in the 1£ oscillation.
(a) Upper trace: 1£ oscillation voltage. The peak to peak voltage is 7 volt. Lower trace: rf emission signal. f = 371MHz. fc = 371MHz. One period is 290 J1. sec. Probe measurement were done at the phases denoted by Tb T2 • Ta and T4•
(b) Characteristic curve of probe measurement at each phase.
p=1.83 mTorr. Id=4.0 m.A.
rf signal whose frequency f is equal to the electron cyclotron frequency fc was applied to grid and the output signal at the anode was detected by FI meter and observed on a scope, using the apparatus shown in Fig. 1. In Fig. 6, the upper trace shows the 1£ oscillation voltage at the anode, while the lower one shows both rf output siganls with and without input signal. Comparing the output signal level V2 with the signal level at the output of rf oscillator Vh it is noted that the former is over the latter at the finite phase Tl of 1£ oscillation where the fully suppressed emission pulse occurs spontaneously. In the case shown in this figure, the voltage ratio V2/Vl is about 4 dB.
From the consideration in;Jhe previous section, this result shows that the power of rf signal applied to the grid was amplified in plasma at the phase T I.
The variation of the voltage ratio V2/VI as a function of the power PI of rf oscill- ator was measured for various phases of 1£ oscillation. The phases Th T 2, Ta and T4 where the measurement was done and the result of measurement at each phase is shown in Fig. 7 (a) and (b), respectively. At the phases T 2, Ta and T 4, the ratios V2/VI had negative values nearly independent on Ph which were about-13, -18 and -20
co o
..Q
2
W 0
o >
~
Beam energy Eb /.~
• • -../ •
><
thermal non thermal thennal If oscillation voltage VI
one period rf emission signal
1\
I I I I
1
I
I I
T1 T2 T3 T4
_~_J
0 100 200 300
Sweep time T (j.Jsec)
Fig. 5 The variation of beam energy and density of background electrons are shown together with an rf emission signal (f = 371 MHz) and an If oscillation voltage. The emission peak is about 2X 10⁻⁸ watt fc=371 MHz. p= 1.83 mTorr. Id=4.0 rnA.
I
1;
-v. 1
Fig.6 Upper trace: If oscillation applied to an anode. 20 volt/div. Lowvr trace : The part of left side show3 the emis3ion signal wthout incident signal, and one of the right show3 th~ output rf signal at an anode with incident signal. The signal level at the output of rf oscillator is denoted by VI. It is seen that rf signal is amplified at the phase Tl. Sweep time: 0.1 msec/div. PI = - 37 dBm and P2=-33 dBm at the phase TI . p=1.25mTorr. Id=1l.9mA.
175
o
I I I
(0) O~sec
~J 20volt
~_zero
level
10 - (b)
~o
o
(l) -10 ~
rn
a
+-'
o
>
1 1 1
-40 -30 -20
Power P1 (d Bm)
-
-
Fig.7 (a) The phase where the transmission measurement was done are shown by TI , T2 , Ta and T4 and related with an 1£
oscillation and an rf output signal at the anode
(b) Voltage ratio VdVI at each phase as a function of power level Pl. f=230MHz. fc=236MHz. p=1.25mTorr. Id=11.9mA.
0, ."~t:J and.6.: at phase T}, T 2, T 3 and T 4,
dB, respectively. On a contrary,"'the ratio V2/VI at the phase TI had a nearly constant positive value of 5 dB at the weak incident power (P1
=
-42---- -32 dBm) , decreased with PI when PI increased over the critical value PCrit=-32 dBm and became negative when Pl exceeded -25 dBm. This fact seems to imply that the negative absorption occurs at the phase T I only in the range of weak incident power and saturation phenomenon appears at strong incident power, as Well as the experimental results verified for Xe plasma.7,sWe have shown the behaviours of negative absorption only at the electron cyclotron frequency fc in the previous paragraph. Next, its dependency on the frequency was investigated in the frequency region including f c. The values of ratio V2/VI as functions of frequency f were measured at three phases denoted by Th T2 and Ta, which are shown in Fig. 8 (a). The results are plotted in Fig. 8 (b). Three Curves corresponding to the phases Th T2 and Ta show very different features each other near the electron cydotron frequency. The Curve corresponding to phase T I has the maximum of positive
I I I T
(0) 0.1msec
r I
~J20vo(t
w--h _,ero 1
,...I~
eve
T211 T3
- m
10 r-(b)
-
... -0
ooo~ .000
'> 0
-
> N -10- i~e ~
0
-
:g
0 -20 r-o
DO-
10...
Q) -30
-
0: Tl 0cP -
0'1.
e:
T2 0 0...
d 0: T3-6 -40
-
0 0-
> 0
I I
fc ~- I I
150 200 250 300
Frequency f (MHz)
Fig. 8 The voltage ratios V2/VI as functions of frequency f, at the phases TI, T2 and Ta. which are shown in (a) together with If oscillation voltage and rf output signal in the case of f=fc•
fc=226 MHz. p= 1.25 mTorr. Id=l1.9 rnA. PI = -27 dBm
177
value at f=fe, which gives the sufficient condition for negative absorption, while that corresponding to Ta has the minimum of negative large value. However, in the region of frequency far from fe, the three curves show the similar feature. Comparing with the theoretical consideration of the absorption coefficient in plasma/o,ll it is considered that the ·curve for Ta shows the normal cyclotron absorption and the curves for Tl and T2 show the existence of the mechanism of negative absorption due to the stimul- ated cyclotron radiation. If the electrons are assumed to be monoenergetic, the effective collision frequency JI and the effective value of h are estimated from the analysis of the feature of curve for T h which gives JI;::'; 20 MHz and h:::::, 3.7. This value of h is considered to be much smaller than that obtained from the experimental data.12 This underestimation for h may come from the severe assumption that the electrons are monoenergetic.
It is verified from the experimental investigation described in this section that the negative absorption due to the stimulated cyclotron radiation does occur also in mercury plasma where the Ramsauer effect is very large.
4. Summary
In the previous section has been described the investigation of the negative absorption phenomenon in weakly ionized mercury plasma, which is summarized as follows.
1) By applying the rf signal (Vl) to the grid, detecting at the anode the transmission signal (V2) and estimating the voltage ratio V2!Vt, it is verified that negative absorption, i. e., the amplification of rf signal, occurs at the definite phase of If oscillation, when the frequency of the signal is nearly equal to the electron cyclotron frequency fc•
2) The frequency region where this phenomenon is observed, is narrower than the elastic collision frequency II, i. e.
I
f-fel<II.
3) The ratio V2!Vl at the phase is nearly constant at the weak incident power Pl.
However, it decreases with increasing Plover a certain value Pcrit, so that the satu- ration effect is expected in this phenomenon.
4) If the parameters of plasma generation are adjusted to suitable values, the enormous emission pulse is observed synchronizing with an If oscillation at the electron cyclotron frequency, even when the rf signal is not applied from external source.
Since the phase of If oscillation where this spontaneous emission pulse is observed does correspond to that where the negative absorption occurs at the slightly different condition of discharge, the emission pulse is considered to be self-oscillation which is excited by any mechanism of feedback through plasma.
5) The time-analyzed probe measurement at the phase of If oscillation where the emission pulse is observed shows that the beam component of electrons having the energy of about one electron volt exists in the nearly thermal background electrons.
Since this value of electron beam energy situated near the value where the large Ramsauer effect is expected, the fact shows that the condition for the negative abso- rption may be satisfied at that phase.
It is concluded from the various experimental evidences, that the negative absorption due to the stimulated cyclotron radiation occurs in weakly ionized mercury plasma as well as Xe, Kr and Ar plasmas.
AcknoWledgements
The authors would like to express their sincere thanks to Professor S. Tanaka, Kyoto University for his interest and encouragement. They also thanks Mr. 1.
Kasuga, Kyoto University for his kindness to prepare the discharge tube used through the experiment. This work was partially supported by Grant-in-Aid from the Ministry of Education.
References
1) R. Q. Twiss, Australian J. Phys. 11, 564 (1956)
2) G. Bekefi, J. L. Hirshfield and S. C. Brown, Phys. Fluids 4, 173 (1961) 3) G. Bekefi, J. L. Hirshfield and S. C. Brown, Phy. Rev. 122, 1037 (1961) 4) S. Tanaka and K. Mitani, J. Phys. Soc. Japan 19, 1376 (1964)
179 5) N. Shimomura, K. Mitani and S. Tanaka, J. Phys. Soc. Japan 21, 1372 (1966)
6) S. Tanaka, Y. Terumichi, K. Mitani and H. Kubo, J. Phys. Soc Japan 18, 1810 (1963) 7) Y. Terumichi, T. Idehara, I. Takahashi, H. Kubo and K. Mitani, J. Phys. Soc. Japan 20, 1705
(1965)
8) S. Tanaka and K. Takayama, J. Phys. Soc. Japan 21, 2372 (1966) 9) T. Idehara, J. Appl. Phys. 43, 64 (1972)
10) J. M. Wachtel and J. L. Hirshfield, Phys. Rev. Letters 19, 293 (1967)
11) G. Bekefi, Radiation Processes in Plasma (John Wiley and Sons, Inc., New York, 1966) 12) S. C. Brown, Basic Data of Plasma Physics (The M. 1. T. Press, Massachusetts, 1966)