I Original I
Measurement of Neutron Flux Spectrum by Multi-Foil Activation Method at the Central
Graphite Cavity of UTR-KINKI
Katsuhei KOBA Y ASHI*, Shuji
Y
AMAMOTO*, Itsuro KIMURA **Ryota MIKI and Tetsuo ITOH
(Received September 30, 1988)
At the central cavity in the internal graphite reflector of the Kinki University Reactor, UTR-KINKI, the flux spectrum of neutrons was measured by two foil activation methods: Firstly, so called sandwich foil method was applied to the measurement of epithermal neutrori fluxes at 1.46, 4.94, 18.8 and 337 eV, corresponding to the resonances of In-U5, Au-197, W-186 and Mn- 55, respectiveiy. Secondly; the neutron spectrum was obtained by unfolding multi-:-foiI .activa- tion "data using a code named NEUPAC. Both results showed a good agreement with that by the two dimensional diffusion (CITATION) and transport (TWOTRAN) calculations with the SRAC code system. Through the present measurements and analysis, it is found that the neu- tron spectrum at this central cavity is very close to the liE standard field in the energy region from about 1 eV to a few hundreds keY and is superior to other liE neutron fields ever pro- posed.Supplementally, distributions of thermal neutrons and Cd-ratio at the central cavity in UTR-KINKI were experimentally obtained.
KEYWORDS
UTR-KINKI, central graphite cavity, neutron flux, neutron energy spectrum, activation foils, resonance foils, unfolding, NEUPAC code, multi-foil activation data, SRAC code system, calcula- tion, standard liE neutron spectrum.
Introduction
A standard neutron field, not only of the neutron flux but also of the neutron energy spectrum, is of great importance for integral check of nuclear data. calibrating neutron detectors and evaluating such as isotope production and irradiation effects by neutrons.t>
At the IAEA meeting on this subject2). the Maxwellian distribution in the thermal neutron energy and the spontaneous fission neutron spectrum of 252Cf were selected to be well
*Research Reactor Institute, Kyoto University
**Dept. of Nucl. Eng., Fac. of Eng., Kyoto University
KOBAYASHI etc: Measurement of Neutron Flux Spectrum by Multi-Foil Activation . Method at the Central Graphite Cavity of UTR-KINKI
decided standard neutron fields. At the same time, the liE neutron spectrum field was considered to be a candidate for a standard spectrum in the intermediate and resonance neutron energy region. The NBS group tried to make an intense standard liE spectrum field in a graphite thermal column, ISNF ICV in NBSR3). However, their result showed remarkable deviations from. the liE type shape. Two of the present authors and so forth have pointed out that the neutron flux spectrum in the core region of the Kyoto Univer- sity Reactor, KUR, is considerably close to the liE shape at energies from 0.5 eV to a few tens KeV4).
In the present work, we have paid attention to the neutronic characteristics of the Kinki University Reactor, UTR-KINKI, which has 46 cm thick internal graphite reflector between the two-divided cores. A central graphite stringer of 9.6 X 9.6 cm square and 66 cm long can be removed to make a cavity for large sample irradiation. Miki and Itoh5) carried out an analytical calculation by the SRAC code system6) and demonstrated that the neutron spectrum at this cavity showed an excellent liE shape.
In this study, two kinds of foil activation methods have been applied to measure the neutron flux spectrum at this central graphite cavity. One is the sandwich foil method7•S
)
using resonance foils of In-115, Au-197, W-186 and Mn-55. The other is that by unfold- ing multi-foil activation data using the NEUPAC code.9•10) Both results are compared with that obtained by the diffusion and transport calculations with the SRAC code system5).
The spatial distributions of thermal neutron flux and Cd ratio have been supplementally measured with gold foils.
Experimental Method 1) F llcili ty
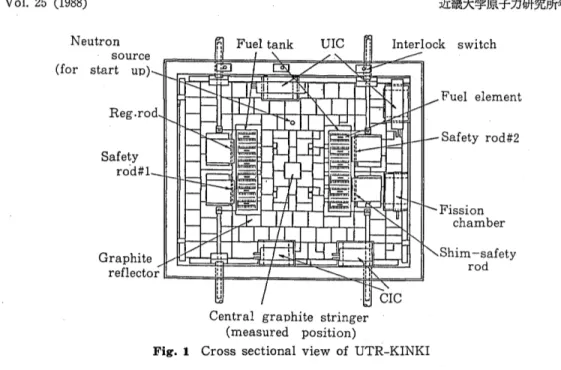
The Kinki University Reactor, UTR-KINKI, is a light water-moderated and graphite reflected research reactor5).w, which has the 46 cm separate cores. It has twelve fuel elements and each of them contains twelve aluminum-clad, flat MTR-type fuel plates, whose enrichment is 90%. and the critical mass is approximately 3,018 grams of 235U. The nom- inal output power is 1 W. At the center of the internal graphite reflector between the two-divided cores as shown in Fig. 1, there is a graphite stringer of 9.6 X 9.6 cm square and 122 cm long. which can be withdrawn to make a void region or a central cavity for irradiation of large samples. A sample holder as seen in Fig. 2, 9.5 X 9.5 cm square and 66 cm length, made of aluminum, was prepared and set at this central cavity. This holder was sandwiched by two graphite stringers of 28 cm up and down. to save the neutron ~eak
age from the void region, so that one can expect an uniform and flat distribution of neu- trons· in the center region at the cavity.
2) Ac tiva tion Foils
In the present experiment, three kinds of activation measurements have been made:
(1) the first one is epithermal neutron flux measurement at big resonances by using the
Neutron
source Interlock switch
(for start up)_ -fRs=8R:=;:t;!r,~~~~~=P~~:kI
Reg.rod Safety
ro-d#l
Graphite
reflector 1!====jHf===/====~~~~F==dJ Central graphite stringer
(measured position)
Fig. 1 Cross sectional view of UTR-KINKI
Fuel element Safety rod#2
Fission chamber Shim-safety
rod
sandwich foil technique7•S), (2) the second is neutron spectrum measurement by unfolding multi-foil activation data, and (3) the last one is thermal neutron flux and Cd ratio mea- surements using gold foils. The characteristics of the activation foils are summarized in Table 1.
Gold and indium samples for the spectrum unfolding were diluted as an aluminum- alloy in order to avoid neutron resonance self-shielding effect in the material, and sodium was prepared by drying aqueous solution of NaCl on a filter paper.
Table 1 Characteristics of the activation foils.
Measurement Foil Size (in mm)
Purity C%)
diameter thickness
Au foil 12.7 0.050 99.99
Epithermal In foil 12.7 0.2 99.9
neutron flux W foil 12.7 0.127 99.95
MnCu foil 12.7 0.2 Mn : 84.34
AuAl wire 0.5 10 cm long Au: 0.0314
InAl foil 12.7 0.2 In : 0.01
Na aqueous soL, 200,ul,. Na: 1.0
Spectrum dryed on a filter paper
Cu foil 12.7 0.3 99.9
unfolding
Co foil 12.7 0.127 99.9
In foil 12.7 0.2 99.9
Ni foil 12.7 0.5 99.8
Al foil 12.7 0.5 99.99
Thermal Au foil 12.7 0.050 99.99
neutron flux Cd-cover 15 0.5 99
KOBAYASHI etc: Measurement of Neutron Flux Spectrum by Multi-Foil Activation . Method at the Central Graphite Cavity of UTR-KINKI
3) Irradiation
Each of the activation foils was put in a Cd-cover 0.5 mm thick, and the foils, which were attached on the aluminum holder as seen in Fig. 2, were irradiated at the central graphite cavity in UTR-KINKI. The irradiations were performed for between two and three hours with the nominal power of 1 W. In each irradiation run, two gold foils without a Cd-cover were used to monitor the neutron intensity between the experimental runs.
Fig. 2 Aluminum holder for foil irradiation.
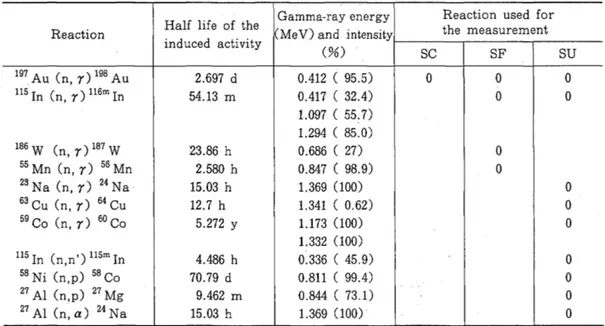
Table 2 Activation reactions and nuclear data used for the present measurement.
Half life of the Gamma-ray energy Reaction used for
Reaction (Me V) and intensity the measurement
induced activity
(%) SC SF SU
197 Au (n, r) 198 Au 2.697 d 0.412 ( 95.5) 0 0 0
115 In (n, r) 116m In 54.13 m 0.417 ( 32.4) 0 0
1.097 ( 55.7) 1.294 ( 85.0)
186 W (n, r) 187 W 23.86 h 0.686 ( 27) 0
55Mn (n, r) 56Mn 2.580 h 0.847 ( 98.9) 0
23 Na (n, r) 24 Na 15.03 h 1.369 (100) 0
63 Cu (n, r) 64 Cu 12.7 h 1.341 ( 0.62) 0
59 Co (n, r) 60 Co 5.272 y 1.173 (100) 0
1.332 (100)
115 In (n,n') 115m In 4.486 h 0.336 ( 45.9) 0
58 Ni (n,p) 58 Co 70.79 d 0.811 ( 99.4) 0
27 Al (n,p) 27 Mg 9.462 m 0.844 ( 73.1) 0
27 Al (n, a) 24 Na 15.03 h 1.369 (100) 0
SC : Distribution of thermal neutron flux and Cd ratio.
SF : Sandwich foil method; main resonances are. 1.46 On-115), 4.94 (Au-197), 18.8 (W-186) and 337 (Mn-55) e V, respectively.
SU : Spectrum unfolding.
4) Activity Measurement
After the foils were irradiated, gamma-rays from the induced activities were mea~
sured with a pure Ge-detector, whose detection efficiency had been calibrated wih stan~
dard gamma-ray sources purchased from the Bureau National de Metrologie, . France.
The nuclear characteristics of the foils are listed in Table 2, in which the reactions and the gamma-ray data used for the measurement are also given12).
The reaction rate R from each reaction can be deduced by the following relation;
where A is decay constant, T
%
half life, C counts per second, M atomic mass, m weight of sample foil, No Avogadro's number, 10 isotope abundance, Ig gamma-ray intensity, c detection efficiency, Ti irradiation time, Tw cooling time, Tm counting time, respectively.Calculation
The energy spectrum of neutrons at the center of the internal graphiteretiector of UTR-K1NK1 has been calculated5) using the SRAC code system,6) which includes cross section libraries, auxiliary processing codes, and other various routines and calculation parameters. By removing a central vertical graphite stringer, a void region of 9.6 X 9 . 6 cm square and 66 cm height was prepared for the foil irradiation. In this calculation, geo~
metrical conditions were assumed to be that the 46 cm separate cores with flat MTR-type enriched uranium fuels closely resembled a cylindrical ring. The calculations were carried out with the SRAC code system6), two dimensional diffusion code (CITATION) and two dimensional transport code (TWOTRAN) on X-Y and R-Z geometries, to obtain the energy spectrum 6f neutrons in the central void region .. One hundred and twenty group constants were produced from -the ENDF /B-IV data.
The details of the calculation procedures including the two-dimensional (R, Z) model for the core configuration are reported in elsewhere5.u>.
Reduction of Neutron Spectrum and Flux 1) Epithermal Neutron spectrum
The sandwich -foil method using four kinds of resonance· foils has been used to mea~
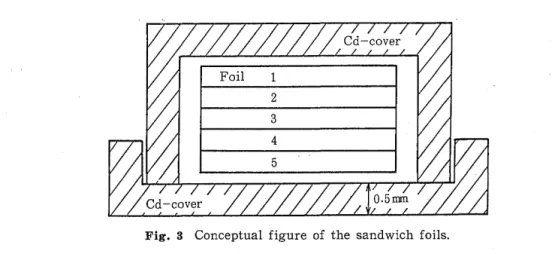
sure epithermal neutron spectrum7>8) . In this work, we employed (n, "I) reactions for 1n- 115, Au-197, W-186 and Mn-55, of which main resonances are 1.46, 4.94, 18.8 and 337 eV, respectively. Five sheets of resonance foils have been put one upon another in a packet with a Cd-cover 0.5 mm thick, as seen in Fig. 3. The reaction rate of the each foil is divided into two parts: (1) one due to the strong resonances, and (2) the other due
KOBAYASHI etc: Measurement of Neutron Flux Spectrum by Multi-Foil Activation Method at the Central Graphite Cavity of UTR-KINKI
Foil 1 2 3 4 5
Fig. 3 Conceptual figure of the sandwich foils.
to weak resonances and the l/v cross section. The difference ~A between the reaction rates from the center foil No.3 and the average value from the outer foils No.1 and No.5 as seen in Fig. 3, is expressed asS):
where, ~Ais the remaining difference in reaction rate due to the strong resonance con- tributions, c is detection efficiency, N is number of target atoms, and ep(Ui) and Xi are neutron lethargy flux and the sandwich foil cross section at the i-th resonance, respec- tively. In this measurement, each Xi value for the main resonance (i=l) was referred to the data by Nakazawa13), except for the Mn data, which we obtained by the calculation using a Monte Carlo code14).
2) Spectrum Unfolding
The neutron spectrum has been obtained by unfolding multi-foil activation data using the NEUPAC code9•10), which was successfully applied to several neutron spectrum mea- surements4•10). The principle of this code is based on the J-l type unfolding method9 •10 •15),
and we obtain neutron flux ep(E) from the following integral equation;
Ri
±~Ri
= f:[O'i (E)±~O'i
(E)]¢(E)dE (i=I,2,-n)where, O"i (E) is energy dependent cross section to the i-th experimental reaction rate R i.
In other words, this method is to determine the neutron flux ep(E) from the iterated flux epo (E), in order to make the difference between the measured and calculated reaction rates to be minimum by taking account of the measured weighting data, with the following re- lation;
¢(E) =¢o (E)
+
kf'1(E) [Ri -f:
O'i (E)¢o (E) dE]where, O"i*(E) (i=I,2, -n) is a biorthogonal vector set. This method was proposed by
Nakazawa et a19). and was shown to have an approximate solution based on the Bayes' theorem.
The NEUPAC code contains energy dependent group cross section libraries including the error matrices for main important neutron dosimetry reactions in ENDF /B-V. These constants with 144 groups were processed by the N-JOY code16) in the energy range from 0.01 eV to 16.4 MeV. For the NEUPACcalculation, variance-covariance errors of every input data and initial neutron spectrum are required. The outputs give not only the spec- trum with its covariance errors but also the relating integral quantities and their uncer- tainties, and the chi-square test in the calculation can be performed to check a physical validity of the resultant spectrum.
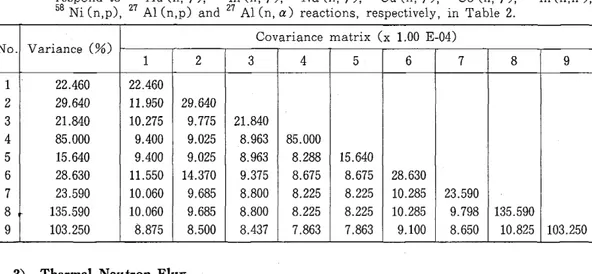
Variance-covariance data for the nine kinds of measured reaction rates, appeared in Table 2, were prepared as input for the NEUPAC calculation, in a similar manner to the previous method by two of the present authorsl7). The resultant covariance matrix ob- tained is given in Table 3. In addition, the initial guess spectrum for the NEUPAC cal- culation was taken from the SRAC calculation obtained above.
Table 3 Covariance matrix used for the input of the NEUPAC calculation, Nos. 1 to 9 cor- respond to 197 Au (n, r), 115 In (n, r), 23 Na (n, r), 63 Cu (n, r), 59 Co (n, r), 115 In (n,n'),
58 Ni (n,p), 27 Al (n,p) and 27 Al (n, a) reactions, respectively, in Table 2.
Covariance matrix (x 1.00 E-04) No. Variance (%)
1 2 3 4 5 6 7 8 9
1 22.460 22.460
2 29.640 11.950 29.640
3 21.840 10.275 9.775 21.840
4 85.000 9.400 9.025 8.963 85.000
5 15.640 9.400 9.025 8.963 8.288 15.640
6 28.630 11.550 14.370 9.375 8.675 8.675 28.630
7 23.590 10.060 9.685 8.800 8.225 8.225 10.285 23.590
8 135.590 10.060 9.685 8.800 8.225 8.225 10.285 9.798 135.590
9 103.250 8.875 8.500 8.437 7.863 7.863 9.100 8.650 10.825 103.250 3) Thermal Neutron Flux
Thermal neutron flux and Cd ratio have been measured by the activation method using gold foils, whose size and thickness are shown in Table 1. To take the Cd ratio, the gold foil was inserted in a Cd-cover 0.5 mm thick. As well known, the neutron flux has been derived from the following relation 18.19):
C(1-FCd/Rcd)
¢lth N'ifac tf(l-FcdTc/ h)'
C : activation counting rate,
FCd : cadmium correction factor, RCd : Cd ratio,
KOBAYASHI etc: Measurement of Neutron Flux Spectrum by Multi-Foil Activation ., . Method at the Central Graphite Cavity of UTR-KINKI
N : atomic density.
O'a c t : effective activation cross section.
f : perturbation factor.
TCd t h : thermal neutron tranceparency (very small).
Results and Discussion
The result of the epithermal neutron spectrum measurement by the sandwich foil
Neutron energy (eV)
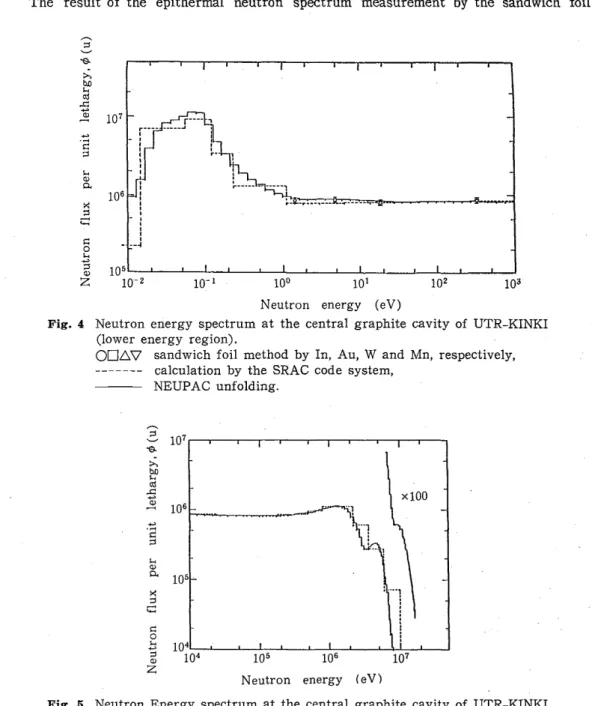
Fig. 4 Neutron energy spectrum at the central graphite cavity of UTR-KINKI (lower energy region).
006\7 sandwich foil method by In, Au, Wand Mn, respectively.
--- calculation by the SRAC code system, NEUPAC unfolding.
2:
107-e..
>.
b.O ~
!.il
-5 ~ 106
"2 ~
;::l
~ (!)
0. 105
><
;::l
...
~ 0 ~
104
":j
(!) 104 105 106 107
Z Neutron energy (eV)
Fig. 5 Neutron Energy spectrum at the central graphite cavity of UTR-XINKI (higher energy region).
method is given in Fig. 4, comparing with other results. The uncertainties have been derived from the counting statistics (about 1%). detection efficiency of the Ge-detector (about 3%). the sandwich foil cross section whose error was assumed to be 5%, and de- viation in the reproducibility of the measured data (about 5%). Then, the total- standard deviation is about 8%. The neutron flux values per unit lethargy for four points are close with each other, and they show a good agreement with the calculated spectrum, as seen in Fig. 4.
The neutron spectrum obtained by using the NEUPAC code is shown in Figs. 4 and 5. Their numerical values are attached in the appendix as a table. The uncertainties are about 2.8, 5.1 and 5-10% for thermal, eV-keVand MeV regions. respectively. The present result gives a good agreement with the calculated one and with that by the sand- wich foil method. From the present results obtained, one can recognized that there exists a very good standard l/E neutron field from about 1 eV to a few hundreds keY, at the central cavity of the internal graphite reflector between the two-divided cores of UTR- KINKI.
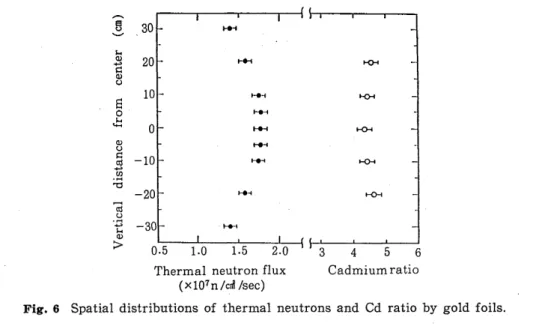
The thermal neutron flux and Cd ratio measured at the central graphite cavity are 1. 78 x 107 n/cm2/sec and about 4.4, respectively. The neutron flux integrated over the thermal neutron energy region from 0.01 to 1 e V appeared in the appendix table is 1.77 X
107 n/cm2/sec. which is in good agreement with the above measurement. The spatial dis- tributions of the thermal neutron flux and the Cd-ratio are illustrated in Fig. 6. The error bars are based on the counting statistics (less than 1%), the detection efficiency (about 1%) calibrated by a gold foil absolutely measured with a 411:/3ry coincidence system, and the systematics (about 1-2%) among the measurements. It can be seen that the spa- tial distributions of thermal neutrons and Cd ratio are uniform and flat in the central graphite region at the cavity .
.-..
!
30 ~s-. Q)
20 t-~ t-()-f
+"
s:: Q)
u
10 -
...
t-()-fS 0
...
J:: 0 ~ K:H
Q)
...
u s:: -10 -
ttl
...
K:H+"
:.a
rn-20 1-. . . t-{H
ttl .~ s-. -30
...
:> Q) 0.5
3 4 5 6
Thermal neutron flux Cadmium ratio (x107n/crd /sec)
Fig. 6 Spatial distributions of thermal neutrons and Cd ratio by gold foils.
KOBAYASHI etc: Measurement of Neutron Flux Spectrum by Multi-Foil Activation . ... . -. Method at the Central Graphite Cavity of UTR-KlNKl
Summary
Through the present measurements and analysis of the neutron spectrum at the cen- tral cavity in the internal graphite reflector between the two-divided cores of UTR-KINKI.
the followings have been deduced:
1) The sandwich foil method has been introduced to measure the epithermal neutron fluxes at 1.46, 4.94, 18.8 and 337 eV, corresponding to the big resonances from In-115 , Au-197, W-186 and Mn-55. These fluxes per unit lethargy are close each other and agree with the calculated -Ones.
2) The NEUPAC code has been employed to unfold the multi-foil activation data.
An excellent agreement can be seen between the obtained spectrum by this measurement and that by the calculation in the whole energy range.
3) It has been finally verified that an uniform neutron flux and an excellent standard liE neutron flux spectrum can be obtained from about 1 eV to a few hundreds keY at the central cavity in the internal graphite reflector of UTR-KINKI. This neutron field is expected to be used for various applications in future.
Acknowledgements
The authors would like to express their sincere thanks to Prof. M. Nakazawa of University of Tokyo for his useful discussion and suggestion on the sandwich foil method and the NEUPAC calculation.
This study was carried out by the Visiting Research Program of the Kinki University Atomic Energy Research Institute under the support and cooperation by the Kinki Uni- versity Research Cooperative Section, Faculty of Engineering, Osaka University.
The authors thank the students who were belonging to the laboratory of one of the authors CR. M) for assistance in carrying out the experiment. They are also indebted to the people who were supporting the experiment and working at the Kinki University Atomic Energy Research Institute.
-REFERENCES-
1) 1. Kimura and K. Kanda: J. Atomic Energy Soc. of Japan, 20 301 (1978) (in Japanese).
2) M. F. Vlasov: Froc. lAEA Consultants' Meeting, Integral Cross Section Measurements in Stan- dard Neutron Fields, lNDC (NDS)-81/L+M, lAEA (1977).
3) J. Grundl and C. Eisenhauer: "Neutron Cross Sections for Reactor Dosimetry", lAEA-208, 1 53 (1978).
4) K. Kobayashi, et al.: Ann. Rep. Res. Reactor Inst. Kyoto Univ., 20 1 (1987).
5) R. Miki, et al.: Ann. Rep. Kinki Univ. Atom. Energy Res. lnst., 23 33 (1986).
6) K. Tsuchihashi, et al.: "SRAC: JAERI Thermal Reactor Standard Code System for Reactor De- sign and Analysis", JAERl 1285 (1983), and Revised SRAC Code System, JAERl 1302 (1986).
7) A. Weitzberg: "Measurements of Epithermal Spectra in Fast Assemblies Using Resonance Sand-
wich Detectors", ANL-7320, p. 535 (1966).
8) M. Nakazawa: "Sandwich Foil Method", KURRI-TR-69, p. 38 (1969) (in Japanese).
9) M. Nakazawa and A. Sekiguchi: Proc. 2nd ASTM-Euratom Symp. on Reactor Dosimetry, NUREG /CP-0004, Vol. 3, p. 1423 (1977).
10) T. Taniguchi, et al.: "Neutron Unfolding Package Code, NEUPAC-83", NEUT Res. Rep. 83-10 (1983).
11) R. Miki, et al.: Ann. Rep. Kinki Univ. Atom. Energy Res. Inst., 24 39 (1987).
12) C. M. Leder and V. S. Shirley (ed.) : "Table of Isotopes", 7-th ed., John Wiley & Sons, Inc., New York (1978).
13) M. Nakazawa: Private communication (1985).
14) R. N. Blomquist, et a1.: "VIM-A Continuous Energy Monte Carlo Code at ANL", ORNL/RSIC- 44, p. 31 (1980).
15) M. Nakazawa, et a1.: J. Fac. Eng., Univ. Tokyo, A-22 44 (1984).
16) R. E. MacFarlane, et a1.: "The NJOY Nuclear Data Processing System, Vo1. 1 and 2", LA-9303- M (1982).
17) K. Kobayashi, et a1.: J. Nucl. Sci. Techno1., 19 341 (1982).
18) K. H. Beckurts and K. Wirtz: "Neutron Physics", Springer-Verlag, New York (1964).
19) K. Kanda, et al.: Ann. Rep. Res. Reactor Inst. Kyoto Univ., 2 18 (1969).
KOBAYASHI etc: Measurement of Neutron Flux Spectrum by Multi-Foil Activation Method at the Central Graphite Cavity of UTR-KINKI
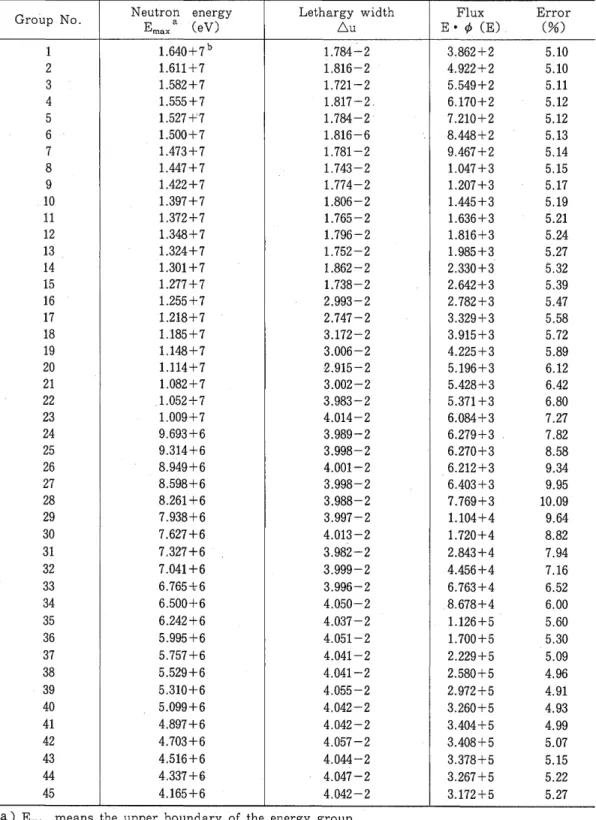
APPENDIX
Table of numerical values of the neutron flux spectrum at the central graphite cavity in UTR- KINKI, obtained by unfolding the multi-foil activation data using the NEUPAC code.
Group No. Neutron energy Lethargy width
Emax a (eV) 6u
1 1.640+7b 1.784-2
2 1.611 +7 1.816-2
3 1.582+7 1.721-2
4 1.555+7 1.817-2,
5 1.527-r:7 1.784-2
6 1.500+7 1.816-6
7 1.473+7 1.781-2
8 1.447+7 1.743-2
9 1.422+7 1.774-2
10 1.397+7 1.806-2
11 1.372+7 1.765-2
12 1.348+7 1.796-2
13 1.324+7 1.752-2
14 1.301 +7 1.862-2
15 1.277 +7 1.738-2
16 1.255+7 2.993-2
17 1.218+7 2.747-2
18 1.185+7 3.172-2
19 1.148+7 3.006-2
20 1.114+7 2.915-2
21 1.082+7 3.002-2
22 1.052+7 3.983-2
23 1.009+7 4.014-2
24 9.693+6 3.989-2
25 9.314+6 3.998-2
26 8.949+6 4.001-2
27 8.598+6 3.998-2
28 8.261 +6 3.988-2
29 7.938+6 3.997-2
30 7.627+6 4.013-2
31 7.327+6 3.982-2
32 7.041 +6 3.999-2
33 6.765+6 3.996-2
34 6.500+6 4.050-2
35 6.242+6 4.037-2
36 5.995+6 4.051-2
37 5.757+6 4.041-2
38 5.529+6 4.041-2
39 5.310+6 4.055-2
40 5.099+6 4.042-2
41 4.897+6 4.042-2
42 4.703+6 4.057-2
43 4.516+6 4.044-2
44 4.337+6 4.047-2
45 4.165+6 4.042-2
a) Emax means the upper boundary of the energy group.
b} Read as 1.640 X 10⁷•
Flux Error
E· if> (E) (%)
3.862+2 5.10
4.922+2 5.10 5.549+2 5.11 6.170+2 5.12 7.210+2 5.12 8.448+2 5.13 9.467 +2 5.14 1.047 +3 5.15 1.207+3 5.17 1.445+3 5.19 1.636+3 5.21 1.816+3 5.24 1.985+3 5.27 2.330+3 5.32 2.642+3 5.39 2.782+3 5.47 3.329+3 5.58 3.915+3 5.72 4.225+3 5.89 5.196+3 6.12 5.428+3 6.42 5.371 +3 6.80 6.084+3 7.27 6.279+3 7.82
6.270+3 8.58
6.212+3 9.34 6.403+3 9.95 7.769+3 10.09 1.104+4 9.64 1.720+4 8.82 2.843+4 7.94 4.456+4 7.16 6.763+4 6.52 8.678+4 6.00 1.126+5 5.60 1.700+5 5.30 2.229+5 5.09 2.580+5 4.96 2.972+5 4.91 3.260+5 4.93
3.404+5 4.99
3.408+5 5.07 3.378+5 5.15 3.267+5 5.22 3.172+5 5.27
Group No. Neutron energy Lethargy width Flux Error
Emax a (eV) 6.u E· ¢ (E) C%)
, 46 4.000+6 7.823-2 3.005+5 5.28
47 3.699+6 7.871-2 2.783+5 5.26
48 3.419+6 7.814-2 2.789+5 5.20
49 3.162+6 7.825-2 3.123+5 5.11
50 2.924+6 7.822-2 4.209+5 4.98
51 2.704+6· 7.844-2 5.436+5 4.85
52 2.500+6 9.651-2 6.592+5 4.72
53 2.270+6 9.659-2 8.163+5 4.61
54 2.061 +6 9.672-2 9.579+5 4.53
55 1.871 +6 9.702-2 1.049+6 4.50
56 1.698+6 9.637-2 1.113+6 4.50
57 1.542+6 9.661-2 1.150+6 4.53
58 1.400+6 9.353-2 1.159+6 4.58
59 1.275+6 9.280-2 1.147+6 4.64
60 1.162+6 9.376-2 1.127+6 4.71
61 1.058+6 9.304-2 1.104+6 4.78
62 9.640+5 9.344-2 1.075+6 4.84
63 8.780+5 9.303-2 1.047 +6 4.89
64 8.000+5 1.151-1 1.021 +6 4.94
65 7.130+5 1.159-1 9.937+5 4.97
66 6.350+5 1.150-1 9.541 +5 5.01
67 5.660+5 1.160-1 9.398+5 5.03
68 5.040+5 1.156-1 9.302+5 5.05
69 4.490+5 1.156-1 9.108+5 5.06
70 4.000+5 1.165-1 8.880+5 5.07
71 3.560+5 1.160-1 8.753+5 5.07
72 3.170+5 ' 1.135-1 8.662+5 5.08
73 2.830+5 1.160-1 8.543+5 5.08
74 2.520+5 1.178-1 8.433+5 5.08
75 2.240+5 1.133-1 8.385+5 5.08
76 2.000+5 1.450-1 8.321 +5 5.08
77 1.730+5 8.439-2 8.321 +5 5.08
78 1.590+5 1.201-1 8.317+5 5.08
79 1.410+5 1.125-1 8.321 +5 5.08
80 1.260+5 1.178-1 8.320+5 5.08
81 1.120+5 1.133-1 8.316+5 5.08
82 1.000+5 2.562-1 8.319+5 5.08
83 7.740+4 2.563-1 8.307+5 5.08
'84 5.990+4 2.554-1 8.317 +5 5.08
85 4.640+4 2.566-1 8.315+5 5.08
86 3.590+4 2.557 -1 8.312+5 5.08
87 2.780+4 2.570-1 8.332+5 5.08
88 2.150+4 2.526-1 8.414+5 5.08
89 1.670+4 2.582-1 8.481 +5 5.09
90 1.290+4 2.546-1 8.521 +5 5.09
91 1.000+4 2.562-1 8.527+5 5.09
92 7.740+3 2.563-1 8.540+5 5.09
93 5.990+3 2.554-1 8.537+5 5.09
94 4.640+3 2.566-1 8.537+5 5.09
95 3.590+3 2.557 -1 8.517 +5 5.09
a) Emax means the upper boundary of the energy group.
KOBAYASHI etc: Measurement of Neutron Flux Spectrum by Multi-Foil Activation . M¢thod at the Central Graphite Cavity of UTR-KINKI .
Group No. Neutron energy Lethargy width Flux Error
Emax a (eV) 6u E· ¢ (E) (%)
96 2.780+3 2.570-1 8.496+5 5.09
97 2.150+3 2.526-1 8.473+5 5.10
98 1.670+3 2.582-1 8.438+5 5.10
99 1.290+3 2.546-1 8.411 +5 5.11
100 1.000+3 2.562-1 8.377+5 5.12
101 7.740+2 2.563-1 8.350+5 5.12
102 5.990+2 2.554-1 8.355+5 5.12
103 4.640+2 2.566-1 8.379+5 5.11
104 3.590+2 2.577 -1 8.482+5 5.10
105 2.780+2 2.570-1 8.451 +5 5.09
106 2.150+2 2.526-1 8.477+5 5.07
107 1.670+2 2.582-1 8.501 +5 5.06
108 1.290+2 2.546-1 8.512+5 5.05
109 1.000+2 2.562-1 8.513+5 5.04
110 7.740+1 2.563-1 8.437+5 5.04
111 5.990+1 2.541-1 8.386+5 5.04
112 4.646+1 2.579-1 8.353+5 5,03
113 3.590+ 1 2.557 -1 8.384+5 5.00
114 2.780+ 1 2.570-1 8.518+5 4.93
115 2.150+ 1 2.526-1 8.607+5 4.80
116 1.670+1 2.582-1 8.710+5 4.57
117 1.290+1 2.546-1 8.807+5 4.23
118 10000+ 1 2.562-1 8.904+5 3.76
119 7.740+0 2.563-1 8.950+5 3.25
120 5.990+0 2.554-1 9.008+5 2.93
121 4.640+0 2.566-1 9.009+5 3.06
122 3.590+0 2.557-1 9.009+5 3.33
123 2.780+0 2.570-1 9.007+5 3.48
124 2.150+0 2.526-1 8.960+5 3.49
125 1.670+0 2.582-1 9.236+5 3.51
126 1.290+0 2.546-1 9.710+5 3.68
127 1.000+0 2.562-1 1.035+6 3.99
128 7.740-1 2.563-1 1.179+6 4.29
129 5.990-1 2.554-1 1.376+6 4.48
130 4.640-1 2.566-1 1.621 +6 4.51
131 3.590-1 2.557-1 1.925+6 4.36
132 2.780-1 2.570-1 2.460+6 4.01
133 2.150-1 2.526-1 3.374+6 3.45
134 1.670-1 2.582-1 4.845+6 2.70
135 1.290-1 2.546-1 7.945+6 2.70
136 1.000-1 2.562-1 1.112+7 2.70
137 7.740-2 2.563-1 1.139+7 2.70
138 5.990-2 2.554-1 1.006+7 2.73
139 4.640-2 2.566-1 8.984+6 2.75
140 3.590-2 2.577-1 8.241 +6 2.78
141 2.780-2 2.570-1 6.584+6 2.80
142 2.150-2 2.526-1 3.945+6 2.82
143 1.670-2 2.582-1 1.577+6 2.83
144 1.290-2 2.456-1 9.455+5 2.83
145 1.000-2
a) Emax means the upper boundary of the energy group,