Effect of lipids on the direct absorption of methyl mercury by lymph and blood
Mika TAKAGI1, Daiki UKIBE1, Kaeko MUROTA1, Takeshi MINAMI1,2*
1 Department of Life Sciences, School of Science & Engineering, and 2 Institute for Science and Technology, Kinki University, 3-4-1 Kowakae, Higashi-osaka, Osaka
577-8502, JAPAN (Received December 1, 2013)
Abstract
We previously reported that mercury was absorbed not only into the portal vein but also into lymph after methyl mercury was infused into the intestine (Murota et al., 2012). Although methyl mercury mixed with saline was administered to rats in the previous report, it is known that methyl mercury is contained in fish and seafood products and is taken up into the body in food. Therefore, the aim of the present study was to identify the effect of various lipids on the direct absorption of methyl mercury by blood and lymph. Methyl mercury was mixed with fish oil, lard, olive oil, soy oil, taurocholate, and saline. When methyl mercury mixed with lipids was administered to rats, the volume of lymph collected every 30 minutes did not differ between Saline and each lipid mixture group, except the Lard group at 90-120 minutes. Mercury concentration per 1 ml of lymph increased in the Fish oil group at 180-210 minutes and the Soy oil group at 270-300 minutes in comparison with the Saline group. However, when the amount of mercury in lymph collected in 30 minutes was calculated from the volume of lymph, there was no difference among groups at all collection times. In addition, the cumulative mercury amount in lymph did not differ among groups at all collection times. Furthermore, there was no difference in blood mercury concentration among groups at all collection times. From the present results, it is concluded that the quantity of lymph and blood absorption of mercury does not differ even if methyl mercury is given with various lipids.
Keywords: methyl mercury, absorption, lymph, blood, taurocholate, fish oil, lard, olive oil, soy oil, saline.
1. Introduction
A large amount of methyl mercury causes environmental pollution, leading to diseases such as Minamata disease, but there is a low level of methyl mercury in our surroundings, and it is taken up by our bodies without our knowledge. Mercury intake from food is 0.3–1.5 μg/kg body weight/week. The food with the largest amount of methyl
mercury is fish and seafood products, and methyl mercury is absorbed 95–
100 % from the intestinal tract (Patrick, 2002). The Joint FAO/WHO expert Committee on Food Additives (JFCFA) (2004) established from the Cohort studies that a tolerable weekly intake was 1.6 μg/kg body weight to protect the fetal central nervous system from methyl mercury because one of the main targets
*Corresponding author
of methyl mercury is the central nervous system, especially the developing brain (Castoldi et al., 2008; Newland et al., 2008). Therefore, the relationship between maternal exposure to methyl mercury and neurodevelopmental effects in their children has been discussed.
Methyl mercury is known to combine with L-cysteine in blood after absorption from the intestinal tract, and the bound form is transported into cells using L-type large neutral amino acid carriers, LAT1 and LAT2, and GSH transporter, and distributed throughout tissues (Clarkson et al., 2007). In addition to its influence on the central nervous system, it is known that methyl mercury acts as a potent immunosuppressor and induces autoimmunity (Pheng et al., 2003;
Hӓggqvist et al., 2005; Coccini et al., 2007; Havarinasab et al., 2007; Tonk et al., 2010). Lymphocyte functions were reported to be inhibited at a dose of 10-7 to 10-8 M methyl mercury, while LD50
for methyl mercury in lymphocytes is 10-6 M, and LD50 in T cells is 2.5-fold higher than in B cells (Havarinasab &
Hultman, 2005).
It is well known that lipids such as long-chain fatty acids, cholesterol, and plasmalogen are directly absorbed by lymph (Minich et al., 1997; Porsgaard et al., 1999; Porsgaard & Høy, 2000; Hara et al., 2003; Wang & Carey, 2003), and recently, it was reported that not only lipid substances but also protein and organic substances such as lactoferrin and quercetin, a major flavonoid in plant foods, are transferred directly into lymph (Kitagawa et al., 2003; Murota & Terao, 2005; Matsumoto et al., 2005).
Furthermore, we previously observed that methyl mercury was directly absorbed by both lymph and veins (Murota et al., 2012). In our previous
report, we administered methyl mercury mixed with saline, but generally, it is thought that methyl mercury in food, especially in fish, is mixed with lipid, protein and so on. Therefore, we thought that it is important to know the effects of lipids on the absorption of methyl mercury by lymph and blood.
2. Materials and Methods Chemicals
Methyl mercury chloride and standard solution of mercury were purchased from Wako Pure Chemicals Co. Ltd. (Osaka, Japan). Sodium taurochloic acid was purchased from Calbiochem (Merck Millipore Co., Tokyo, Japan), olive oil was from Nisshin Oillio Group Ltd.
(Tokyo, Japan), fish oil was from NOF Co. (Kanagawa, Japan), lard was from Oriental Yeast Co. (Tokyo, Japan), soy oil was from Nacalai Tesque Inc. (Kyoto, Japan), and saline was from Otsuka Pharmaceutical Co. (Tokyo, Japan). All other reagents used were of special grade and were obtained from Wako Pure Chemicals Co. Ltd.
Animals
Experiments were carried out on male Wistar/ST rats, 8 weeks old (200-220 g body weight), obtained from Japan SLC Co. (Shizuoka, Japan). The research experimental protocol adhered to the Principals of Laboratory Animal Care in Kinki University. They were given standard rat feed (MF, Oriental Yeast) and tap water ad libitum until the experiment. The animals were kept in a room at 24 ± 1 °C, 60-65 % relative humidity and a 12-h light-dark cycle.
Preparation of methyl mercury solution Methyl mercury chloride was dissolved in 0.05N NaOH solution and mixed with a three-fold volume of saline.
Lipids (fish oil, lard, olive oil, and soy
oil) (120 mg/kg) were mixed with 20mM sodium taurocholic acid and sonicated.
Then, an equal volume of methyl mercury solution was added to the final concentration of 4 mg Hg/ml. For the Taurocholate group, 20mM sodium taurocholic acid without lipid was used, and for the Saline group, saline without lipid and sodium taurocholic acid was mixed with methyl mercury solution.
Thoracic-lymph cannulated rat study
Under pentobarbital anesthesia, thoracic lymph duct cannulation, along with duodenal tubing introduction for sample administration, were performed on rats. The lymph duct was cannulated with vinyl tubing (0.8 mm outside diameter) and poly ethylene tubing (1.2 mm outside diameter) was introduced into the duodenum (ca. 1-2 cm) for infusion of a sample. The rat was placed in a restraining cage and glucose-NaCl isotonic solution (25 g and 4.97 g/l, respectively) was given as drinking water and was infused into the duodenum (1.5 ml/hr) for overnight recovery. One hour prior to sample administration, the drinking solution was removed, and duodenal infusion was carried out at 5 ml/hr with saline. After the lymph was collected for 30 minutes, the rat was then infused with the prepared methyl mercury solution (4 mg Hg/kg) via duodenal tubing as a single pulse infusion, followed by the continuous infusion of saline. Lymph was collected every 30 minutes until 360 min after the infusion of the prepared methyl mercury solution. Circulation blood was obtained from the tail vein using a heparinized capillary tube at each time point.
Measurement of mercury concentration in blood and lymph
Blood was diluted 5-fold immediately
after collection using extra-pure water (Milli-Q; Millipore Japan Ltd., Tokyo, Japan). Twenty microliters of lymph and 10 μl diluted blood were used for mercury analysis. Samples were placed in a combustion tube made of quartz and burned (Barnstead Thermolyne Furnance 1300) to make gold amalgam using vaporization equipment (Mercury Evaporator ME300; Hiranuma Sangyo Co. Ltd., Ibaraki, Japan). A linear standard curve was generated using standard mercury solution in the range of 0 to 4 ng and the detection limit was determined to be 0.087 ng.
Statistical analysis
All data are presented as the means ± S.D. Statistical comparison between different treatments was performed by one-way ANOVA with Scheffe’s multiple comparison tests. Differences with p
<0.05 and p <0.01 were considered significant.
3. Results
The main lipid composition using in the present study was as follows. Fish oil is mainly composed of docoxahexaenoic acid (29 %), oleic acid (23 %), palmitic acid (20 %), and eicosapentaenoic acid (7%), lard is composed of oleic acid (42 %), palmitic acid (26 %), stearic acid (17 %) and linoleic acid (11 %), olive oil is oleic acid (78 %), palmitic acid (11 %), and linoleic acid (11 %), and soy oil is linoleic acid (46 %), oleic acid (39 %), palmitic acid (11 %), and stearic acid (4 %). In addition, fish oil expresses high iodine value showing high amounts of unsaturated fatty acids, while soy oil expresses low iodine value showing high amounts of saturated fatty acids.
Figure 1 shows the volume of lymph fluid every 30 minutes until 360 minutes after administration. When the control
group is the volume of lymph fluid collected 30 minutes before administration, the volume significantly increased in the Saline group 90 minutes after administration, and the peak was obtained at 180-210 minutes. In the Taurocholate group, the volume of lymph increased significantly at 90-120 minutes in comparison with the control group, maintained the same level until 210-240 minutes, and then decreased. In the Olive oil group, the volume of lymph fluid significantly increased in comparison with the control group from 90-120 minutes and maintained this high level until 360 minutes. In the Soy oil group, the volume increased from
150-180 minutes, was maintained until 210-240 minutes, and then decreased. In contrast, the volume did not differ from the control group until 360 minutes in both Fish oil and Lard groups. In addition, after comparing the volume of lymph fluid collected every 30 minutes with the Saline group, the volume was significantly lower at 90-120 minutes in the Lard group than at the same time in the Saline group. No other significant difference was observed between Saline and other groups. However, total lymph volume collected during 360 minutes did not differ among Saline (25.5 ± 1.9 ml), Taurocholate (25.5 ± 3.8 ml), Fish oil (24.5 ± 7.2 ml), Olive oil (27.3 ± 2.3 ml),
Figure 1. Lymph volumes collected at intervals of 30 minutes
Lymph was obtained from the thoracic lymph duct by cannulation and collected every 30 minutes until 6 hours. -30~0: Lymph was collected for 30 minutes before the infusion of methyl mercury solution. Values are expressed as mean ± S.D. (n=6). *p<0.05 and **p<0.01 vs. -30 ~ 0 group.
#p<0.05 vs. same time of Saline group.
lymph volume (ml)
(min) (min) (min)
lymph volume (ml)lymph volume (ml)
0.0 0.5 1.0 1.5 2.0 2.5 3.0 3.5
Saline group
* ** ** ** ** *
0.0 0.5 1.0 1.5 2.0 2.5 3.0 3.5
Taurocholate group
* * * * **
0.0 0.5 1.0 1.5 2.0 2.5 3.0 3.5 4.0
Fish oil group
(min) (min)
(min)
lymph volume (ml)lymph volume (ml)lymph volume (ml)
#
0.0 0.5 1.0 1.5 2.0 2.5 3.0 3.5 4.0
Olive oil group
* * ** ** ** ** * *
**
0.0 0.5 1.0 1.5 2.0 2.5 3.0 3.5
Lard group
0.0 0.5 1.0 1.5 2.0 2.5 3.0 3.5 4.0 4.5
Soy oil group
* * *
Lard (20.0 ± 6.4 ml), and Soy oil (23.8 ± 5.0 ml) groups.
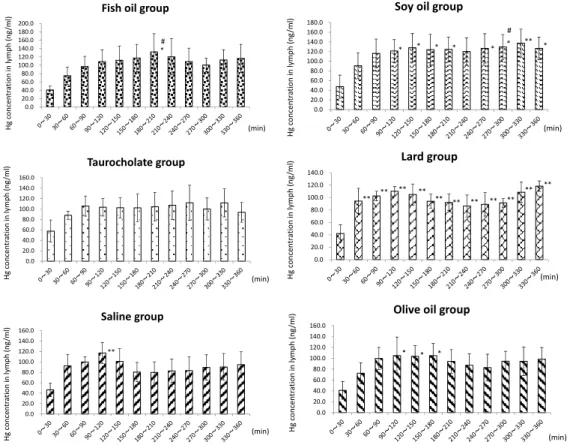
Figure 2 shows mercury concentration in 1 ml lymph. In the Saline group, mercury concentration in lymph peaked at 90-120 minutes and showed a significantly high concentration in comparison with 0-30 minutes. However, in the Taurocholate group, there was no difference in mercury concentration in lymph until 360 minutes after administration, although mercury concentration at each collection time showed no difference between Saline and Taurocholate groups. In the Fish oil group, the peak of mercury concentration was obtained at 180-210 minutes, and the concentration at 180-210 minutes
was higher than at that time in the Saline group. There was no difference in mercury concentration at other collection times between Saline and Fish oil groups.
In the Olive oil group, mercury concentrations at 90-120, 120-150, and 150-180 minutes was higher than at 0-30 minutes, but there was no difference in mercury concentrations at each collection time between Saline and Olive oil groups. In both Lard and Soy oil groups, mercury concentration in lymph showed a biphasic pattern. Mercury concentration showed peaks at 90-120 minutes and 330-360 minutes in the Lard group, and at 120-150 minutes and 300-330 minutes in the Soy oil group. In addition, mercury concentration in the
Figure 2. Mercury concentration in lymph
The lymph volume collected for 30 minutes was measured and 20 μl lymph was used for the measurement of total mercury concentration in lymph. Values are expressed as the mean ± S.D. (n = 6). *p <0.05 and **p <0.01 vs. 0–30 group. #p <0.05 vs. same time in Saline group.
Hg concentration in lymph (ng/ml)Hg concentration in lymph (ng/ml)Hg concentration in lymph (ng/ml)
(min) (min)
(min)
#
0.0 20.0 40.0 60.0 80.0 100.0 120.0 140.0 160.0
Saline group
**
0.0 20.0 40.0 60.0 80.0 100.0 120.0 140.0 160.0
Taurocholate group
0.0 20.0 40.0 60.0 80.0 100.0 120.0 140.0 160.0 180.0 200.0
Fish oil group
*
Hg concentration in lymph (ng/ml)Hg concentration in lymph (ng/ml)Hg concentration in lymph (ng/ml)
(min) (min)
(min)
#
0.0 20.0 40.0 60.0 80.0 100.0 120.0 140.0 160.0
Olive oil group
* * *
0.0 20.0 40.0 60.0 80.0 100.0 120.0 140.0
Lard group
** **
** **
** ** ** ** **
** **
0.0 20.0 40.0 60.0 80.0 100.0 120.0 140.0 160.0 180.0
Soy oil group
** *
* *
* *
* *
Lard group showed significantly high values from 30-60 minutes to 330-360 minutes in comparison with the value at 0-30 minutes. In the Soy oil group, mercury concentration showed a significantly higher value from 90-120 minutes, and the value at 270-300 minutes showed a significant difference from the same time in the Saline group.
Mercury content in lymph fluid collected for 30 minutes is shown in Figure 3. In the Saline group, mercury content increased significantly from 60-90 minutes to 180-210 minutes and the peak was obtained at 90-120 minutes.
In the Taurocholate group, there were significant differences in mercury levels at 180-210 and 210-240 minutes in comparison with 0-30 minutes, but mercury content hardly changed during 90 to 360 minutes. In the Olive oil group,
mercury contents at both 120-150 and 150-180 minutes were significant higher than at 0-30 minutes, and the peak was obtained at 120-150 minutes. In the Fish oil, Lard, and Soy oil groups, there were no differences in mercury content during 30 to 360 minutes in comparison with 0-30 minutes, although the peak was observed at 120-150 minutes.
Furthermore, there were no differences in mercury content at any collection time in each group.
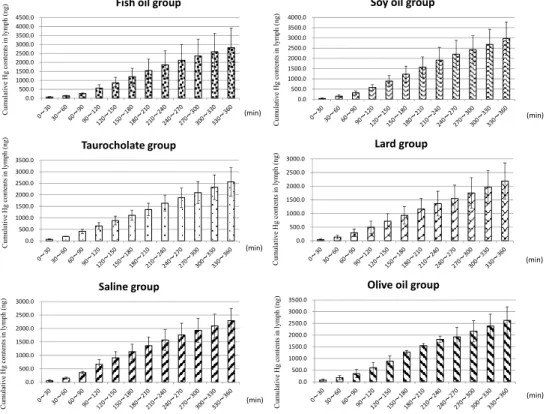
Figure 4 shows cumulative mercury content in lymph during 360 minutes.
Cumulative mercury content increased time dependently in all groups, and cumulative mercury content 360 minutes after administration was 2286 ± 459 ng in Saline, 2564 ± 616 ng in Taurocholate, 2820 ± 1095 ng in Fish oil, 2628 ± 578 ng in Olive oil, 2186 ± 668 ng in Lard,
Figure 3. Absolute amounts of mercury in lymph
The amount of mercury in lymph collected in 30 minutes was calculated from the volume of lymph.
Values are expressed as the mean ± S.D. (n = 6). *p <0.05 and **p <0.01 vs. 0–30 group.
(min)
(min)
(min) Hg ( ng/30 min )Hg ( ng/30 min )Hg ( ng/30 min )
0.0 50.0 100.0 150.0 200.0 250.0 300.0 350.0 400.0
Saline group
* * *
** **
0.0 50.0 100.0 150.0 200.0 250.0 300.0 350.0 400.0
Taurocholate group
* *
0.0 100.0 200.0 300.0 400.0 500.0 600.0
Fish oil group
(min)
(min)
(min) Hg ( ng/30 min )Hg ( ng/30 min )Hg ( ng/30 min )
0.0 50.0 100.0 150.0 200.0 250.0 300.0 350.0 400.0 450.0
Olive oil group
* **
0.0 50.0 100.0 150.0 200.0 250.0 300.0 350.0
Lard group
0.0 100.0 200.0 300.0 400.0 500.0 600.0
Soy oil group
and 2969 ± 810 ng in Soy oil groups, respectively. In addition, the content at each collection time did not differ among groups.
Blood mercury content is shown in Figure 5. Mercury contents 360 minutes after administration at each collection time did not differ among groups. In the Saline group, mercury content increased time dependently and the increase stopped once between 270 and 300 minutes but restarted from 330 minutes.
The increase of blood mercury contents in the Fish oil group showed a similar pattern to the Saline group. However, blood mercury contents in both Taurocholate and Olive oil groups increased time dependently until 360 minutes. The increase of blood mercury contents in the Lard group stopped at
both 180-210 and 240-270 minutes. In the Soy oil group, the increase of mercury content showed a three-stop pattern: 180-210, 270-300, and 330-360 minutes.
4. Discussion
In the natural world, there is no environment in which mercury does not exist. Methyl mercury is biosynthesized from inorganic mercury by microbes and accumulated into fish in a food chain (Yoshida et al., 2013). In addition, it is known that methyl mercury in food is absorbed 95-100 % from the intestinal tract. About 90 % of mercury intake from food is ingested from fish and seafood products (Patrick, 2002), and Yoshida et al. (2013) reported that intake of methyl mercury is controlled when people eat
Figure 4. Cumulative mercury concentration in lymph
The amount of mercury in lymph every 30 minutes was assessed and summed individually for 6 hours. Values are expressed as the mean ± S.D. (n = 6).
(min)
(min)
(min) Cumulative Hg contents in lymph (ng)Cumulative Hg contents in lymph (ng)Cumulative Hg contents in lymph (ng)
0.0 500.0 1000.0 1500.0 2000.0 2500.0 3000.0
Saline group
0.0 500.0 1000.0 1500.0 2000.0 2500.0 3000.0 3500.0
Taurocholate group
0.0 500.0 1000.0 1500.0 2000.0 2500.0 3000.0 3500.0 4000.0 4500.0
Fish oil group
(min)
(min)
(min) Cumulative Hg contents in lymph (ng)Cumulative Hg contents in lymph (ng)Cumulative Hg contents in lymph (ng)
0.0 500.0 1000.0 1500.0 2000.0 2500.0 3000.0 3500.0
Olive oil group
0.0 500.0 1000.0 1500.0 2000.0 2500.0 3000.0
Lard group
0.0 500.0 1000.0 1500.0 2000.0 2500.0 3000.0 3500.0 4000.0
Soy oil group
lots of fish. Does the absorption of methyl mercury change with the type of food even if people eat a large amount of fish? Lipids such as long-chain fatty acids, cholesterol, and plasmalogen are well known to be absorbed by lymph, while almost all substances in food are absorbed through the portal vein. Methyl mercury as a hydrophobic substance is known to be absorbed mainly into blood (Clausing et al., 1984). However, we previously reported that methyl mercury was not only absorbed into portal vein, but also was absorbed directly into lymph. Recently, both lipid substances and protein and organic substances such
as lactoferrin and quercetin have been shown to be transferred directly into lymph (Murota & Terao, 2005).
Therefore, we observed the effect of lipids on the absorption of methyl mercury by lymph and blood using fish oil, olive oil, lard, and soy oil.
The volume of lymph fluid increased after administration and there was no difference in the total volume of lymph fluid during 360 minutes among groups as shown in Fig. 1. The reason why the volume of lymph fluid increased after administration was the increase of osmotic pressure from the absorption of methyl mercury and water used for the
Figure 5. Mercury concentration in blood
Blood was collected from the rat tail vein using a heparinized capillary tube each time and was immediately diluted 5-fold with extra pure water. Ten microliters of diluted blood was used for the measurement of total mercury concentration. Values are expressed as the mean ± S.D. (n = 6).
Hg contents in blood (ng/ml)Hg contents in blood (ng/ml)Hg contents in blood (ng/ml)
0.0 2000.0 4000.0 6000.0 8000.0 10000.0 12000.0 14000.0 16000.0
5 30 60 90 120 150 180 210 240 270 300 330 360
Saline group
0.0 2000.0 4000.0 6000.0 8000.0 10000.0 12000.0 14000.0
5 30 60 90 120 150 180 210 240 270 300 330 360
Taurocholate group
0.0 2000.0 4000.0 6000.0 8000.0 10000.0 12000.0 14000.0
5 30 60 90 120 150 180 210 240 270 300 330 360
Fish oil group
(min)
(min)
(min) Hg contents in blood (ng/ml)Hg contents in blood (ng/ml)Hg contents in blood (ng/ml)
0.0 2000.0 4000.0 6000.0 8000.0 10000.0 12000.0 14000.0
5 30 60 90 120 150 180 210 240 270 300 330 360
Olive oil group
0.0 2000.0 4000.0 6000.0 8000.0 10000.0 12000.0 14000.0
5 30 60 90 120 150 180 210 240 270 300 330 360
Lard group
0.0 2000.0 4000.0 6000.0 8000.0 10000.0 12000.0 14000.0
5 30 60 90 120 150 180 210 240 270 300 330 360
Soy oil group
(min)
(min)
(min)
dilution of methyl mercury solution, as Matsumoto et al. (2010) observed a reduction of the flow rate of lymph within 1 hour after the infusion of organic components. However, it is thought that the different lipids had no effect on the volume of lymph fluid, and there were no differences both mercury concentration per ml and mercury content per 30 minutes in lymph among groups (Figs. 2 & 3). Furthermore, we obtained the same results for blood mercury contents (Fig. 5) as well as in lymph. Fish oil contains many unsaturated fatty acids, while soy oil contains a high amount of saturated fatty acids. However, it is thought that the different lipids mixed with methyl mercury had no effect on the absorption of mercury into lymph and blood, although methyl mercury is hydrophobic.
The Joint FAO/WHO expert Committee on Food Additives (JECFA) (2006) has established that the tolerable
weekly intake is 1.6 μg/kg body weight to protect the fetal central nervous system from methyl mercury. The Food Safety Commission of Japan also established that the tolerable weekly intake for a pregnant woman is 2.0 μg/kg.
In addition, Yoshida et al. (2013) described that the Japanese Ministry of Health, Labour and Welfare had recommended that pregnant women limit their intake of large fish such as bluefin tuna. This advice is appropriate, and it is thought, in our present study, that the absorption rate of methyl mercury does not depend on the type of food even if the concentration of methyl mercury in food influences the absorption amount of methyl mercury.
In conclusion, the absorption of methyl mercury into both lymph and blood is not affected by the type of lipid mixed with methyl mercury, although chronic effect of lipids has to discuss in detail in a near future.
References
Castoldi AF, Johansson C, Onishchenko N, Coccini T et al (2008) Human developmental neurotoxicity of methylmercury: Impact of variables and risk modifiers. Reg Toxicol Pharmacol 51: 201-214
Clarkson TW, Vyas JB, Ballatori N (2007) Mechanisms of mercury disposition in the body. Am J Ind Med 50: 757-764.
Clausing P, Riedel B, Gericke S, Grün G, Müller L (1984) Differences in the distribution of methyl mercury in erythrocytes, plasma, and brain of Japanese quails and rats after a single oral dose. Arch Toxicol 56: 132-13
Coccini T, Randine G, Castoldi AF, Acerbi D, Manzo L (2007) Methylmercury interaction with lymphocyte cholinergic muscarinic receptors in developing rats.
Environ Res 103: 229-237
Häggqvist B, Havarinasab S, Björn E, Hultman P (2005) The immunosuppressive effect of methylmercury does not preclude development of autoimmunity in genetically susceptible mice. Toxicology 208: 149-164
Hara H, Wakisaka T, Aoyama Y (2003) Lymphatic absorption of plasmalogen in rats.
Br J Nutr 90: 29-32
Havarinasab S, Hultman P (2005) Organic mercury compounds and autoimmunity.
Autoimmu Rev 4: 270-275
Havarinasab S, Björn E, Nielsen JB, Hultman P (2007) Mercury species in lymphoid and non-lymphoid tissues after exposure to methyl mercury: Correlation with autoimmune parameters during and after treatment in susceptible mice. Toxicol Appl Pharmacol 221: 21-28
JECFA. Methylmercury (2004) In: Safety evaluation of certain food additives and contaminants. Report of the 61th Joint FAO/WHO Expert Committee on Food Additives. Geneva, World Health Organization, International Programme on Chemical Safety. WHO Technical Report Series 922: 132-139 http://whglibdoc.who.int/trs/WHO_TRS_922.pdf
JECFA (2006) Methylmercury. In: Evaluation of certain food additives and contaminants. Report of the 67th Joint FAO/WHO Expert Committee on Food Additives. Rome, World Health Organization, International Programme on Chemical Safety. WHO Technical Report Series 940: 53-61 http://whglibdoc.who.int/trs/WHO_TRS_940_eng.pdf
Kershaw TG, Clarkson TW, Dhahir PH (1980) The relationship between blood levels and dose of methylmercury in man. Arch Environ Health 35: 28-36.
Kitagawa H, Yoshizawa Y, Yokoyama T et al (2003) Persorption of bovine lactoferrin from the intestinal lumen into the systemic circulation via the portal vein and the mesenteric lymphatics in growing pigs. J Vet Med Sci 65: 567-572
Minich DM, Vonk RJ, Verkade HJ (1997) Intestinal absorption of essential fatty acids under physiological and essential fatty acid-deficient conditions. J Lipid Res 38:
1709-1721
Matusmoto M, Chiji H, Hara H (2005) Intestinal absorption and metabolism of a soluble flabonoid, alpha G-rutin, in portal cannulated rats. Free Radic Res 39:
1139-1146
Matsumoto M, Hosokawa M, Matsukawa N et al (2010) Suppressive effects of the marine carotenoids, fucoxanthin and fucoxanthinol on triglyceride absorption in lymph duct-cannulated rats. Eur J Nutr 49: 243-249
Murota K, Terao J (2005) Quercetin appears in the lymph of unanesthetized fats as its phase II metabolites after administered into the stomach. FEBS Lett 579:
5343-5346
Murota K., Yoshida M., Ishibashi N., Yamazaki H., Minami. Direct absorption of methyl mercury by lymph. Biological Trace Element Research, 145 (3), 349-354 (2012).
Newland MC, Paletz EM, Reed MN (2008) Methylmercury and nutrition: Adult effects of fetal exposure in experimental models. NeuroToxicol 29: 783-801
Patrick L (2002) Mercury Toxicity and antioxidants: Part I: Role of glutathione and alpha-lipoic acid in the treatment of mercury toxicity. Altern Med Rev 7: 456-471 Pheng S-R, Auger C, Chakrabarti S, Massicotte E, Lamontagne L (2003) Sensitivity to
methylmercury-induced autoimmune disease in mice correlates with resistance to apoptosis of activated CD4+ lymphocytes. J Autoimmun 20: 147-160
Porsgaard T, Straarup EM, Høy C-E (1999) Lymphatic fatty acid absorption profile during 24 hours after administration of triglycerides to rats. Lipids 34: 103-107 Porsgaard T, Høy C-E (2000) Lymphatic transport in rats of several dietary fats
differing in fatty acid profile and triacylglycerol structure. J Nutr 130: 1619-1624
Tonk ECM, de Groot MG, Penninks AH et al (2010) Developmental immunotoxicity of methylmercury: The relative sensitivity of developmental and immune parameters. Toxicol Sci 117: 325-335
Yoshida M, Kubo R, Sanhazama C, Suzuki S, Kudou A, Hachiya N, Yasutake A (2013) Hair mercury levels and fish/seafood consumption among Hachinohe City residents. Biomed Res Trace Elements 24: 170-175
Wang DQ-H, Carey MC (2003) Measurement of intestinal cholesterol absorption by plasma and fecal dual-isotope ratio, mass balance, and lymph fistula methods in the mouse: an analysis of direct versus indirect methodologies. J Lipid Res 44:
1042-1059