1
Title of Thesis
Study on Audiovisual Interaction in Visual Detection and Discrimination by Behavioral
and Event-related Potential Experiments
2018 September
Fengxia Wu
The Graduate School of Natural Science and Technology
(Doctor’s Course)
OKAYAMA UNIVERSITY
2
I
Abstract
Sensory perception consists of the detection of salient events in space and time as well as the discrimination with regard to specific features in events, and recognition. In traditionally viewing, detecting the presence of an object is a different processing than identifying the object as a particular object. However, recently, in the literature on visual categorization, researchers have reached controversial conclusions such as “as soon as you know it is there, you know what it is” or that “as soon as you know an object is there, you do not know what it is”. Additionally, people obtain dynamic effective information from the complex environment through multiple senses in everyday life.
Audition also is one important sensory system that human use to perceive the environment. The brain handles multiple sensory signals (80% were vision and audio) automatically and effortlessly to provide a more accurate message in order to shape and guide our behavior. Therefore, it is important to study interaction across audiovisual sensory modalities. However, the neural mechanism of audiovisual interaction is not completely clear at all. Besides, how visual stimulus (feature of spatial frequency and contrast, or visual intensity) alter audiovisual interaction is also unknown. The aim of the present study was to clarify how our brain processes audiovisual information in different perception stage and whether the processing of different visual stimulus affect audiovisual interaction.
Firstly, to clarify whether visual detection and visual discrimination depend on same mechanism, a visual detection and visual orientation discrimination task were used to test the visual threshold with different spatial frequency. Our results showed that there were no significant different in threshold between visual detection and visual discrimination, whereas the response time for visual detection were faster than that for visual discrimination. These results suggesting that the perceptual of detection and perception might rely on partially separate mechanisms.
Secondly, to investigated whether audiovisual interaction is different for different perceptual processing, a visual detection and visual identification task with/without a
II
task-irrelevant auditory stimulus were conducted to examine the effect of experimental task on audiovisual interaction, and the difference between different spatial frequency.
The results confirmed that the response for visual discrimination was slowed, and task- irrelevant auditory stimulus speedup visual response in both visual detection and visual discrimination (so called “audiovisual interaction”), and the magnitude of audiovisual interaction were same for all spatial frequency in each task due to high contrast.
However, audiovisual interaction in visual detection were larger than that for visual discrimination. Our results provided empirical evidence that complex of perceptual processing would affects audiovisual interaction.
Thirdly, to further clarify the effect of visual spatial frequency on audiovisual interaction, the visual detection task with/without a task-irrelevant auditory stimulus was performed. The results showed that spatial frequency modulates auditory facilitation of visual detection at low contrast (20%) but not at high contrast (100%).
Moreover, the data revealed that audiovisual interaction was larger for low (0.54 cycles/degree) and high (6.46 cycles/degree) spatial frequencies than for a medial spatial frequency of 0.70 cycles/degree (all p < 0.05). However, when the visual stimulus was adjusted to the same perceived intensity for each spatial frequency by changing contrast, no significant difference was found among the different spatial frequencies (p > 0.05). The current results suggested that the stimulus intensity of a visual stimulus is the key factor for audiovisual interaction.
Lastly, to investigate the neural mechanism of visual intensity on audiovisual interaction, a visual orientation discrimination task with/without a task-irrelevant auditory stimulus were performed using event-related potential (ERP) method.
Consisted with our previous study, behavioral results showed that task-irrelevant auditory stimulus facilitated visual discrimination, suggesting audiovisual interaction occurred. The ERP results showed that in the low intensity (3.47 c/d) condition existing the earliest integration (50-90 ms) in the left posterior region, and this audiovisual interaction was delayed from auditory cortex (50-90 ms) to visual cortex (70-90 ms), suggesting that auditory enhanced low intensity visual perception via direct or indirect connectivity from auditory cortex to visual cortex during early stage(cortico-cortical).
III
Moreover, the audiovisual interaction over fronto-central area were delayed with decreasing visual intensity (230-260 ms, 240-300 ms and 280-320 ms for the intensity of 1.00, 1.86 and 3.47 c/d). In addition, audiovisual interaction over parietal-occipital area were delayed with decreasing visual intensity (310-500 ms, 390-500 ms and 480- 500 ms for the intensity of 1.00, 1.86 and 3.47 c/d). These results suggested that the audiovisual interaction pattern was depended on stimulus intensity, and further revealed a delayed audiovisual interaction resulting from the slowed visual processing.
According to the current situation, future studies will focus on special populations (e.g.
older people, patients with headache, mild cognitive impairment, alzheimer's disease, and schizophrenia) to uncover the neural mechanism of audiovisual integration and to provide important basis for the early clinical detection and rehabilitation of special brain disease.
IV
I
Table of Contents
Abstract ...I
Chapter 1 Introduction ... 1
1.1 Visual perception ... 2
1.2 Audiovisual interaction ... 3
1.3 Event-related potentials (ERPs) ... 5
1.3.1 Event-related potentials (ERPs) ... 5
1.3.2 Analysis method of ERPs data in the audiovisual interaction study ... 6
1.4 The purpose of the present dissertation... 8
1.5 The contents of the dissertation ... 8
Chapter 2 Spatial frequency processing in visual detection and discrimination task ... 10
2.1 Background ... 11
2.2 Methods ... 12
2.2.1 Participants ... 12
2.2.2 Stimuli ... 12
2.2.3 Procedure ... 13
2.2.4 Apparatus ... 14
2.2.5 Data analysis ... 15
2.3 Results ... 15
2.4. Discussion ... 18
2.5. Conclusions ... 20
Chapter 3 Visual discrimination task attenuates audiovisual interaction regardless of spatial frequency ... 21
3.1 Background ... 22
3.2 Methods ... 24
3.2.1 Participants ... 24
3.2.2 Stimuli ... 24
3.2.3 Procedure ... 25
3.2.4 Data analysis ... 26
3.3 Results ... 27
3.4 Discussion ... 30
3.5 Conclusions ... 33
Chapter 4 Visual intensity-dependent modulation: Effect of spatial frequency on audiovisual interaction in visual detection task ... 34
4.1 Background ... 35
4.2 The effect of spatial frequency on audiovisual interaction in a high contrast condition ... 36
II
4.2.1 Methods ... 37
4.2.2 Results ... 40
4.2.3. Discussion ... 41
4.3 The effect of spatial frequency on audiovisual interaction in a low contrast condition ... 42
4.3.1 Methods ... 43
4. 3.2 Results ... 43
4. 3.3. Discussion ... 45
4.4 The effect of spatial frequency on audiovisual interaction in same intensity condition ... 47
4. 4.1 Methods ... 47
4. 4.2 Results ... 49
4. 4.3. Discussion ... 50
4.5 General discussion ... 51
4.6. Conclusions ... 53
Chapter 5 Effects of visual intensity on audiovisual interaction in discrimination task: an event-related potential study ... 54
5.1 Background ... 55
5.2 Methods ... 56
5.2.1 Participants ... 56
5.2.2 Stimuli ... 56
5.2.3 Procedure and task ... 56
5.2.4 Apparatus ... 58
5.2.5 Data analysis ... 58
5.3. Results ... 60
5.3.1 Behavioral results ... 60
5.3.2 ERP results ... 61
5.4. Discussion ... 66
5.5 Conclusions ... 70
Chapter 6 General conclusion and future projections... 71
6.1 General conclusions ... 72
6.2 Future projections ... 74
Appendix ... 75
Ⅰ Simple introduction of EEG and B++apparatus ... 75
Ⅱ ERP data in Experiment 4 (chapter 5) ... 79
Publications ... 82
Acknowledgements ... 84
References ... 85
Chapter 1 Introduction
1
Chapter 1 Introduction
Summary
This chapter introduces the concept of visual perceptual processing and audiovisual interaction. The previous studies of audiovisual interaction in different brain areas have also been summarized here. The technique of electroencephalogram (EEG) and event- related potential (ERP) have been introduced. At last, the purpose and contents of the thesis are briefly explained.
Chapter 1 Introduction
2
1.1 Visual perception
Sensory perception comprises the detection of salient events in space and time as well as their discrimination with regard to specific features or configural properties and recognition. In traditionally viewing, detecting the presence of an object is a different processing than identifying the object as a particular object. Visual perception of an object is instantly connected with an idea of what we see, but sometimes we might make a mistake and sometimes we just have the impression that there was something. Specially, in the literature on visual categorization, researchers have reached controversial conclusions such as “as soon as you know it is there, you know what it is” [1] or that “as soon as you know an object is there, you do not know what it is” [2].
Kalanit et al. (2005) have found that subjects performed just as quickly and accurately on the categorization task as they did on a task requiring only object detection: By the time subjects knew an image contained an object at all, they already knew its category.
Moreover, Functional magnetic resonance imaging (fMRI) have showed that visual detection and visual identification have same visual activity over visual primary cortex.
Therefore, it is reasonable that as soon as you know it is there, you know what it is.
In the other hand, fMRI studies have reported partly separated cortical mechanism for object detection and identification and the mere detection of an object is easier than its full identification [3]. The importance of this distinction is underlined by a behavioral study, showed that discrimination performance curve and aware detection curve are different relay on whether feature have been identified during perceptual [4]. Additionally, electrophysiological studies further investigated the different correlated of awareness for detection and identification, and aware detection of object’s presence has an earlier and more posterior than aware identification of the object [5]. Therefore, it is possible that as
Chapter 1 Introduction
3
soon as you know an object is there, you do not know what it is. Thus, the problem arises from the question of where object detection end and identification start.
1.2 Audiovisual interaction
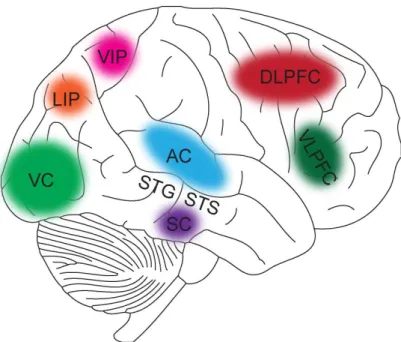
To achieve a comprehensive picture of the external world in everyday life, the brain integrates information from multiple senses. Audition and vision are two important sensory systems that humans use to perceive the environment, as 80% information was received by auditory and visual systems. The main region of the brain in which audition is perceived is the auditory cortex (AC), and the main area of the brain in which vision is perceived is the visual cortex (VC) (see figure 1.1) [6]. Although input signals about the same external environment during normal daily activities transmit through different models into the different cortical representations, these two sensory signals are automatically and effortlessly bound to provide a more accurate spatial and temporal information, in order to shape and guide our behavior. This binding process between auditory and visual signals, called audiovisual interaction.
Audiovisual interaction has been demonstrated occurred at superior temporal sulcus in both animal and human. M. A. Meredith et al. (1978) M. S. Beauchamp et al. (2005) have reported that audiovisual interaction is not merely the linear combination of two unimodal information in the superior temporal sulcus [7, 8]. Sometimes much greater than the mere sum of the individual unisensory response, related research has used the fMRI showed dramatic activity in the superior temporal sulcus (AV > A +V)[9]. They have scanned the brain activity of the subjects when responding to auditory (sounds), visual (mouth movements), or audiovisual stimuli (simultaneous sounds and mouth movements
Chapter 1 Introduction
4
separately. And found that the brain activity AV stimulus was stronger than that for (A+V).
Alternatively, related research has used the fMRI also showed dramatic activity for AV stimulus was weaker than that for (A+V) in the superior temporal sulcus (AV < A +V) [10].
Figure 1.1 Audio-visual processing in different brain areas.
Besides superior temporal sulcus, previous studies have shown that audiovisual interaction also occurs in the auditory cortex (AC, which also receives visual inputs) [7], the visual cortex (VC, which also receives auditory inputs) [9], the ventral intraparietal area (VIP, where neurons respond to visual and auditory events), an area for three- dimensional integration [11], and a lateral intraparietal area (LIP, where have been reported respond to visual and auditory events) belonging to the visual cortex [12].
According to the investigations of multisensory integration in cat, Meredith et al. (1987, 1986) found that the superior colliculus (SC, mainly involved in eyes movement) can
Chapter 1 Introduction
5
receive auditory and visual signals and demonstrated that the two types of signals can active the same neuron when they are presented in the same place [13, 14]. MEG studies have reported that the superior temporal gyrus (STG), a auditory processing area, also has involved in audiovisual interaction [15]. Moreover, current research have indicate that the superior temporal sulcus (STS) contains the region involved in audiovisual interaction [6, 16-18]. Senkowski et al. (2007) have examined the an super-additive BOLD activation in the STS and showed that the subjects elicited BOLD activation to audiovisual stimuli greater than the sum of BOLD activation to individual auditory or visual stimuli [19].
Barraclough et al. studied audiovisual integration by examining the neural level of non- human primates, and they found that the sound of actions modified 23% of the visual response of the STS neurons coding the sight of actions [18]. In addition, Dorsal Lateral Prefrontal Cortex (DLPFC) which is in charging of attention, have been found response to audiovisual stimuli [20, 21]. Ventral Lateral Prefrontal Cortex (VLPFC), which is in charging of working memory, also have been indicated respond to audiovisual stimuli [22]
(see Figure 1.1).
1.3 Event-related potentials (ERPs)
1.3.1 Event-related potentials (ERPs)
ERPs are measured by means of electroencephalography (EEG), EEG recordings show the overall activity of the millions of neurons in the brain. The recording shows fluctuations with time that are often rhythmic in the sense that they alternate regularly.
The EEG patterns change when external stimuli (such as sounds or pictures) are presented, whereas ERPs is the measured brain response that is the direct result of a specific sensory,
Chapter 1 Introduction
6
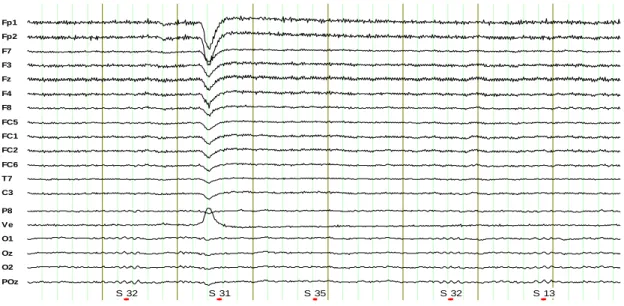
cognitive, or motor event by non-invasive method. The transient electric potential shifts (so-called ERP components) are time-locked to the stimulus onset with the present trigger to marking the onset time (Figure 1.3). Each component reflects brain activation associated with one or more mental operations. Contrasting with behavioral measures such as response times, ERPs are characterized by simultaneous multi-dimensional online measures of polarity (negative or positive potentials), amplitude, latency, and scalp distribution. Therefore, ERPs can be used to identify and distinguish neural and psychological sub-processes involved in perceptual, motor, or cognitive tasks.
Figure 1.3 Schematic of the ERP data
1.3.2 Analysis method of ERPs data in the audiovisual interaction study
The ERPs elicited by the task-irrelative stimuli were analyzed. The data were band-pass filtered from 0.01 - 60 Hz during recording at a sample rate of 500 Hz. The data were divided into epochs, from 100 ms before to 600 ms after the stimulus onset, and baseline
Fp1 Fp2 F7 F3 Fz F4 F8 FC5 FC1 FC2 FC6 T7 C3 Cz C4 T8 He CP5 CP1 CP2 CP6 M 2 P7 P3 Pz P4 P8 Ve O1 Oz O2 POz
S 2
S 32 S 31S 2 S 35S 1 S 32S 2 S 13S 2 S 33S 1 S 31S 2
Fp1 Fp2 F7 F3 Fz F4 F8 FC5 FC1 FC2 FC6 T7 C3 Cz C4 T8 He CP5 CP1 CP2 CP6 M 2 P7 P3 Pz P4 P8 Ve O1 Oz O2 POz
S 2
S 32 S 31S 2 S 35S 1 S 32S 2 S 13S 2 S 33S 1 S 31S 2
Chapter 1 Introduction
7
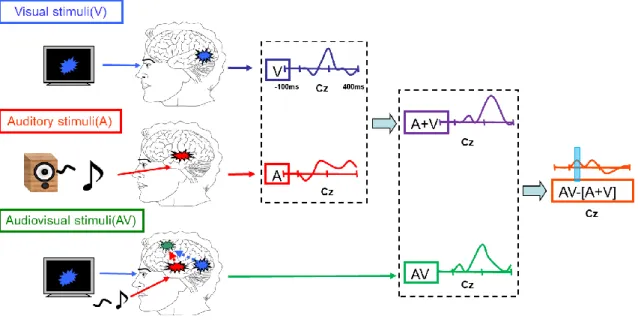
corrections were made against a 100 ms to 0 ms time interval before stimuli onset. Trials with a voltage exceeding ± 100 mV relative to baseline were rejected automatically from the analysis. In addition, the data associated with a false alarm were excluded. The data were then averaged for each stimulus type, following digital filtering with a band-pass filter of 0.1 - 30 Hz, and the grand-averaged data were obtained across all participants for each stimulus type (V, A and AV) in each electrode. The previous studies showed that audiovisual integration was assessed by the difference wave [AV - (A+V)], obtained by subtracting the sum of the ERP waves of the unimodal stimuli from the ERP waves of the bimodal stimuli [23, 24], and the logic of this additive model is that the ERPs to bimodal (AV) stimuli are equal to the sum of the ERPs to the unimodal (A+V) stimuli, plus the putative neural activities specifically related to the bimodal nature of the stimuli. If there is significant difference between AV and (A+V), the interaction between vision and auditory is occurred (Figure 1.4).
Figure 1.4 Analysis methods of ERPs data in the audiovisual integration study
Chapter 1 Introduction
8
1.4 The purpose of the present dissertation
The aim of this thesis studies was to investigate the brain activities of cross-modal audiovisual interaction using behavioral and electroencephalography (EEG) with high temporal resolution and to elucidate the mechanism of audiovisual interaction in different perceptual processing stage.
1.5 The contents of the dissertation
This dissertation mainly investigates brain mechanisms of audiovisual interaction with visual detection and visual discrimination tasks. In addition, further clarify the effect of visual feature on audiovisual interaction with vary spatial frequency.
Chapter 1 introduces the concept of audiovisual interaction in the brain, related previous studies, Electroencephalogram (EEG) analysis, and the method of event-related potential (ERP) analysis in audiovisual interaction studies. The aim and contents of the thesis are also briefly described.
Chapter 2 describes the first experiment. To clarify whether visual detection and visual discrimination depend on same mechanism. The present study investigates the perceptual of detection and perception might rely on partially separate mechanisms.
Chapter 3 describes the second experiment. The effects of perceptual complex on audiovisual interaction. Visual detection and visual discrimination task in audio-visual environment were designed. Audiovisual interaction was compared the between visual detection and visual discrimination using auditory facilitation effect.
Chapter 4 describes the third experiment. In this experiment, audiovisual interaction elicited by vary spatial frequency in visual detection task was investigated, auditory
Chapter 1 Introduction
9
facilitated visual detection depended on visual intensity.
Chapter 5 describes the fourth experiment. In this experiment, audiovisual integration elicited by stimuli intensity was investigated using behavioral and electrophysiological measurements in visual discrimination task.
Chapter 6 provides a general conclusion based on the findings of the four experiments and future challenges.
Chapter 2 Perception-related visual spatial frequency processing:
a behavioral study
10
Chapter 2 Spatial frequency processing in visual detection and discrimination task
Summary
Although previous studies have demonstrated visual processing in detection and discrimination task in human, how detection and discrimination task alter visual processing has not yet been completely elucidated. To investigate this issue, we design performing two classical perceptual tasks: grating detection and grating orientation discrimination. In grating detection, participants were instructed to identify stimulus, if they saw a stimulus, by pressing right button as quickly and accurately as possible. In grating orientation discrimination, participants were told to identify the orientation of the stimulus and pressed relevant button as quickly and accurately as possible. We assessed the diversity by measuring the magnitude of sensitivity and intercepts through reaction times (RT). The results showed that RT strongly depended on experimental task. The response to discrimination task is significantly slower than that for detection task (p < 0.05). However, visual detectability was not depended on experimental task, and no significant difference of sensitivity was found among detection task and discrimination task (p > 0.05). Our results provide unique insight into how the brain processes visual signal of different experimental task.
Chapter 2 Perception-related visual spatial frequency processing:
a behavioral study
11
2.1 Background
Human visual system is more sensitive to contrast than absolute luminance and perceive the world similarly regardless of the huge changes in illumination over the day or from place to place. Contrast has long been known to lead to visual changes. The spatial frequency is a characteristic of any structure that is periodic across position in space, it also been known related to visual changes. Previous studies have showed that orientation have effect on contrast detection [25]. Neurons in primary visual cortex of cats and monkeys respond selectively to the orientation of grating stimulus, showed that neurons are capable of signaling orientation differences [26]. However, these experiments were restricted to high contrast grating stimulus. For low visual contrast, it is suggested the orientation didn’t alter detectability when the changed of orientation was less than 10 degree [27]. In addition, some studies have found that primary visual cortex is required for detection and discrimination of visual features [28, 29], whereas others argue that primary visual cortex is required for discrimination but not detection [30], and yet others identified only subtle changes in visual acuity [31, 32]. Human behavioral studies also reported that detection and discrimination have different effect on visual grating processing [33]. These studies suggested that visual processing was related to experimental task. However, it is not completed clear whether and how experimental task influence the visual processing in human. The aim of present study is to investigate how experimental task influence human visual contrast and spatial frequency (SF) processing. Visual detection task and visual discrimination task were used to measure visual processing. RT to visual stimuli is determined by contrast level and SF [34]. The decreasing of RT to increments in contrast is well accounted for by the Pieron function in Eq. 1 [35, 36].
RT = 𝑘 × 𝑐−𝛼 + 𝑡0 (2.1)
Chapter 2 Perception-related visual spatial frequency processing:
a behavioral study
12
In this case, 𝛼 and k modulate the decay of the RTs caused by stimulus-dependent variables, in many cases it is possible to assuming an 𝛼 exponent of -1, which is a particular case of the general function often applied in visual psychophysics. The slope k can be interpreted as the gain rate for the presence stimulus (1/ k is meaning for sensitivity). t0 represents the asymptotic RT, which reflects a time constant that includes processing latencies intrinsic of sensory pathway and motor time of the effector system.
According to the visual literature, k has been shown to modulated by the different contrast and SF [36]. In present study, we used this framework to investigate how experimental task modulates processing of visual stimulus.
2.2 Methods
2.2.1 Participants
Five students from Okayama University take part in this experiment, and the age is range from 22 to 24 years (mean age 23.2 years). Participants had normal or corrected- to-normal vision and normal hearing capabilities and right-handed, and they have provided written informed consent for their participation in this experiment, which was previously approved by the ethics committee of Okayama University.
2.2.2 Stimuli
Stimulus was a rectified Gabor patches with vertical sinusoidal grating, the size of visual stimulus was approximately 5° diameter (43.7 mm) and presented at center.
There were seven kinds of Gabor patches was SF of 1.00 and 6.46 cycles/degree with different contrast which was range from 1% to 4% and from 3% to 20% in the units of Michelson contrast ((max - min)/ (mix + min)), respectively. The max and min being maximal and minimal value of the Gabor patch, and different contrast values were equally likely. Two fixation point were black circles with 2.2 × 2.2 mm, presented at
Chapter 2 Perception-related visual spatial frequency processing:
a behavioral study
13 below and upper 5° from the center.
2.2.3 Procedure
The experiment was performed in a dark, sound-attenuated and electrically shielded room (laboratory room, Okayama University, Japan). Participants sat on a comfortable chair with their head fixed by a chin-rest. Each participant completed eight blocks with two different tasks. The two tasks were measured in a random order as generated a by randomizing function.
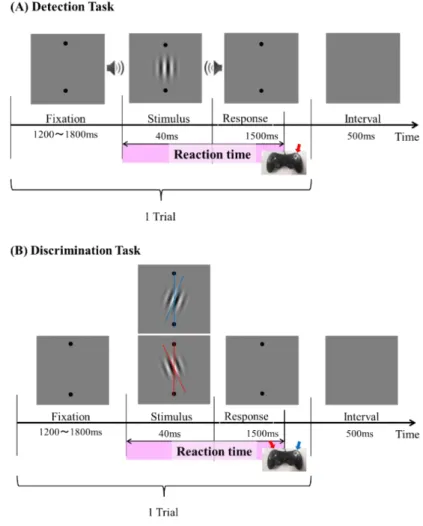
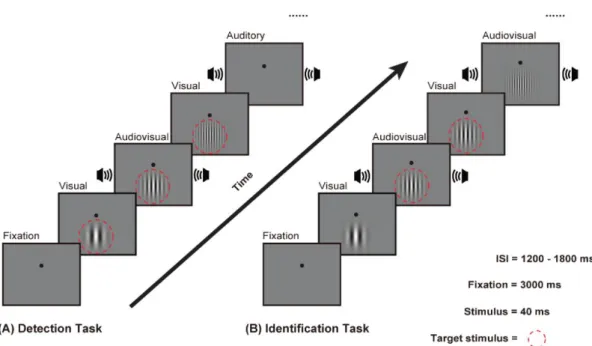
Figure 2.1 Experimental design. (A) Schematic representation of detection task for one trial sequence. Subjects sat approximately 70 cm from the screen. The subjects keep eyes on
center. Stimulus were presented in the front screen and presented 40 ms. There were seven kinds of visual contrast range from 0.8 % to 4%. The participant’s task was to make a
Chapter 2 Perception-related visual spatial frequency processing:
a behavioral study
14
speeded button (right) response when stimuli were presented as quickly and accurately as possible. (B) Schematic representation of Discrimination task for one trial sequence. The participant’s task was to identify the orientation of stimulus were deflection on the right (by pressing the right button) or the left (by pressing the left button) as quickly and accurately as
possible.
Each block consisted of 70 stimuli, all the stimuli were presented randomly, and each stimulus was presented 40 ms, and the inter-stimulus interval ranged from 1 200 ms to 1 800 ms. At the begin, it would duration 1 750ms before the first stimuli appeared.
They were asked to maintain pay attention to the fixation point (center from two points).
Practice blocks were run as longer as participants discriminate the target stimuli and understand the task, usually about 3 min. Regardless of the subject had responded to the stimulus or not, program will continue with the next trial at the set ISI time (1 500ms). Participants were given three minutes to relax after each block to make data accurately.
Detection Task (Figure 2.1 A): there were four blocks for detection task. In these blocks, the orientation of visual stimulus was always vertical, the participants were instructed to identify stimulus, if they saw a stimulus, pressed right button as quickly and accurately as possible. Discrimination Task (Figure 2.1 B): there were also four blocks. In these blocks, there are two orientations of +10° or -10° defected from vertical.
The participants were told to identify the orientation of the stimulus. When stimulus was deflected 10° to right, by pressing the right button as quickly and accurately as possible; and when stimulus was deflected 10° to left, pressing the left button as quickly and accurately as possible.
2.2.4 Apparatus
The stimuli were generated and controlled using MTLAB with Psychophysics
Chapter 2 Perception-related visual spatial frequency processing:
a behavioral study
15
Toolbox for Windows 7 and displayed on a revised linearized CRT (100 Hz,1 024 × 1 024, mean luminance 20 cd/m2 and maximum luminance 116 cd/m2) situated 70 cm in the front of the participant’s eyes.
2.2.5 Data analysis
Hit rate and RTs for different condition were computed. Hit rate was the number of correct reflects to target stimuli divided by the total number of target stimuli. At first, the data of RT were calculated by subject’s response time for the correct responses stimuli. These results were analyzed using a repeated-measures analysis of variance with the task type (detection and discrimination) as subject factors. Secondly, we tested the Pieron function by Eq. 1, and curves were fitted to the data using a maximum likelihood estimate of k and t0. A 2 Task type (Det., Dis.) × 2 SF (1.00, 6.46) repeated- measures analysis of variance with the parameters of k and t0. The level of significant was fixed s at corrected p <0.05.
2.3 Results
RTs and Hit rate: A 2 Task type (Det., Dis.) ×8 Contrast level (C1 – C8) ANOVA for hit rates of 1.00 were statistically expressed as no main effect of the factor of task type, [F (1, 4) = 4.84; p = 0.093], showed that the detectability was not changed by task. The main effect for contrast was significant, [F (7, 28) = 201.79; p < 0.001], showed the detectability was increased with contrast. A Task type (Det., Dis.) ×8 Contrast level (C1 - C8) mixed model ANOVA analyzed the RT for 1.00 to stimuli showed a main effect of the factor of task type, [F (1, 79) = 276.00; p < 0.001], suggested that response times to detection task was faster than that for discrimination task. The main effect of contrast also significant, [F (1, 79) = 609.73; p < 0.001], showed that responses times to high contrast was significant faster than that to low contrast in both detection task and
Chapter 2 Perception-related visual spatial frequency processing:
a behavioral study
16
discrimination task, see Figure 2.2. As there were similarly results for spatial frequency of 6.46, we will further test the diversity by Perion function.
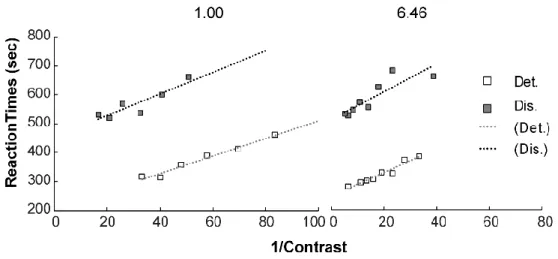
Figure 2.2. Response times as a function of the reciprocal of contrast (1/C) for each SF (from left to right) and experimental task combination (plotted in different shades of gray) in one subject. Small symbols represent the means of each condition. Lines represent the linear least-squares regression fits for experimental task. It can be appreciated that that the slope of
these fits (k parameter) is shallower in the high SF condition.
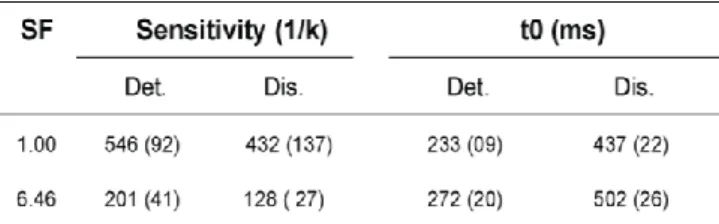
K and t0: We adjusted the RT data as a linear function of the reciprocal of contrast for each different spatial frequency and experimental task combination (Figure 2.3 or Table 1) to estimate the corresponding slops and t0. The mean value of sensitivity (1/k) and t0
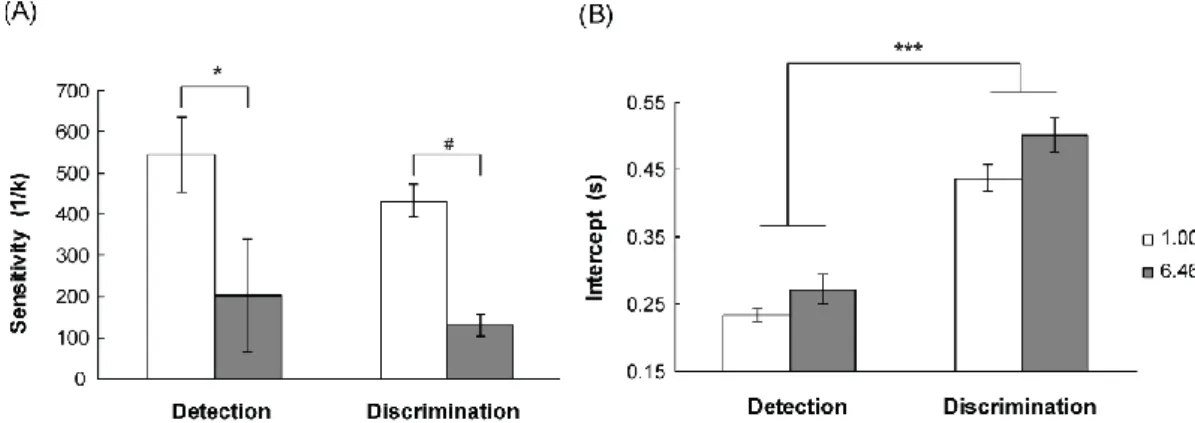
for visual detection and discrimination was showed in Table 1. To test the effect of experimental task on visual sensitivity, a 2 Task type (Det., Dis.) × 2 SF (1.00, 6.46) repeated-measures analysis of variance on sensitivity was expressed a significant main effect for SF, [F (1,4) = 8.57, p < 0.043], suggest that sensitivity for SF of 1.00 was significant faster than that for 6.46 (489 vs. 165). The results were in agreement with typical contrast curves. Further post-hoc tested showed that the difference of SF was significant at detection task and there was a trend for difference in discrimination task,
Chapter 2 Perception-related visual spatial frequency processing:
a behavioral study
17
p was 0.033 and 0.083, respectively (see Fig. 2.3 A). However, no significant difference was found in experimental task and there was no interaction between experimental task and SF. Our data suggesting that experimental task not influence visual detectability.
Table 1. Mean data over all participants in the parameter k and t0.
Standard error of the mean (SEM) is given in parentheses. Det. means detection task and Dis. means discrimination task.
We ran another ANOVA on the intercepts (t0) extracted from the fits to Eq. 1, using the same 2 Task type (Det., Dis.) × 2 SF (1.00, 6.46) repeated-measures analysis of variance. This analysis revealed a significant main effect of Task type, [F (1,4) = 82.03, p < 0.001], indicating an overall RT increased in discrimination task with respect to detection task (a speed down of 216 ms on average). The post-hoc comparisons showed that t0 to detection task was fast than that to discrimination task for both spatial frequency of 1.00 and 6.46. This enhancement was equivalent for all conditions (see Fig. 2.3 B). In addition, there were revealed by lack of significant interaction between Task type and SF, [F (1,4) = 9.68, p = 0.62]. These results suggesting that experimental task influence processing latencies intrinsic of sensory pathway and motor time of the effector system.
Chapter 2 Perception-related visual spatial frequency processing:
a behavioral study
18
Figure 2.3 The results of sensitivity (A) for Detection task and Discrimination task in spatial frequency of 1.00 and 6.46. (B) intercepts for Detection task and Discrimination task
in spatial frequency of 1.00 and 6.46, # p = 0.08, * p < 0.05, *** p <0.001.
2.4. Discussion
In the present study, we explored the diversity of detection and discrimination on visual processing by behavioral methods. To investigate this issue, visual detection task and visual discrimination task were performed in this study. In the detection experiment, subjects were instructed to do a detection task, when they saw visual stimulus by pressing right button. In the discrimination experiment, subjects were instructed to do a discrimination of visual orientation, when stimulus deflected to right pressed right button, when stimulus deflected to left pressed left button.
Our results showed that no significant difference for hit rates between detection task and discrimination task. These results suggested that correct perceptive is basic detectability, not changed by experimental task, which was consisted with previous studies, which showed that hit rate is increased with contrast increasing [37-40].
Additionally, analysis for sensitivity also showed no significant difference between visual detection task and visual discrimination task. Therefore, our results suggested that experimental task not altered basic visual detectability. We claim that the changes
Chapter 2 Perception-related visual spatial frequency processing:
a behavioral study
19
in the slope are linked to sensory processing independently of the model applied and are specifically larger for the low-SF visual channels than for the high-SF channels, highlighting their stimulus dependence. However, some previous studies have showed that discrimination is better than detection [39, 41, 42]. In the study of Dzhafarov et al.
(1982), they did visual position perceive, and reported that the performance for visual discrimination will better than for visual detection in RTs but not hit rates. Therefore, it is reasonable that experimental task not influenced the basic visual detectability.
The results described above are clear in that response times to visual events are modulates by experimental task, RTs for detection were significant faster than that for discrimination. The results were agreement with previous studies, which reported that task influenced reaction times [34, 43-47], due to the complexity of the task [38, 43, 44, 48-51]. In the study of Sagi et al. (1984), visual detection and visual discrimination task was preformed, showed that the response time for visual detection was significantly faster than that for visual discrimination (130 ms vs. 180 ms). Recent studies also reported the relationship between visual search and visual detection [52], showed that the speed of search was slower than visual detection and search effectiveness was depended on the size (complexity). Gilbert et al. (2013) have argued that the speed of visual processing was depended on the task [44]. In addition, RTs is known to decreased with increasing contrast [35, 45, 53]. In the study of Brooks et al (2001), a visual detection task with vary contrast were preformed, they reported that visual RTs for high contrast was significant faster than that for low contrast. It would be very surprising if the same exponent applied to contrast and any other measure of stimulus strength. Some other studies have measures of stimulus strength, found that RTs was increased with increasing spatial frequency [35, 54]. Therefore, our results provide some evidences that the speed of stimulus processing is related to the experimental task and stimulus strength.
Chapter 2 Perception-related visual spatial frequency processing:
a behavioral study
20
Additionally, we have compared t0 for detection and discrimination thresholds, there was also diversity between detection and discrimination task (0.253 s vs. 0.469 s).
Experimental task not alter basic visual perceive by the means of early sensory processing. Although it is rare that we view low contrast stimuli in otherwise visual environments, considerable emphasis has been placed on psychophysically determined contrast under these conditions. Therefore, we considered that the experimental task altered the speed in latencies intrinsic of sensory pathway and motor time of the effector system. Additionally, we proved some basis data from framework for robot processing system, see Figure 5. We compared the t0 for spatial frequency of 1.00 and 6.46, but no significant diversity was found. This result is not consisted with RTs, it may cause by the number of participants. Therefore, our results do not allow us to draw conclusion about the visual strength of spatial frequency influence visual processing (even many previous studies had proofed this). Some studies have argued that visual detectability in early visual processing [36-38], which caused by basic visual property binding effect.
However, the influence of experimental task on this binding effect is needed further to confirm.
2.5. Conclusions
The present study suggested that visual detectability is not depended on experimental task, revealing no difference was found among detection task and discrimination task.
However, the RTs is strongly depended on experimental task, showing response times to discrimination task is significantly slower than that for detection task, which based on latencies intrinsic of sensory pathway and motor time of the effector system.
Chapter 3 Attenuated audiovisual interaction in discrimination task:
a behavioral study
21
Chapter 3 Visual discrimination task attenuates audiovisual interaction regardless of spatial frequency
Summary
Although previous studies have shown that task-irrelevant auditory stimuli can facilitate visual perception, it remains unclear whether this audiovisual benefit in detection and identification processes can be attribute to the same mechanism. To clarify this, we instructed participants to perform a visual detection task and a visual identification task with/without a task-irrelevant auditory stimulus in the present study.
Our results showed that the task-irrelevant auditory stimulus quickened both visual detection (11.61%) and visual identification (6.11%) in all conditions. Moreover, the extent of the auditory quickening was influenced by the task demands (detection and identification) (p < 0.001) but was not mediated by spatial frequencies (p = 0.533). In addition, no interaction was found between the task demands and spatial frequencies (p
= 0.939), indicating that the spatial frequencies and task demands influenced the audiovisual interaction independently. These findings suggested that detection and identification, modulated by audiovisual interaction rely on partially different mechanisms.
Chapter 3 Attenuated audiovisual interaction in discrimination task:
a behavioral study
22
3.1 Background
In daily life, our brains handle multisensory information in an extremely efficient way and improve behavior, as seen in more rapid and more accurate responses [23, 55]. For example, when communicating with others, a speaker will generate sounds that reach our ears after the corresponding visual signals have reached our eyes, making the speech easier understand when looking at the speaker’s lips. This phenomenon is known as multisensory integration [56].
Since initially introduced by Stein et al. [57], sound-induced visual improvement has been widely investigated in recent studies as a case of audiovisual interaction [55, 58, 59]. Some researchers have proposed that sound-induced improvement of visual detection originates from both the perceptual stage of processing [55, 60] and response bias (c) [58]. A typical study that supported this argument was conducted by McDonald et al. (2000) in which visual improvement was evaluated using a signal detection measure. The researchers found that the presentation of a task-irrelevant sound facilitated subsequent light detection by increasing both perceptual (sensitivity, d’) and decisional measures (response bias, c). Moreover, Li et al. (2015) also used a signal detection measure to evaluate the effect of task-irrelevant auditory stimuli on visual orientation identification [61] . Similar to visual detection, the same result was found for visual identification. In particular, Chen et al. (2011) used a visual detection task and a visual orientation identification task to more clearly understand the cross-modal facilitation effect in one experiment. Their results revealed that performance of both visual detection and visual orientation identification were enhanced by the presentation of a specific (22 dB) and simultaneous noise [62]. Therefore, it is probable that visual detection and visual identification modulate audiovisual interaction by relying on the same mechanism.
Chapter 3 Attenuated audiovisual interaction in discrimination task:
a behavioral study
23
On the other hand, other researchers have proposed a dissociation between audiovisual interaction in detection and identification tasks [63, 64]. That is, audiovisual interaction in detection and identification tasks may originate from different perceptual processes.
For instance, Cecere Roberto et al. (2014) performed line orientation identification and visual detection studies in a patient with bilateral occipital lesions that spared residual portions of the V1/V2 area [63]. Their results showed that looming sound selectively enhanced the patient’s line orientation identification sensitivity (d’) in his relatively intact visual field, but visual detection was enhanced both in the intact and blind field, suggesting that audiovisual interaction during visual detection and line orientation identification might depend on different areas involved in perceptual processing. In addition, Gleiss Stephanie et al. (2013) examined whether and how sound enhances visual detection or visual identification performance [64], and they found a statistically significant perceptual enhancement with congruent sound at peripheral locations for visual detection only and not for identification. Recently, Kayser et al. (2017) further investigated these audiovisual congruency-facilitated perceptual benefits by using EEG.
Their results revealed that sound facilitated visual motion discrimination in late stages of processing (approximately 350 ms), thereby providing the strongest evidence for the differences in response bias [65]. Therefore, detection and identification modulated audiovisual interaction may rely on partially separate mechanisms. However, as outlined above, the distinction between visual detection and identification in audiovisual interaction remains controversial.
In the present study, we focused on one specific facet of audiovisual interactions, namely, the magnitude of auditory speedup visual perception, to assess audiovisual interaction between visual detection and visual identification directly. In the visual detection task, participants were instructed to respond to all visual spatial frequency stimuli while ignoring the auditory stimuli. In the visual identification task, participants
Chapter 3 Attenuated audiovisual interaction in discrimination task:
a behavioral study
24
were instructed to choose one of three visual spatial frequencies to respond to while ignoring the auditory stimuli. In the contrastive analysis, the difference in the reaction times to the visual stimuli and audiovisual stimuli was defined as the audiovisual interaction. Moreover, for unimodal visual sensory stimuli, detecting the presence of an object involves a different process than identifying the object as a particular object [66].
Therefore, we expected that audiovisual interaction could be dissociated depending on whether the spatial frequency is processed during visual perception.
3.2 Methods
3.2.1 Participants
Sixteen volunteers (age range, 22-29 years; mean, 24.4 years) participated in this experiment. All the participants had normal or corrected-to-normal vision and audition and were right-handed. Participants provided written informed consent for their participation in this study, which was previously approved by the ethics committee of Okayama University.
3.2.2 Stimuli
The visual stimuli were displayed on a linearized 17-in CRT monitor (100 Hz, 1 280×1 024, mean luminance=10 cd/m2 and maximum luminance=65 cd/m2) positioned 70 cm from each participant’s head (see Figure 3.1). The visual stimulus (V) was a Gabor patch with vertical gratings (4×4 cm, subtending approximately 2 degrees), with three spatial frequencies of 1.00, 3.47 and 6.46 cycles/degree, and presented approximately 4° below the fixation point. To avoid the intrinsic properties of the visual system during the two tasks, 100% contrast was used in the experiment. The visual stimulus was presented for 40 ms. The auditory stimulus (A) was a 3 000-Hz, 65-dB pure tone. The
Chapter 3 Attenuated audiovisual interaction in discrimination task:
a behavioral study
25
auditory stimulus was presented for 40 ms through headphones (MDR-1RNC, Sony, Japan) with a linear rise and fall time of 5 milliseconds. The audiovisual stimulus (AV) consisted of a visual stimulus and an auditory stimulus, in which the auditory stimulus was simultaneously accompanied by visual stimuli of varying spatial frequencies and was also presented for 40 ms.
3.2.3 Procedure
The study took place in a dimly lit, sound-attenuated room (laboratory room, Okayama University, Japan), and the experiment was generated by a custom-made program written in MATLAB with the Psychophysics Toolbox [67]. Participants sat on a comfortable chair with their heads fixed by a chin-rest. Each participant completed two tasks: a visual detection task and a visual identification task, and the order of the task presentation was counterbalanced across subjects.
In the visual detection task, each subject completed five sessions, with each session lasting approximately 6 min and there being 50 trials of each stimulus type. At the beginning of each session, subjects were presented with a fixation cross for 3 000 ms.
Following fixation, there was an inter-stimulus interval (ISI) that varied from 1 200 to 1 800 ms randomly. After the ISI, the stimulus (visual, auditory, audiovisual) was presented randomly, and the subjects were instructed to identify whether a visual stimulus was presented. They were instructed to press the left button if they detected visual stimuli (see Figure 3.1).
In the visual identification task, the setup of the session was similar to that of the visual detection session; however, a unimodal auditory stimulus was not presented.
Participants were asked to indicate the presence of the target stimulus, which was provided in the instructions at the beginning of each session, and to withhold a response if the target stimulus was absent. For example, when subjects were asked to respond to
Chapter 3 Attenuated audiovisual interaction in discrimination task:
a behavioral study
26
a spatial frequency of 1.00, they needed to respond to a spatial frequency of 1.00, and not respond to a spatial frequency of 3.47 or 6.46, as quickly and accurately as possible by pressing the left button of the mouse, regardless of whether an auditory stimulus was presented. In this task, each subject completed six sessions; each kind of target stimulus contained two sessions, and each session lasted approximately 6 min, with 25 trials for each stimulus type.
Figure 3.1 Experimental design. (A) Visual detection task. (B) Visual identification task.
3.2.4 Data analysis
Hit rate was defined as the number of correct responses divided by the total number of target stimuli. Reaction times (RTs) referred to the time of correct responses between the onset of the target and the motor response, and RTs less than 200 ms and more than 1 000 ms were excluded from the analysis. The differences in hit rates and RTs were analysed using a 2 task demands (detection, identification) × 2 stimulus types (V, AV)
× 3 spatial frequencies (1.00, 347, 6.46) repeated-measures analysis of variance
Chapter 3 Attenuated audiovisual interaction in discrimination task:
a behavioral study
27
(ANOVA). The difference in the RTs to the V and AV stimuli was defined as the audiovisual interaction, assessed through the interactive index [68]. Differences in audiovisual interactions within the participants were analysed using a 2 task demands (detection, identification) × 3 spatial frequencies (1.00, 3.47, 6.46) repeated-measures ANOVA. The Greenhouse-Geisser epsilon correction was used for non-sphericity, and the level of significance was fixed at a corrected p < 0.05.
Audiovisual interaction= 𝑚𝑎𝑥(A; V) −𝐴𝑉
max (𝐴;𝑉) ×100% (3.1)
3.3 Results
Hit Rate: The overall hit rates were greater than 90%, as shown in Table 1. A 2 task demands × 2 stimulus types × 3 spatial frequencies repeated-measures ANOVA of the hit rates showed a main effect of spatial frequencies only, F (2, 30) = 7.49, p = 0.002, ηp2 = 0.333. Further pairwise comparisons showed that the hit rates for 1.00 were significantly larger than 6.46. However, no other significant differences were found (all p > 0.05).
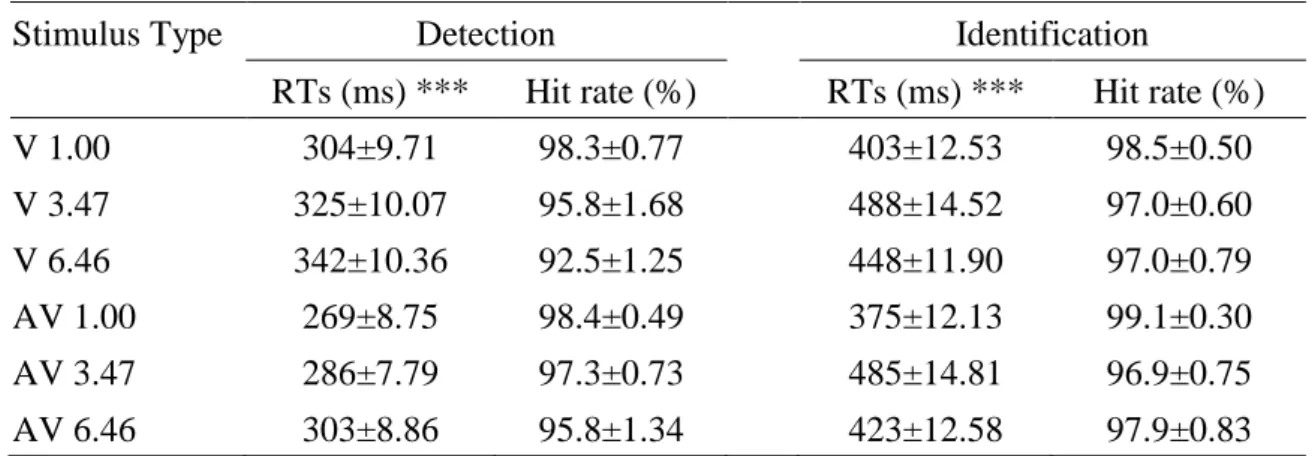
Table 3.1. Mean RTs and hit rates in all conditions of the detection and the identification.
Stimulus Type Detection Identification
RTs (ms) *** Hit rate (%) RTs (ms) *** Hit rate (%)
V 1.00 304±9.71 98.3±0.77 403±12.53 98.5±0.50
V 3.47 325±10.07 95.8±1.68 488±14.52 97.0±0.60
V 6.46 342±10.36 92.5±1.25 448±11.90 97.0±0.79
AV 1.00 269±8.75 98.4±0.49 375±12.13 99.1±0.30
AV 3.47 286±7.79 97.3±0.73 485±14.81 96.9±0.75
AV 6.46 303±8.86 95.8±1.34 423±12.58 97.9±0.83
Data are presented as the mean ± standard error of the mean (SEM). ***p <0.001 indicates a statistically significant difference between the V stimuli and the AV stimuli in all conditions.
Chapter 3 Attenuated audiovisual interaction in discrimination task:
a behavioral study
28
Reaction Times: The mean RTs for the V and AV stimuli are presented in Table 1 and Figure 3.2. The 2 task demands × 2 stimulus types × 3 spatial frequencies repeated- measures ANOVA of the RTs revealed a main effect of the task demands, F (1, 15) = 297.74, p < 0.001, ηp2 = 0.952, showing that the RTs during the detection task were faster than those during the identification task. The main effect of the stimulus types was also significant, F (1, 15) = 177.77, p < 0.001, ηp2 = 0.922, indicating a faster response to the AV stimuli than to V stimuli. Importantly, the interaction between the task demands and stimulus types was significant, F (1, 15) = 8.69, p < 0.01, ηp2 = 0.367, indicating that the auditory stimuli had differential effects on visual detection and visual identification. The post hoc comparisons showed that the response times to the AV stimuli were significantly faster than those to V stimuli for all spatial frequencies in both the detection task (all p < 0.001) and the identification task (all p < 0.001).
However, the auditory effects seemed to be larger during the detection task (39 ms) than during the identification task (27 ms). Additionally, the main effect of spatial frequencies was also significant, F (2, 30) = 81.70, p < 0.001, ηp2 = 0.845, indicating that the response times were slower from 1.00 to 6.46 (1.00 < 3.47 < 6.46, all p < 0.05).
There was also a significant interaction between the task demands and spatial frequencies, F (2, 30) = 32.98, p < 0.001, ηp2 = 0.687, indicating that each task had a different effect on visual spatial frequency processing. The post hoc comparisons found that the response times to the 1.00 frequency were faster than those to the 3.47 (p <
0.001) or 6.46 (p < 0.001) frequencies. Additionally, the response times were faster for 3.47 than for 6.46 (p < 0.001) in the detection task (RTs: 1.00 < 3.47 < 6.46), but the response times for 3.47 were slower than those for 6.46 (p < 0.01) in the identification task (RTs: 1.00 < 6.46 < 3.47). However, there were no significant interactions between the stimulus types and spatial frequencies, F (2, 30) = 0.49, p = 0.599, ηp2 = 0.032, or
Chapter 3 Attenuated audiovisual interaction in discrimination task:
a behavioral study
29
among the task demands, stimulus types and spatial frequencies, F (2, 30) = 1.21, p = 0.302, ηp2 = 0.075.
Fig 3.2 Mean RTs during the detection task (A) and the identification task (B), *** p
<0.001.
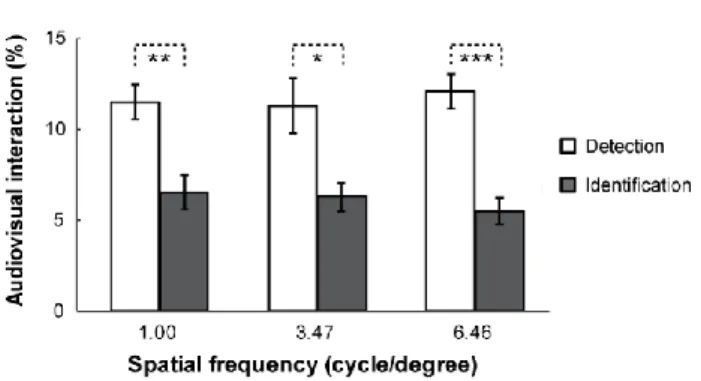
Fig 3.3 Mean audiovisual interaction under three spatial frequencies in detection task and identification task, * p <0.05, ** p <0.01, *** p <0.001.
Regarding the auditory facilitation benefits for each task, the data were reexamined in terms of audiovisual interactions (i.e., the difference between visual and audiovisual in each kind of spatial frequency; see Figure 3.3). The 2 task demands × 3 spatial frequencies ANOVA revealed a significant main effect of the task demands, F (1, 15)
= 31.19, p < 0.001, ηp2 = 0.675, with a stronger audiovisual interaction during the
Chapter 3 Attenuated audiovisual interaction in discrimination task:
a behavioral study
30
detection task than during the identification task. Further pairwise comparisons found that the audiovisual interaction during the visual identification task (6.11%) was weaker than that during the visual detection task (11.61%) for all spatial frequencies (all p <
0.01). However, no significant main effect for spatial frequencies (F (2, 30) = 0.04, p = 0.939, ηp2 = 0.003), or interaction between the task demands and spatial frequencies (F (2, 30) = 0.47, p = 0.533, ηp2 = 0.03) were found.
3.4 Discussion
In this study, we examined the audiovisual interaction elicited by visual detection and identification, and the results showed that significant audiovisual interaction occurred in both the detection and discrimination tasks (see Figure 3.2). However, the audiovisual interaction was mediated by task demands but not by spatial frequencies (see Figure 3.3).
The task-irrelevant auditory stimuli enhanced visual perception, regardless of the task demands or spatial frequencies (see Figure 3.2). The tasks replicated a classical cross- modal audiovisual interaction that has been reported previously in behavioural [58, 69], fMRI [70], ERP [71] and TMS [72] studies, suggesting that the simultaneous presence of visual stimuli and task-irrelevant auditory stimuli lead to enhanced processing of visual stimuli. Neurophysiological studies have reported that the auditory input activates the primary auditory cortex within 15 ms of presentation and then transmits the information to the visual cortex [73]. Falchier et al. (2002) systematically investigated multisensory processing in the primate striate cortex using anatomical methods [73]. Their results showed that the auditory input connected to the visual peripheral area directly and enhanced the visual cortex excitability. Subsequently, this connectivity was also found in the central visual field of humans [74]. Therefore, the
Chapter 3 Attenuated audiovisual interaction in discrimination task:
a behavioral study
31
low-level cortical interaction might lead to enhancements in visual perception. In addition, the integration between auditory and visual has also been found to occur via higher-order association cortices, such as the prefrontal and parietal cortices [70, 75].
Therefore, it is reasonable that task-irrelevant auditory stimuli facilitate visual perception.
The audiovisual interaction during the visual detection task was stronger than that during the visual identification task (see Figure 3.3). This result may be related to attention, which has been found to play an important role in audiovisual interaction.
Mozolic et al. (2008) studied audiovisual integration using selective attention (attention to a single modality, visual or auditory) and divided attention (paying attention both visual and auditory), and their results indicated weaker audiovisual interaction with selective attention than with divided attention [76]. Therefore, it is possible that the attenuated audiovisual interaction in the present study was due to the further selectivity of the spatial frequencies. As is well known, the amount of information that can be attended to at once is limited the visual modality [77]. Investigations in visual studies using behavioral and ERP methods showed that visual identification utilizes additional attentional processes beyond those required for detection [66, 78]. Thus, it seems that some attention, which is necessary for audiovisual processing, shifted to identify whether the visual stimulus was the target spatial frequency, resulting in a reduced audiovisual interaction. Recently, Gibney et al. (2017) provided further evidence for the impact of attention on audiovisual interaction via studies using quickened audiovisual detection task and McGurk tasks using dual-task paradigms [79]. They also found decreased audiovisual integration and a reduced McGurk effect due to the decreased attention (diverting attention to the secondary task). Therefore, the attenuated audiovisual interaction during the identification task in this study could mainly be attributed to the decline in attention, which is needed for audiovisual processing.
Chapter 3 Attenuated audiovisual interaction in discrimination task:
a behavioral study
32
The audiovisual interaction was not mediated by spatial frequency in either the detection task or the identification task (see Figure 3.3). This result extended Perez- Bellido’s findings that a high contrast (83.3%) leads to the same amount of auditory enhancement of visual detection, regardless of spatial frequency [80]. This occurrence is possibly associated with early audiovisual integration, which is considered an automatic tendency to improve behavioural perception. Previous studies of humans demonstrated early audiovisual interaction in detection [23] and identification task [63].
Senkowski et al. (2011) reported the existence of early audiovisual integration and further clarified that early audiovisual integration was stimulus-driven processing, with a low-intensity stimulus resulting in stronger early audiovisual interaction [71]. In the present study, the extent of early audiovisual interaction between the visual and auditory stimuli was influenced by spatial frequency, but the use of a high contrast resulted in equivalent audiovisual interaction in both the detection (11.5%, 11.3%, 12.1%
for 1.00, 3.47 and 6.46, respectively) and identification task (6.5%, 6.3%, 6.5% for 1.00, 3.47 and 6.46, respectively). Studies by Romei et al. (2013) provided further evidence by using TMS methods to test the time course of the cross-modal impact of looming sounds on visual perception, and they found that the attentional preferences of the participants affected the late stage, but not the early stage, of excitability changes [72].
Furthermore, De Meo et al. (2015) further proposed that early audiovisual interaction are a hallmark of bottom-up audiovisual processes that facilitate perception and behaviour directly, independent of task control [81]. Therefore, it is reasonable that the spatial frequencies did not modulate audiovisual interaction in either the detection or identification task.
Chapter 3 Attenuated audiovisual interaction in discrimination task:
a behavioral study
33
3.5 Conclusions
In summary, our results demonstrated the importance of task demands and spatial frequencies for cross modal audiovisual interaction. Overall, visual detection rather than visual identification, was more beneficial for optimizing audiovisual interaction.
These findings suggested that detection and identification modulated audiovisual interaction by relying on partially different mechanisms. However, we can’t dissociate the audiovisual interaction between detection and identification due to the lack of modulation by spatial frequencies, further electrophysiological studies are needed to confirm it.
Chapter 4 Visual intensity-related audiovisual interaction in visual detection: a behavioral study
34
Chapter 4 Visual intensity-dependent modulation: Effect of spatial frequency on audiovisual interaction in visual detection task
Summary
Although previous studies have shown that the auditory facilitation of visual detection is influenced by stimulus features, the impact of visual spatial frequency on the auditory facilitation of visual detection is still unclear. To examine the influence of spatial frequency on the auditory facilitation of visual detection, we designed a visual detection task with a task-irrelevant auditory stimulus while varying spatial frequency. The results showed that spatial frequency modulates the auditory facilitation of visual detection at low contrast (20%), but not at high contrast (100%). Moreover, the data revealed that the auditory facilitation of visual detection was larger for low and high spatial frequencies, and smallest at a spatial frequency of 0.70 cycles/degree. However, when visual contrast was adjusted to the same visual intensity, no significant difference was found among spatial frequencies. There was a significant interaction between spatial frequency and contrast during the auditory facilitation of visual detection, showing that lower visual intensity lead to greater auditory facilitation effect. These findings suggest the modulation of spatial frequency on the auditory facilitation of visual detection was dependent on visual intensity.