Monitoring serum proangiogenic cytokines from
hepatocellular carcinoma patients treated with sorafenib
Takuya Adachi1, Kazuhiro Nouso1,2, Koji Miyahara3, Atsushi Oyama1, Nozomu
Wada1, Chihiro Dohi1, Yasuto Takeuchi1, Tetsuya Yasunaka1, Hideki Onishi1, Fusao
Ikeda1, Shinichiro Nakamura1, Hidenori Shiraha1, Akinobu Takaki1, Hiroyuki
Takabatake4, Shin-ichi Fujioka5, Haruhiko Kobashi6, Yoshitaka Takuma3, Shouta
Iwadou3, Shuji Uematsu3, Koichi Takaguchi7, Hiroaki Hagihara8, Hiroyuki Okada1
on behalf of the Okayama Liver Cancer Group.
1Department of Gastroenterology and Hepatology, Okayama University Graduate
School of Medicine, Dentistry and Pharmaceutical Sciences, 2Okayama City
Hospital, 3Hiroshima City Hospital, 4Kurashiki Central Hospital, 5Okayama
Saiseikai General Hospital, 6Okayama Red Cross General Hospital, 7Kagawa
Prefectural Central Hospital, 8Sumitomo Besshi Hospital, Japan
Running title: Proangiogenic cytokines and sorafenib in HCC Keywords: Proangiogenic cytokines, Angiopoietin-2, HCC, sorafenib
Address for correspondence:
Kazuhiro Nouso, M.D., Ph.D.
Department of Gastroenterology and Hepatology, Okayama University Graduate
School of Medicine, Dentistry, and Pharmaceutical Sciences,
2-5-1 Shikata-cho, Kita-ku, Okayama-City, Okayama 700-8558, Japan
Tel.: +81-86-235-7219
Fax: +81-86-225-5991
E-mail: [email protected]
Abstract
Background: Several factors, including proangiogenic cytokines, have been
reported as predictive markers for the treatment effect of sorafenib in patients with
hepatocellular carcinoma (HCC); however, most of them were determined based on
one-time measurements prior to treatment.
Methods: We consecutively recruited 80 advanced HCC patients who were treated
with sorafenib prospectively. Serum levels of eight proangiogenic cytokines and the
appearance of adverse events were monitored periodically, and their correlations
with the prognoses of the patients were evaluated.
Results: Among six significant risk factors for overall survival in univariate
analyses, high angiopoietin-2 (hazard ratio, 2.06), high hepatocyte growth factor
(hazard ratio, 2.08), and poor performance status before the treatment (hazard
ratio, 2.48) were determined as independent risk factors. In addition, high
angiopoietin-2 at the time of progressive disease was a marker of short post-
progression survival (hazard ratio, 4.27). However, there was no significant
variable that predicted short progression-free survival except the presence of
hepatitis B virus surface antigen.
Conclusions: Predictions of overall survival and post-progression survival were
possible by periodically measuring serum proangiogenic cytokines, especially
angiopoietin-2, in patients with HCC treated with sorafenib.
Introduction
Hepatocellular carcinoma (HCC) is a hypervascular malignant tumour
arising from liver parenchyma 1, and is the second leading cause of cancer-related
death worldwide 2. Advanced HCC is known for its poor prognosis 34. Sorafenib is a
standard therapy for advanced HCC because the survival benefits have been
demonstrated in two randomized, placebo-controlled, double-blind phase III clinical
trials 56. Thereafter, most randomized studies of the new multikinase inhibitors,
sunitinib, brivanib, and linifanib, or a combination of sorafenib and erlotinib did
not reveal a better survival benefit or tolerability compared to sorafenib
monotherapy 7. Recently, regorafenib, lenvatinib, and cabozantinib have shown
survival benefits 891011. Because several drugs are available for the treatment of
advanced HCC, it is important to know the efficacies of the drugs in each patient
prior to, or soon after starting treatment. Especially, early prediction of sorafenib
efficacy is important, because it is still the most common treatment for advanced
HCC.
Studies based on patient cohorts have identified several early surrogate
markers, including changes in serum alpha-fetoprotein (AFP) levels after
treatment, monitoring of the tumour blood supply with dynamic contrast-enhanced
magnetic resonance imaging, and the appearance of treatment-related adverse
events. Amplification of FGF3/FGF4 or vascular endothelial growth factor
(VEGF)A, and the increased expression of phospho-Mapk14 or phospho-Atf2 have
also been reported as possible predictive markers that must be still validated 12.
We previously reported that high expression of angiopoietin-2 (Ang-2) or
high numbers of elevated cytokines in the serum were associated with poor
progression-free survival (PFS) and overall survival (OS) in advanced HCC
patients treated with sorafenib 13. Llovet et al. also reported the possibility of Ang2
and VEGF as predictors of survival. However, none of the biomarkers measured
before starting sorafenib has been validated in terms of predicting the response to
sorafenib 14.
In the present study, we sequentially examined the expressions of
cytokines as well as adverse events prospectively, to reveal the significance of
measuring proangiogenic cytokines as predictors of treatment efficacy and survival
in patients with advanced HCC who received sorafenib treatment.
Materials and methods Patient characteristics and diagnosis of HCC
Between January 2013 and January 2016, we enrolled 80 consecutive
patients with advanced HCC, who were treated with sorafenib at our institute or
collaborating hospitals (Hiroshima City Hospital, Kurashiki Central Hospital,
Kagawa Prefectural Central Hospital, Sumitomo Besshi Hospital, Okayama Red
Cross General Hospital, and Okayama Saiseikai General Hospital) in this
prospective study. Diagnosis of HCC was confirmed based on hyperattenuation in
the arterial phase and hypoattenuation in the portal/venous phase 15. Written
informed consent for drawing blood and using it for this study was obtained from
all patients. The study protocol conformed to the ethical guidelines of the World
Medical Association Declaration of Helsinki, was approved by the ethics
committees of the institutes involved, and was registered at UMIN
(UMIN000009771).
Treatments and follow-ups
Forty-one patients started sorafenib treatment at 400 mg bid, 35 patients
were treated at 400 mg sid, four patients were treated with 400 mg QOD. A
reduced starting dose was sometimes chosen by doctors because of the possibility of
low tolerance resulting from low body weight and/or old age. The dose reduction of
sorafenib was carried out according to the protocol recommended by the
pharmaceutical company.
The patients were followed-up until June 2017. They were checked
bimonthly by routine surveillance imaging, such as dynamic computed tomography
or magnetic resonance imaging, in addition to periodic blood tests that included
AFP and des-gamma-carboxyprothrombin (DCP). All patients had at least one
untreated target lesion that could be measured in one dimension, and the
treatment effects were evaluated according to the Modified Response Evaluation
Criteria in Solid Tumors (mRECIST) guideline 16.
Data collection
The clinical information of consenting patients was abstracted from
medical records. Variables included age, sex, markers for hepatitis virus infection,
Eastern Cooperative Oncology Group performance status (ECOG PS), Child-Pugh
grade, and serum laboratory tests, such as AFP and DCP. The HCC parameters of
size, number of lesions, presence of macroscopic vascular invasion (MVI) and
extrahepatic spread were collected before starting the sorafenib treatment. The
adverse events within 1 month after starting sorafenib treatment were also
examined.
Measurement of cytokines
Serum was collected before starting sorafenib treatment, after 2 weeks,
after 4 weeks, at the time of the first imaging evaluation (after 8 weeks), and at the
time of progressive disease (PD). The blood samples were centrifuged for 10
minutes at 15,000 × g, and the supernatants were frozen immediately and stored at
-30°C until use. The samples were assayed to determine the concentration of
follistatin (FST), granulocyte colony-stimulating factor (G-CSF), hepatocyte growth
factor (HGF), leptin, platelet-derived growth factor BB (PDGF-BB), platelet
endothelial cell adhesion molecule-1 (PECAM-1), Ang-2, and VEGF using a BioPlex
200 System (Bio-Rad Laboratories, Hercules, CA, USA) following the
manufacturer’s protocols. The samples were tested in duplicate, and the mean
value was used for the analysis.
Statistical analysis
The cytokine data and the characteristics of the patients were compared
with the PFS and OS. The PFS and OS were calculated from the first day of
sorafenib treatment. The relationship between post-progression survival (PPS) and
the expression level of each cytokine at PD was also analysed. Wilcoxon’s rank sum
test was used to compare continuous data. Fisher’s exact test was used to compare
categorical data. Survival was estimated by the Kaplan-Meier method and
compared using the log-rank test. Cox’s proportional hazards model was used to
analyse the hazard ratio (HR) and 95% confidence interval (CI). Factors exhibiting
significance using univariate analyses were further analysed by multivariate
analyses. To avoid the effect of multicollinearity, the HR of cytokine was examined
separately using multivariate analyses. For statistical analyses, P<0.05 was
considered significant. All statistical analyses were performed using JMP Pro
statistical software (version 12, SAS Institute, Cary, NC, USA).
Results
Characteristics of the patients
The median age of the patients was 72 years and 64 (80%) were male
(Table 1). Liver function was preserved and performance status (PS) was good in
most of the patients. The percentage of Child-Pugh A and ECOG PS:0 were 86.3%
and 81.3%, respectively. Approximately two-thirds (63.8%) of the patients had
multiple tumours ≧5) in the liver, 51.3% had tumours≧30 mm in diameter, and
MVI was observed in 40.0% of the patients. Distant metastases or lymph node
metastases was observed in 62.5% of the patients. The percentage of advanced
stage HCC was higher in this cohort compared to a previous report by Miyahara et
al. 13.
The median PFS was 93 days, and the median OS was 318 days. At the
first evaluation (2 months after starting the treatment), 5 (6.3%) patients had a
partial response (PR), 26 (32.5%) had a stable disease (SD), and 36 (45%) had PD.
Of these, 10 (12.5%) patients were able to maintain a SD for more than 1 year.
Treatment effects and proangiogenic cytokines
The median cytokine concentrations before sorafenib treatment were as
follows: 530.0 pg/mL for FST, 16.3 pg/mL for G-CSF, 1,449.3 pg/mL for HGF,
3,661.3 pg /mL for leptin, 2,569.2 pg/mL, for PDGF-BB, 6054.9 pg/mL for PECAM-
1, 376.2 pg/mL for Ang-2, and 156.7 pg/mL for VEGF. The cytokine levels but FST
and VEGF were not different among patients with different etiologies
(Supplemental Table 1).We previously reported in our retrospective study that all
proangiogenic cytokines (FST, G-CSF, HGF, leptin, PDGF-BB, PECAM-1, Ang-2,
and VEGF) before sorafenib treatment were higher in PD patients than in non-PD
patients 13. In this prospective study, median values of the PD group were also
higher than those in the non-PD group, except FST and PECAM-1; however, the
differences were not statistically significant (Figure 1).
Risk factors for PFS
We divided the expression of cytokines into two groups by the median and
examined their risks for PFS. No cytokine before the therapy (Table 2) or after 2 or
4 weeks (data not shown) was correlated with PFS using univariate analyses.
Among 13 variables including the patients’ characteristics, tumour factors, and
adverse events within 4 weeks, only the presence of hepatitis B surface antigen
was correlated with a short PFS (HR, 3.23; 95%CI, 1.63–6.13; P=0.001).
Risk factors for OS
Univariate analysis revealed that high HGF (HR, 2.08; 95%CI, 1.23–3.59;
P=0.006) and high Ang-2 (HR,1.90; 95%CI, 1.12–3.25; P=0.017) before sorafenib
treatment were risk factors for survival, in addition to four clinical parameters,
which were poor ECOG PS (HR, 2.23; 95%CI, 1.14–4.07; P=0.020), large tumour
number (≥5) (HR, 1.79; 95%CI, 1.04–3.23; P=0.035), high DCP (>100 mAU/mL)
(HR, 2.46; 95%CI 1.31–5.04; P=0.004), and no hand foot syndrome within 30 days
(HR,1.85; 95%CI, 1.08–3.18; P=0.024) (Table 3). Multivariate analyses of these
factors revealed that poor ECOG PS (HR, 2.48; 95%CI, 1.14–5.22; P=0.022), high
HGF (HR, 2.08; 95%CI, 1.11–3.97; P=0.021), and high Ang-2 (HR, 2.06; 95%CI,
1.12–3.84; P=0.018) were independent risk factors for survival (Table 4, Figure 2).
PPS and cytokine expression
Because serum concentrations of Ang-2 and HGF before sorafenib
treatment were closely correlated with the OS, the correlations between the levels
at the time of PD and PPS were analysed. No correlation was observed between
HGF at PD and PPS; however, the PPS of patients with high Ang-2 at PD was
significantly shorter than that with low Ang-2 (P<0.001, Figure 3).
Changes of serum Ang-2 level during the treatment
To know the relationship between treatment effect and Ang-2 changes
during sorafenib treatment, we compared the serum Ang-2 levels before the
treatment and at the time of the evaluation in PD patients and non-PD patients.
Ang-2 level was significantly increased in PD patients (median: from 372.7 to 777.6
pg/mL, p=0.013); however, no changes were observed in non-PD cases (median:
from 390.2 to 474.8 pg/mL, p=0.71).
Discussion
In this prospective cohort study, we examined serum proangiogenic
cytokines periodically in patients with advanced HCC who received sorafenib
treatment. There was no cytokine that could predict drug response and PFS.
However, high HGF and Ang-2 as well as a poor performance status before
treatment were significantly correlated with a short OS. In addition, patients with
high Ang-2 at the time of PD showed a short PPS. These results indicated that
measuring serum proangiogenic cytokines, especially Ang-2 at appropriate times,
was helpful in predicting the prognoses of patients.
VEGF and Ang-2 are known to be produced by cancer cells and play
important roles in regulating tumour angiogenesis 17. Angiopoietin-1 (Ang-1) is a
counterpart of Ang-2 that is predominantly expressed in support cells of large blood
vessels as well as stromal, endothelial, and tumour cells Ang-1 recruits pericytes
and smooth muscle cells and stabilizes vascular networks. Ang-2 is an agonist and
antagonist of Ang-1, which is expressed during vascular remodelling, and prevents
vascular stability. Consequently, Ang-2 helps VEGF to stimulate endothelial cells,
resulting in neovascularization of the tumour 18. Immunohistochemical
examination of HCC has revealed that increased Ang-2 expression was associated
with tumour dedifferentiation, and the expression was higher in hypervascular
HCC patients than in hypovascular HCC patients 19. We observed in this study
that high Ang-2 before treatment was a marker for a short survival and at the time
of PD was a marker for a short PPS. These results indicated that the majority of
serum Ang-2 expressed in HCC patients was tumour-derived and could be a
marker of the angiogenic potential of HCC, independent of sorafenib treatment.
These findings were consistent with the results of our previous report and with the
SHARP study by Llovet et al., although they reported the relationship between OS
and Ang-2 level using only one time point, which was before sorafenib treatment 14.
There are several reports showing that the decrease of AFP during
sorafenib treatment correlated with better prognosis 2021. In this study, the
percentage of non-PD in patients whose AFP decreased over 20% at 4 weeks of the
treatment was higher than that in patients who did not show the decrease (66.7%
vs. 31.4%, P=0.02). The result was consistent with the published reports of
retrospective studies. The same relationship might be observed with other factors
including Ang-2 so that further examination is necessary in future.
HGF and activation of its transmembrane tyrosine kinase receptor, cellular
MET (cMET), has been implicated in cellular invasion and metastases through
induction of increased proliferation, migration, and angiogenesis 22. A positive
correlation between high serum HGF levels and short OS has been reported in
HCC patients 23; however, the relationship was observed only between expression
of HGF before sorafenib treatment and OS in the study. The expression at the time
of PD did not correlate with PPS. There are several possible reasons for this
discrepancy. First, cMET is often downregulated in HCC patients 24, so HGF may
not be able to promote the growth of HCC in all patients. Second, HGF is also
produced by stromal cells such as stellate cells in addition to cancer cells 25.
Moreover, the serum level is sometimes elevated in patients with hepatitis 26,
indicating that HGF does not always reflect the tumour burden. Recently, elevated
HGF expression as an autocrine cMET activation mechanism in acquired
resistance to sorafenib was reported 27. Further analysis with local HGF levels
might provide another perspective.
We previously conducted a retrospective study and reported that all
proangiogenic cytokine concentrations (FST, G-CSF, HGF, leptin, PDGF-BB,
PECAM-1, Ang-2, and VEGF) examined in this study before sorafenib treatment
were higher during PD than during non-PD periods 13. However, we did not observe
these differences prospectively. In the present study, fewer patients were examined
and more advanced HCC (a higher percentage of MVI, larger tumour sizes, and
higher tumour numbers) were included. There were many patients with higher
cytokine levels when compared to our previous study. These differences might have
decreased the correlations between cytokine levels and the treatment effects.
Although we analysed the data of prospectively collected samples, there
were some limitations in the study. First, we could not fix the starting dose of
sorafenib treatment. Because this study was conducted as part of daily practice in
multiple centres, the dose was prescribed by the doctors in charge. This might have
lowered the power of the tests. Second, no restrictions of treatments prior to
sorafenib and after PD were defined. In addition, we did not directly compare the
usefulness of the biomarkers between patients treated with sorafenib and the
placebo.
Nevertheless, we clearly demonstrated that the prediction of OS and PPS
in patients with HCC who received sorafenib was possible by measuring serum
proangiogenic cytokine levels at appropriate times. Among these cytokines, Ang-2
was the most important predictor. Further study with other new molecular target
drugs will be necessary to confirm the usefulness of measuring proangiogenic
cytokines to select the proper drug for the treatment of advanced HCC patients.
Acknowledgements
We thank all members of the Okayama Liver Cancer Group for collecting
data of advanced HCC patients treated with sorafenib: Youichi Morimoto,
Kurashiki Central Hospital, Okayama; Toshiya Osawa, Okayama Saiseikai
General Hospital, Okayama; Kazuya Kariyama, Okayama City Hospital,
Okayama; Junichi Toshimori, Okayama Red Cross General Hospital, Okayama;
Hiroki Takayama, Tsuyama Central Hospital; Hirokazu Miyatake, Ryoichi
Okamoto, and Yasuyuki Araki, Hiroshima City Hospital, Hiroshima; Kenji Kuwaki,
Kazuhisa Yabushita, and Kohsaku Sakaguchi, Fukuyama City Hospital,
Hiroshima; Tatsuro Sakata and Toshihiko Kaneyoshi, Fukuyama Medical Center,
Hiroshima; Manabi Miyashita and Yasuhiro Makino, Iwakuni Clinical Center,
Yamaguchi; Akio Moriya and Masaharu Ando, Mitoyo General Hospital, Kagawa;
Tomonori Seno and Takuya Nagano, Kagawa Prefectural Central Hospital,
Kagawa; Sumitomo Besshi Hospital, Ehime.
This research was also supported by funding from Bayer Yakuhin, Ltd, under a
research contract.
References
1. El-Serag HB. Hepatocellular carcinoma. N Engl J Med 2011;365:1118-27.
2. Petrick JL, Braunlin M, Laversanne M, et al. International trends in liver
cancer incidence, overall and by histologic subtype, 1978-2007. Int J Cancer
2016;139:1534-45.
3. Llovet JM. Updated treatment approach to hepatocellular carcinoma. J
Gastroenterol 2005;40:225-35.
4. Ji Y, Wang Z, Li Z, et al. Angiotensin II induces angiogenic factors production
partly via AT1/JAK2/STAT3/SOCS3 signaling pathway in MHCC97H cells.
Cell Physiol Biochem 2012;29:863-74.
5. Llovet JM, Ricci S, Mazzaferro V, et al. Sorafenib in advanced hepatocellular
carcinoma. N Engl J Med 2008;359:378-90.
6. Cheng AL, Kang YK, Chen Z, et al. Efficacy and safety of sorafenib in patients
in the Asia-Pacific region with advanced hepatocellular carcinoma: a phase
III randomised, double-blind, placebo-controlled trial. Lancet Oncol
2009;10:25-34.
7. Ch'ang HJ. Optimal combination of antiangiogenic therapy for hepatocellular
carcinoma. World J Hepatol 2015;7:2029-40.
8. Bruix J, Qin S, Merle P, et al. Regorafenib for patients with hepatocellular
carcinoma who progressed on sorafenib treatment (RESORCE): a randomised,
double-blind, placebo-controlled, phase 3 trial. Lancet 2017;389:56-66.
9. Kudo M. Systemic Therapy for Hepatocellular Carcinoma: 2017 Update.
Oncology 2017;93 Suppl 1:135-146.
10. Kudo M, Finn RS, Qin S, et al. Lenvatinib versus sorafenib in first-line
treatment of patients with unresectable hepatocellular carcinoma: a
randomised phase 3 non-inferiority trial. Lancet 2018;391:1163-1173.
11. Nault JC, Galle PR, Marquardt JU. The role of molecular enrichment on
future therapies in hepatocellular carcinoma. J Hepatol 2018.
12. Shao YY, Hsu CH, Cheng AL. Predictive biomarkers of sorafenib efficacy in
advanced hepatocellular carcinoma: Are we getting there? World J
Gastroenterol 2015;21:10336-47.
13. Miyahara K, Nouso K, Morimoto Y, et al. Pro-angiogenic cytokines for
prediction of outcomes in patients with advanced hepatocellular carcinoma.
Br J Cancer 2013;109:2072-8.
14. Llovet JM, Pena CE, Lathia CD, et al. Plasma biomarkers as predictors of
outcome in patients with advanced hepatocellular carcinoma. Clin Cancer
Res 2012;18:2290-300.
15. Kim SH, Lee WJ, Lim HK, et al. Prediction of viable tumor in hepatocellular
carcinoma treated with transcatheter arterial chemoembolization: usefulness
of attenuation value measurement at quadruple-phase helical computed
tomography. J Comput Assist Tomogr 2007;31:198-203.
16. Lencioni R, Llovet JM. Modified RECIST (mRECIST) assessment for
hepatocellular carcinoma. Semin Liver Dis 2010;30:52-60.
17. Sugimachi K, Tanaka S, Terashi T, et al. The mechanisms of angiogenesis in
hepatocellular carcinoma: angiogenic switch during tumor progression.
Surgery 2002;131:S135-41.
18. Bupathi M, Kaseb A, Janku F. Angiopoietin 2 as a therapeutic target in
hepatocellular carcinoma treatment: current perspectives. Onco Targets Ther
2014;7:1927-32.
19. Torimura T, Ueno T, Kin M, et al. Overexpression of angiopoietin-1 and
angiopoietin-2 in hepatocellular carcinoma. J Hepatol 2004;40:799-807.
20. Personeni N, Bozzarelli S, Pressiani T, et al. Usefulness of alpha-fetoprotein
response in patients treated with sorafenib for advanced hepatocellular
carcinoma. J Hepatol 2012;57:101-7.
21. Kawaoka T, Aikata H, Murakami E, et al. Evaluation of the mRECIST and
alpha-fetoprotein ratio for stratification of the prognosis of advanced-
hepatocellular-carcinoma patients treated with sorafenib. Oncology
2012;83:192-200.
22. Goyal L, Muzumdar MD, Zhu AX. Targeting the HGF/c-MET pathway in
hepatocellular carcinoma. Clin Cancer Res 2013;19:2310-8.
23. Vejchapipat P, Tangkijvanich P, Theamboonlers A, et al. Association between
serum hepatocyte growth factor and survival in untreated hepatocellular
carcinoma. J Gastroenterol 2004;39:1182-8.
24. Santoro A, Rimassa L, Borbath I, et al. Tivantinib for second-line treatment
of advanced hepatocellular carcinoma: a randomised, placebo-controlled
phase 2 study. Lancet Oncol 2013;14:55-63.
25. Liu WT, Jing YY, Yu GF, et al. Hepatic stellate cell promoted hepatoma cell
invasion via the HGF/c-Met signaling pathway regulated by p53. Cell Cycle
2016;15:886-94.
26. Panasiuk A, Pogorzelska J, Prokopowicz D. [Growth factors in chronic
hepatitis C]. Przegl Epidemiol 2007;61:559-66.
27. Firtina Karagonlar Z, Koc D, Iscan E, et al. Elevated hepatocyte growth factor
expression as an autocrine c-Met activation mechanism in acquired
resistance to sorafenib in hepatocellular carcinoma cells. Cancer Sci
2016;107:407-16.
Table 1. Characteristics of hepatocellular carcinoma patients
Variables
Median age, year (range) 72 (42-86)
Sex
Male 64 (80%)
Female 16 (20%)
Viral infection
HBsAg-positive 15 (18.8%)
HCVAb-positive 38 (47.5%)
Others 27 (33.8%)
ECOG performance status
0 65 (81.3%)
1 15 (18.8%)
Child-Pugh grade
A 69 (86.3%)
B 11 (13.8%)
Intrahepatic tumour
Tumour number (≧5) 51 (63.8%)
Tumour size (≧30 mm) 41 (51.3%)
Macroscopic vascular invasion 32 (40.0%)
Extrahepatic spread
Lymph node 17 (21.3%)
Distant metastasis 40 (50.0%)
Lymph node and/or distant metastasis 50 (62.5%) Tumour markers, median (range)
AFP (ng/mL) 259 (2.4-415825)
DCP (mAU/mL) 532 (10-485520)
AFP, alpha-fetoprotein; DCP, des-gamma-carboxyprothrombin; ECOG, Eastern Cooperative Oncology Group; HBsAg, hepatitis B virus surface antigen; HCVAb, anti-hepatitis C virus antibody.
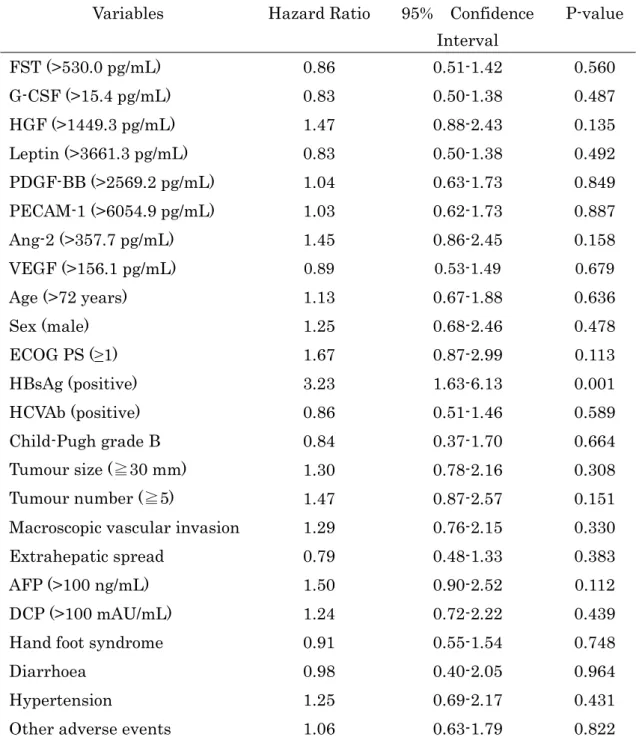
Table 2. Cytokines and clinical parameters for predicting progression-free survival (univariate analysis)
Variables Hazard Ratio 95% Confidence Interval
P-value
FST (>530.0 pg/mL) 0.86 0.51-1.42 0.560
G-CSF (>15.4 pg/mL) 0.83 0.50-1.38 0.487
HGF (>1449.3 pg/mL) 1.47 0.88-2.43 0.135
Leptin (>3661.3 pg/mL) 0.83 0.50-1.38 0.492
PDGF-BB (>2569.2 pg/mL) 1.04 0.63-1.73 0.849
PECAM-1 (>6054.9 pg/mL) 1.03 0.62-1.73 0.887
Ang-2 (>357.7 pg/mL) 1.45 0.86-2.45 0.158
VEGF (>156.1 pg/mL) 0.89 0.53-1.49 0.679
Age (>72 years) 1.13 0.67-1.88 0.636
Sex (male) 1.25 0.68-2.46 0.478
ECOG PS (≥1) 1.67 0.87-2.99 0.113
HBsAg (positive) 3.23 1.63-6.13 0.001
HCVAb (positive) 0.86 0.51-1.46 0.589
Child-Pugh grade B 0.84 0.37-1.70 0.664
Tumour size (≧30 mm) 1.30 0.78-2.16 0.308
Tumour number (≧5) 1.47 0.87-2.57 0.151
Macroscopic vascular invasion 1.29 0.76-2.15 0.330
Extrahepatic spread 0.79 0.48-1.33 0.383
AFP (>100 ng/mL) 1.50 0.90-2.52 0.112
DCP (>100 mAU/mL) 1.24 0.72-2.22 0.439
Hand foot syndrome 0.91 0.55-1.54 0.748
Diarrhoea 0.98 0.40-2.05 0.964
Hypertension 1.25 0.69-2.17 0.431
Other adverse events 1.06 0.63-1.79 0.822
Note: Proangiogenic cytokines measured before starting sorafenib treatment were divided into two groups using the median. Adverse events within 1 month from starting sorafenib were listed (hand foot syndrome, diarrhoea, hypertension, and other adverse events).
FST, follistatin; G-CSF, granulocyte colony-stimulating factor; HGF, hepatocyte
growth factor; PDGF-BB, platelet-derived growth factor BB; PECAM-1, platelet endothelial cell adhesion molecule-1; Ang-2, angiopoietin-2; VEGF, vascular endothelial growth factor. Other abbreviations were shown in Table 1.
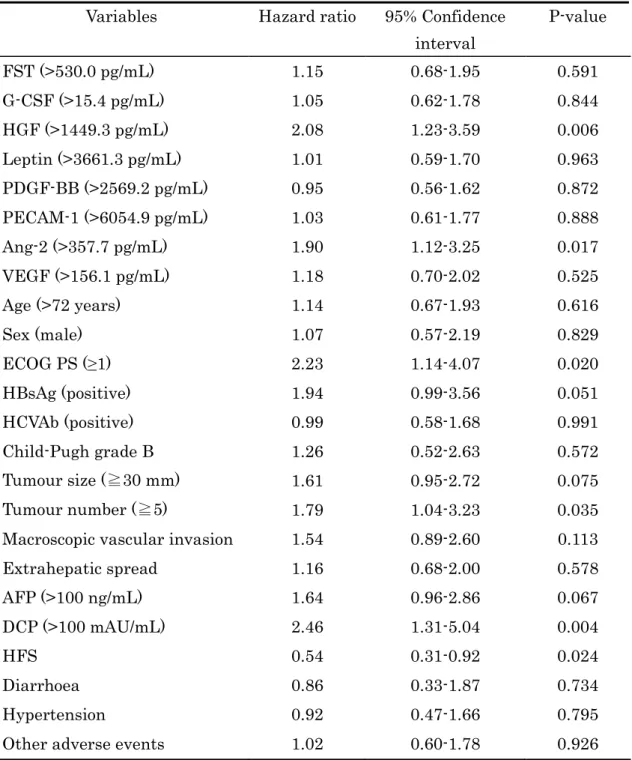
Table 3. Cytokines and clinical parameters for predicting overall survival (univariate analysis)
Variables Hazard ratio 95% Confidence interval
P-value
FST (>530.0 pg/mL) 1.15 0.68-1.95 0.591
G-CSF (>15.4 pg/mL) 1.05 0.62-1.78 0.844
HGF (>1449.3 pg/mL) 2.08 1.23-3.59 0.006
Leptin (>3661.3 pg/mL) 1.01 0.59-1.70 0.963
PDGF-BB (>2569.2 pg/mL) 0.95 0.56-1.62 0.872 PECAM-1 (>6054.9 pg/mL) 1.03 0.61-1.77 0.888
Ang-2 (>357.7 pg/mL) 1.90 1.12-3.25 0.017
VEGF (>156.1 pg/mL) 1.18 0.70-2.02 0.525
Age (>72 years) 1.14 0.67-1.93 0.616
Sex (male) 1.07 0.57-2.19 0.829
ECOG PS (≥1) 2.23 1.14-4.07 0.020
HBsAg (positive) 1.94 0.99-3.56 0.051
HCVAb (positive) 0.99 0.58-1.68 0.991
Child-Pugh grade B 1.26 0.52-2.63 0.572
Tumour size (≧30 mm) 1.61 0.95-2.72 0.075
Tumour number (≧5) 1.79 1.04-3.23 0.035
Macroscopic vascular invasion 1.54 0.89-2.60 0.113
Extrahepatic spread 1.16 0.68-2.00 0.578
AFP (>100 ng/mL) 1.64 0.96-2.86 0.067
DCP (>100 mAU/mL) 2.46 1.31-5.04 0.004
HFS 0.54 0.31-0.92 0.024
Diarrhoea 0.86 0.33-1.87 0.734
Hypertension 0.92 0.47-1.66 0.795
Other adverse events 1.02 0.60-1.78 0.926
Note and Abbreviations were the same as listed in Table 2.
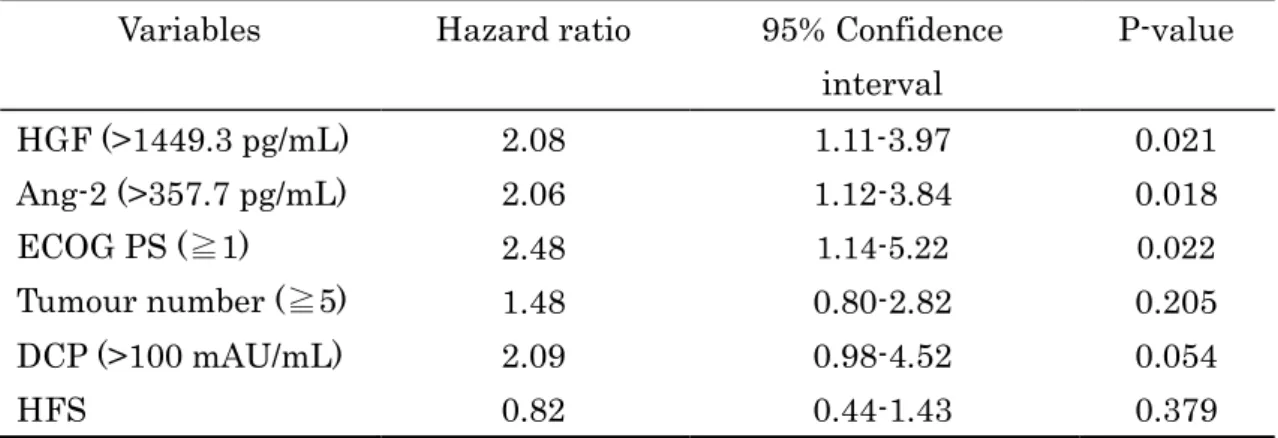
Table 4. Prognostic factors for overall survival (multivariate analysis)
Variables Hazard ratio 95% Confidence interval
P-value
HGF (>1449.3 pg/mL) 2.08 1.11-3.97 0.021
Ang-2 (>357.7 pg/mL) 2.06 1.12-3.84 0.018
ECOG PS (≧1) 2.48 1.14-5.22 0.022
Tumour number (≧5) 1.48 0.80-2.82 0.205
DCP (>100 mAU/mL) 2.09 0.98-4.52 0.054
HFS 0.82 0.44-1.43 0.379
Note and Abbreviations were the same as listed in Table 2.
Figure legends
Figure 1. Serum cytokine levels in patients with progressive disease (PD) and non-
PD. Median values of the PD group were greater than those of non-PD except FST
and PECAM-1; however, the differences were not statistically significant.
Horizontal bars in the boxes and the numbers indicate the median.
FST, Follistatin; G-CSF, granulocyte colony-stimulating factor; HGF, hepatocyte
growth factor; PDGF-BB, platelet-derived growth factor BB; PECAM-1, platelet
endothelial cell adhesion molecule-1; Ang-2, angiopoietin-2; VEGF, vascular
endothelial growth factor.
Figure 2. Survival of advanced HCC patients. Survival of the patients were short
when hepatocyte growth factor (HGF) was high (A), angiopoietin-2 (Ang-2) was high
(B), and performance status was poor (C).
Figure 3. Cytokines and post-progression survival. No difference of post-progression
survival was observed regardless of the level of serum hepatocyte growth factor
(HGF) at the time of progressive disease (PD) (A). However, post-progression
survival was significantly shorter in patients with high angiopoietin-2 (Ang-2) at the
time of PD (B).