Journal of Thermal Science and Technology
Airside heat transfer and pressure drop of an aluminum heat
exchanger having a new louver fin with leading edge extension
Nae-Hyun KIM*
*Department of Mechanical Engineering, Incheon National University, Incheon, Korea
Abstract
Conventional louver fins have an inherent problem of condensate drainage. In this study, a newly developed louver fin is introduced. The louver fin has an extension at leading edge. Dry and wet surface heat transfer and pressure drop characteristics of the heat exchanger made of the new fins were investigated, and results are compared with those having trailing edge extension fins or conventional fins. For conventional sample, significant differences between dry and wet j and f factors were observed. Dry j factors were 166% larger than wet j factors, and wet f factors were 68% larger than dry f factors. The discrepancies were significantly reduced for the samples having extensions, which suggests that extensions are effective in condensate control. The present sample having leading edge extension yielded higher dry j factors than the sample having trailing edge extension, probably due to proper allocation of louvers. Wet j factors of the two extended samples were approximately the same, which means that the condensate drainage is better for trailing edge extension than leading edge extension. Under dry condition, j/f1/3 of leading edge sample were 132 % and 59% higher than those of trailing edge extension and conventional sample respectively. However, under wet condition, j/f1/3 of leading edge extension sample were 87% and 205% higher than those of trailing edge extension and conventional sample. This confirms that the present leading edge extension sample shows better performance than trailing edge extension sample, both under dry and wet condition.
Nomenclature
A heat transfer area, m2
Ac cross-sectional area, m2
b slope of the saturation enthalpy – temperature line, J/ kg
K C heat capacity, J/K
sCw mass capacity, kg/s cp specific heat, J/kg
K Cr heat capacity ratio Dh hydraulic diameter, m f friction factor Fd fin depth, m H fin height, mh heat transfer coefficient, W/m2
Ki enthalpy, J/kg j Colburn j factor k thermal conductivity, W/m
K Kc contraction coefficient Ke expansion coefficient E-mail: [email protected]Received: 21 October 2020; Revised: 31 December 2020; Accepted: 26 January 2021
2 © 2021 The Japan Society of Mechanical Engineers [DOI: 10.1299/jtst.2021jtst0020]
Kim, Journal of Thermal Science and Technology, Vol.16, No.2 (2021)
Lp louver pitch, m
m
mass flow rate, kg/s NTU number of transfer unit Pr Prandtl number Q heat transfer rate, W Re Reynolds number T temperature, K t thickness, mU overall heat transfer coefficient, W/m2
KUw overall mass transfer coefficient, kg/m2
sV velocity, m/s Greek symbols
effectiveness Δp pressure drop, Pa fin efficiency kinematic viscosity, m2/s ρ density, kg/m3 σ contraction ratio Subscripts a air c core f fin i inside in inlet m middle max maximum o outside or overall out outlet r coolant t tube w water or wet1. Introduction
Brazed aluminum heat exchangers are widely used as condensers or evaporators of residential air-conditioners. Recent residential air conditioners operate all year long – as coolers for cooling season and as heaters for heating season. In this case, an outdoor heat exchanger becomes a condenser during cooling season, and becomes an evaporator during heating season. When an aluminum heat exchanger is used as an outdoor heat exchanger, one has to determine the heat exchanger (or flat tube) orientation – horizontal or vertical. Apparently, horizontal tube configuration is preferred for condenser application because refrigerant will naturally flow down the passage. With horizontal tube configuration, however, there is a problem when the heat exchanger is used as an evaporator. Airside condensate flow will be blocked by the tubes.
An outdoor evaporator has another concern in addition to condensate drainage, which is frosting. When an outdoor temperature drops below zero, frost may form on a fin surface. A rather simple idea of extending a frontal edge of the fin turned out to be very effective to improve frosting characteristics – longer operation time between defrosting cycles (Zhang and Hrnjak, 2009; Xu et al., 2015; Kim et al., 2016). The extended leading edge also improved a condensate drainage from the fin. Zhang and Hrnjak (2009) introduced a parallel louver fin (PF2), where arc-shaped rectangular louver fins are
connected to an upstream edge of 2.0 mm width as shown in Fig. 1(a). The fin pitch was controlled by triangular protrusions formed at each ends of the fin. An interesting feature of PF2 is that all the louvers are formed in a single direction. In general, louvers are formed in an opposite direction with a flow re-direction louver at the center. Under wet condition, significant reduction on airside pressure drop was possible for PF2 as compared with the sample having conventional louver fins (Zhang and Hrnjak, 2009). Subsequent studies by Zhang and Hrnjak (2010a, 2010b) showed that PF2 yielded longer operation time than the conventional louver fin sample under frosting condition.
The fin configuration tested by Xu et al. (2015) is shown in Fig. 1(b). They extended the windward and leeward ends of the fin. The extended leeward end was further machined to remove the crest and trough of the corrugation, which was expected to facilitate the drainage of the condensate. The improved design showed higher heat transfer and lower pressure drop characteristics under wet condition, and longer operation time under frosting condition than the sample having a primary wavy fin. Kim et al. (2016) could improve the frosting characteristics of a parallel flow heat exchanger by using an asymmetric louver fin, which had longer flat leading edge compared with a conventional louver fin (Fig. 1c). The extended leading edge was shown to improve the condensate drainage from the fin.
Recently, Kim and Cho (2018) introduced a different louver fin configuration, where flat extension was made at the trailing edge. Results showed that, under wet condition, j factor was 40% higher, and f factor was 9% lower compared with those of the conventional louver sample. No frosting data were reported. Considering that leading edge extension is preferred for frosting application, Kim and Cho’s (2018) fin appears to be limited to dehumidification. In this study, a new fin having an extension at the leading edge is proposed, with frosting application in mind. Although mitigation of frosting may be a main target, dry and wet surface heat transfer and pressure drop characteristics are also important because outdoor heat exchangers experience such conditions frequently during a yearly operation. Thus, in this study, a sample made of leading edge extension fin was tested under dry and wet condition. and the results are compared with those of a conventional fin and the trailing edge extension fin by Kim and Cho (2018).
2. Experiments
2.1 Geometry of the sample
Fig. 2 shows a sketch of the sample heat exchanger. The sample consisted of 24 rows of louver fins brazed to flat tubes. Sample height was 260 mm and sample width was 410 mm. Tube-side was circuited in a serpentine fashion with four rows per pass. This was necessary to increase the flow velocity in a tube. For an accurate assessment of air-side heat transfer coefficient from overall heat transfer coefficient (to be elaborated later), minimization of the tube-side thermal resistance is of necessity. In addition, possible concern on tube-side flow mal-distribution was alleviated by reducing the number of tubes per pass.
Geometric details of the new fin are shown in Fig. 3. Fins are folded perpendicular to the flow direction using narrow strips at front and rear of the fin. At downstream of the fin, 5 convex louvers are formed at an asymmetric pattern. Fin pitch was 1.4 mm, louver pitch was 1.0 mm and louver angle was 25o. One thing to be mentioned is two drainage holes machined
on the fin surface having a dimension of 2.5 mm by 1.0 mm. Also shown in Fig. 3 is a sketch of the trailing edge extension fin by Kim and Cho (2018). An asymmetric louver pattern with 7 louvers at upstream and 9 louvers at downstream is shown. Fin pitch was 1.3 mm, louver pitch was 1.1 mm and louver angle was 25o. Geometry of the conventional fin tested by Kim
et al. (2008) is also shown in Fig. 3. Fin pitch was 1.25 mm, louver pitch was 0.9 mm, louver length was 6.8 mm, louver angle was 22o and number of louvers was 32. Fig. 3 shows that geometric pattern of the present leading edge extension fin
and that of Kim and Cho’s (2018) trailing edge extension fin is entirely different. As discussed, main design focus of the present fin was frosting, and thus a geometry, which was expected to mitigate a frost build-up was preferred. Possible geometries went through serious computational fluid dynamic (CFD) simulations (Kim, 2019), and the geometry finally chosen was based on such considerations. On the other hand, Kim and Cho’s (2018) fin pattern was developed mainly from consideration of wet surface performance.
2 © 2021 The Japan Society of Mechanical Engineers [DOI: 10.1299/jtst.2021jtst0020]
Kim, Journal of Thermal Science and Technology, Vol.16, No.2 (2021)
(a) Zhang and Hrnjak (2009) (b) Xu et al. (2015)
(c) Kim et al. (2016)
Fig. 1 Previous investigations on fins having drainage channels.
Fig. 2 Sketch of the sample heat exchanger (unit: mm).
(a) New leading edge extension fin
(b) Trailing edge extension fin (Kim and Cho, 2018)
(c) Conventional fin (Kim et al. 2008) Fig. 3 Fin geometry of the present study.
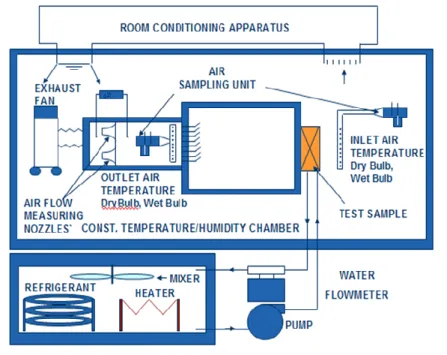
2.2 Experimental apparatus and method
A schematic drawing of the apparatus is shown in Fig. 4. Details of the apparatus, test procedure and data reduction methods are provided in Kim and Cho (2018), and only a short summary is provided here. The apparatus comprised of a suction-type wind tunnel and a water circulation unit. The apparatus was placed in a constant temperature and humidity chamber with sample mounted at inlet of the wind tunnel. Sample inlet and outlet temperatures were measured using a sampling rack following ASHRAE Standard 41.1 (1986). Water-side inlet condition was maintained using a constant temperature bath located at outside of the chamber. Temperatures were measured using pre-calibrated RTDs (Pt-100
sensors) with 0.1oC accuracy. Water flow rate was measured using a mass flow meter with 0.0015 liter/s accuracy, and air flow rate was measured following ASHRAE Standard 41.2 (1987). Airside pressure drop across the sample was measured using a differential pressure transducer with 1.0 Pa accuracy.
2 © 2021 The Japan Society of Mechanical Engineers [DOI: 10.1299/jtst.2021jtst0020]
Kim, Journal of Thermal Science and Technology, Vol.16, No.2 (2021)
at 35oC with 60% relative humidity. At this condition, samples were fully wet up to 2.0 m/s face air velocity. For dry
surface tests, water inlet temperature was maintained at 50oC and chamber temperature was maintained at 21oC with
60% relative humidity. Experiments were conducted varying the frontal air velocity from 0.75 m/s to 2.0 m/s for wet surface tests, and from 1.0 m/s to 2.5 m/s for dry surface tests. Energy balance between air-side and tube-side was within 2% for an air velocity larger than 1.0 m/s. It increased to 5% at the air velocity of 0.75 m/s. Uncertainty analysis was conducted following ASHRAE Standard 41.5 (1975), results are listed in Table 1. Major uncertainty on friction factor was the uncertainty of differential pressure measurement (10%), and major uncertainty on heat transfer coefficient (or j factor) was that of tube-side heat transfer correlation (10%). Uncertainties decreased as Reynolds number increased.
Fig. 4 Experimental apparatus. Table 1 Experimental uncertainties.
Parameter Max Uncertainties
Temperature ± 0.1oC
Differential pressure ± 1.0 Pa
Water flow rate ± 1.5 x 10⁻⁶ m3/s
ReLp ± 2.1%
f ± 10.3%
j ± 12.5%
3. Data Reduction
3.1 Dry surface
Total heat transfer rate was obtained from the average of Qa and Qw.
( a w) / 2 Q Q Q (1) , , ( ) a a pa a out a in Q m c T T (2) , , ( ) w w pw w in w out Q m c T T (3)
UA value was obtained from effectiveness and NTU method assuming unmixed-unmixed cross flow.
0.22 0.78 1 exp exp( r ) 1 r NTU C NTU C
(4) min( a in, w in, ) Q C T T (5) min max min[ , ] max[ , ] a pa w pw r a pa w pw m c m c C C C m c m c (6)Heat transfer coefficient, ho, was then calculated by subtracting water-side and wall resistances from total thermal resistance. 1 1 1 o o o i i t t t h A UA h A k A
(7)Here, Ao is the air-side heat transfer area, which includes both fin and tube area, Ai is the tube-side heat transfer area and At is the average of inner and outer tube-side area. Tube-side heat transfer coefficient, hi, was evaluated from Gnielinski (1976) correlation. , 2/ 3 , (Re 1000) Pr ( / 2) 1.0 12.7 / 2 (Pr 1) Dh i i i i i h i i i f k h D f
(8)
2 , 1.58 ln(Re 3.28) i Dh i f (9)2 © 2021 The Japan Society of Mechanical Engineers [DOI: 10.1299/jtst.2021jtst0020]
Kim, Journal of Thermal Science and Technology, Vol.16, No.2 (2021)
number was maintained at approximately 6,000, which was the maximum value available from the present test facility. Due to a small hydraulic diameter of the flat tube, it was very hard to increase the tube-side Reynolds number within permissible pressure loss. At the tube-side Reynolds number 6,000, however, tube-side thermal resistance was within 5% of the total thermal resistance. Surface efficiency o was obtained from Eq. (10).
1 f (1 ) o o A A (10)
Here, Af is the fin surface area. Fin efficiency is given as
tanh( )
2
2
mH
mH
(11) 2 (1 f ) o f f d t h m k t F (12)Here, Fd is flow depth of the fin. Heat transfer coefficient is traditionally presented as Colburn j factor as a function of Reynolds number. max ReLp V Lp (13) 2 / 3 max Pr o a m pa h j V c (14)
Here, Vmax is the velocity based on the minimum flow area. Friction factor was obtained from measured pressure drop.
2 2 2 max 2 [ ( 1 ) 2( 1) (1 ) ] ( ) c m in in in c e o in m out out A P f K K A V
(15)Here,
is the contraction coefficient at the inlet. In Eq. (15), Kc and Ke are coefficients for pressure loss at inlet and outlet of heat exchangers, and were evaluated at ReDh =
from Fig. 5-4 of Kays and London (1984).3.2 Wet surface
For reduction of wet surface heat transfer coefficients, the same procedure as dry surface heat transfer applies, except for several modifications. Major modifications are adoption of enthalpy difference and wet fin efficiency. Air-side heat transfer is obtained from Eq. (16), and effectiveness is defined as Eq. (17).
, , ( ) a a a out a in Q m i i (16) ,min( , , ) w a in w in Q C i i (17) ,min ,max min[ , ( / )] max[ , ( / )] a w pw r w r w a w pw r m m c b C C C m m c b (18)
Wet heat transfer coefficient, how, was then calculated by subtracting water-side and wall resistance from total thermal resistance. 1 w r t o ow o w i i t t b b b t h A U A h A k A
(19)The br, bt, and bw in Eq. (19) are slopes of saturated air enthalpy – temperature curves at mean coolant temperature, at mean tube wall temperature and at mean water film temperature on the air-side surface, and have the unit of J/kg
K. Note that Uw (unit: kg/m2
s) in Eq. (19) is overall mass transfer coefficient, and is different from overall heat transfer coefficient U (unit: W/m2
K). Wet surface heat transfer coefficient, how, includes the convection and the water film resistance.
1
ow pa w w o w h c t b h k
(20)Here, ho is the sensible heat transfer coefficient and tw is the mean water film thickness on air-side surface. In practice, tw/kw accounts for less than 5% of total air-side resistance, so it is negligible. Fin efficiency is given as
tanh( ) 2 2 mH mH (21) 2 (1 f ) ow f f d t h m k t F (22)
4. Results and Discussions
The j and f factors of the sample having a new fin with leading edge extension are shown in Fig. 5 along with those of the sample having a trailing edge extension (Kim and Cho, 2018) and a conventional fin (Kim et al. 2008). Both dry and wet
2 © 2021 The Japan Society of Mechanical Engineers [DOI: 10.1299/jtst.2021jtst0020]
Kim, Journal of Thermal Science and Technology, Vol.16, No.2 (2021)
data are shown. In Fig. 5 and subsequent figures, j and f factors are plotted as a function of ReLp (Reynolds number based on louver pitch). For all samples, j factors decreased, whereas f factors increased under wet condition as compared with those under dry condition. According to McLaughlin and Webb (2000), two different types of condensate formation is possible on a louvered surface – one formed between louvers (louver bridging), and the other formed between fins (fin bridging). Under louver bridging, both j and f factors decrease compared with those under dry condition. Under fin bridging, j factors may increase or decrease depending on the condensate pattern, however, f factors increase due to reduced flow area, increased surface roughness, etc. It appears that, for the present samples, both louver bridging and fin bridging occurred simultaneously (probably due to the highly humid condition at 35.5oC and 60% RH), and j factors decreased and f factors
increased under wet condition.
Fig. 5 shows that, for the conventional sample, significant differences between dry and wet j and f factors are observed. Dry j factors are 166% larger than wet j factors, and wet f factors are 68% larger than dry f factors. Different from the conventional sample, discrepancies between dry and wet j and f factors are not large for the samples having extensions. For the sample having trailing edge extensions, dry j factors are 13% larger than wet j factors, and wet f factors are 23% larger than dry f factors. For the new leading edge extension sample, discrepancies are somewhat larger. Dry j factors are 34% larger than wet j factors, and wet f factors are 38% larger than dry f factors. This significantly reduced difference for extended samples between dry and wet j and f factors suggests that extensions are effective in condensate control, especially for trailing edge extensions. One thing to be mentioned is that the present new fin with leading edge extension had two drainage holes of 2.5 mm by 1.0 mm (see Fig. 3a) formed on the fin root.
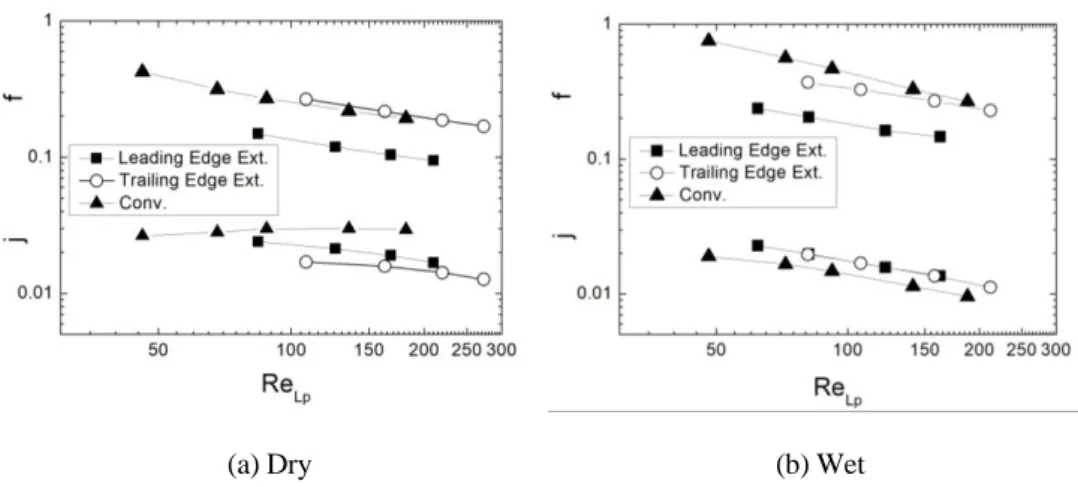
In Fig. 6, j and f factors are re-arranged to show the effect of fin pattern under dry and wet condition. Under dry condition, Fig 6(a) shows that j factor is the highest for conventional sample, followed by leading edge extension sample and then trailing edge extension sample. For a louvered surface, heat transfer is governed by louver-directed flow, and it is desirable to form as many louvers as possible on the fin surface. Thus, for conventional fin, 65% of the fin surface was louvered. For extended fins, the louvered portion decreased to 44% for trailing edge extension and 11% for leading edge extension fin. Furthermore, louver pitch of conventional fin is 0.9 mm with 1.25 mm fin pitch yielding Lp/Fp of 0.72, Lp/Fp of trailing edge extension fin is 0.85, and that of leading edge extension fin is 0.71. Louver angle of
conventional fin (21o) is smaller than those (25o) of extended fins. Generally, j and f factors increase as Lp/Fp or louver
angle increases (Davenport, 1983). It appears that, for the extended sample, decrease of louvered area of the fin was more influential than increase of Lp/Fp or louver angle, and yielded smaller j factors.
Fig 6(a) shows that j factors are higher for leading edge extension sample than trailing edge extension sample, although more area is louvered for the trailing edge extension sample. For trailing edge extension sample, the plain extended part is located at downstream of the fin, where heat transfer coefficient is low and enhancement is needed. On the other hand, for leading edge extension sample, the plain part is located at upstream of the fin, where heat transfer coefficient is already high, and generally no enhancement is necessary. Then, it appears that proper allocation of louvers of the leading edge extension sample yielded higher j factors compared with those of the trailing edge extension sample. Especially, convex louvers, which were chosen considering a relatively thick boundary layer approaching the louver, appeared to have dissipated the boundary layer effectively than the standard louver.
Fig. 6(a) shows that, under dry condition, f factors of leading edge extension fin are much smaller than those of trailing edge extension and conventional sample. The f factors of trailing edge extension sample are slightly (14%) larger than those of conventional sample. The high f factor of conventional sample may be due to large number of louvers (32) compared with those of extended samples (17 for trailing edge extension and 5 for leading edge extension sample). Low friction factor of the leading edge extension sample is noteworthy. As shown in Fig. 3, the louvered portion of leading edge extension fin is relatively small (11%) compared with other fin geometries, which appear responsible for the low friction factor.
In Fig. 6(b), j and f factors of three samples under wet condition are compared. The j factor trends under wet condition are entirely different from those under dry condition. Under wet condition, conventional sample yielded the lowest j factor, whereas they were the highest under dry condition. Then, why the trend is reversed? The significant reduction of j factors under wet condition may be due to louver-bridging by the condensate. If louvers are blocked by the condensate, most of the flow will be duct-directed, not through louvers (McLaughlin and Webb, 2000), and the heat transfer coefficient drops significantly. Fig. 6(b) shows that j factors of the extended samples are approximately the same. Under dry condition, leading edge extension sample yielded higher heat transfer coefficients. This result suggests that condensate drainage is better for trailing edge extension sample than leading edge extension sample. Comparison
of j factors between samples in Fig. 6 shows that leading edge/trailing edge extension suppress the performance degradation by condensate water. To illustrate the reason more clearly, conceptual sketches of condensate drainage across the fin are shown in Fig. 7. For extended fins, condensate is likely to flow along extended channels, not much blocked by tubes. On the other hand, condensate flow is blocked by tubes for conventional fin, which decreases the j factor and increases the f factor.
The wet surface friction factors shown in Fig. 6(b) show a similar trend as that the dry surface ones, although some increases under wet condition were noticed. Previously, we discussed the possibility of louver-bridging, especially for the conventional sample. As noted by McLaughlin and Webb (2000), louver-bridging itself reduce the friction factors by prohibiting louver-directed flow. Then, the increased the friction factor under wet condition may be explained by the fin-bridging with simultaneous louver bridging.
The heat transfer efficiency of the heat exchanger is commonly expressed by j/f1/3, which implies the heat transfer rate per unit pumping power (Webb and Kim, 2005). Fig. 8 compares j/f1/3 of the three samples under dry and wet condition. Limited data reveals that, under dry condition, j/f1/3 of leading edge extension sample is 132 % and 59% larger than those of trailing edge extension and conventional sample respectively. However, under wet condition, j/f1/3 of leading edge extension sample is 87% and 205% larger than those of trailing edge extension and conventional sample. This confirms that present leading edge extension sample yields better performance than trailing edge extension sample, both under dry and wet condition. However, considering that the amount of performance enhancement is decreased under wet condition (87%) than under dry condition (132%), it appears that condensate drainage is better for trailing edge extension fin. To summarize, j and f factors are affected by many geometric parameters, louver length, louver angle, louver pitch, etc. Leading edge extension appears beneficial to heat transfer than trailing edge extension because it is located at the high heat transfer region. In other aspect, leading edge extension is known to be adequate to frosting and trailing edge extension is proper for condensate drainage. The present results showed that leading edge extension yielded higher performance, especially under dry condition. Due to the difference in louver configuration between leading edge and trailing edge extension fin, it is not proper to mention that location of the extension is the reason for the performance improvement. The improvement may partly be due to location of extension and partly be due to improved louver configuration. Future research will be directed to the frosting characteristics of the leading edge extension sample.
(a) Leading edge extension (b) Trailing edge extension (c) Conventional Fig. 5 j and f factors of the three samples under the dry and the wet condition.
2 © 2021 The Japan Society of Mechanical Engineers [DOI: 10.1299/jtst.2021jtst0020]
Kim, Journal of Thermal Science and Technology, Vol.16, No.2 (2021)
(a) Dry (b) Wet
Fig. 6 j and f factors vs. ReLp under the dry and the wet condition for the three samples.
(a) Conventional (b) Leading edge extension (c) Trailing edage extension Fig. 7 Conceptual sketch of condensate flow pattern along the fins.
(a) Dry (b) Wet Fig. 8 j/f1/3 under the dry and the wet condition for the three samples.
5. Conclusions
In this study, a newly developed louver fin having leading edge extension was introduced. Dry and wet surface heat transfer and pressure drop characteristics of the heat exchanger made of the new fins were investigated, and results were compared with those having trailing edge extension fins or conventional fins. Listed below are major findings.
(1) For the conventional sample, significant differences between dry and wet j and f factors were observed. Dry j factors were 166% larger than the wet j factors, and wet f factors were 68% larger than dry f factors. The discrepancies were significantly reduced for samples having extensions, which suggests that the extensions are effective in condensate control.
(2) The present sample having leading edge extension yielded higher dry j factors than the sample having trailing edge extension, probably due to better extension position and better allocation of louvers.
(3) Wet j factors of the two extended samples were approximately the same. This means that condensate drainage is better for trailing edge extension than leading edge extension.
(4) Under dry condition, j/f1/3 of leading edge extension sample was 132% and 59% larger than those of trailing edge extension and conventional sample respectively. However, under wet condition, j/f1/3 of leading edge extension sample was 87% and 205% larger than those of trailing edge extension and conventional sample. This confirms that present leading edge extension sample yields better performance than trailing edge extension sample, both under dry and wet condition.
References
ASHRAE Standard 41.1, Standard Method for Temperature Measurement, ASHRAE (1986). ASHRAE Standard 41.2, Standard Method for Laboratory Air-Flow, ASHRAE (1987).
ASHRAE Standard 41.5, Standard Measurement Guide, Engineering Analysis of Experimental Data, ASHRAE (1975). Davenport, C. J., Correlation of heat transfer and flow friction characteristics of louvered fin, AIChE Symp. Ser., Vol.
79 (1983), pp. 19-27.
Gnielinski, V., New equation for heat and mass transfer in turbulent pipe and channel flow, Int. Chem. Eng., Vol. 16 (1976), pp. 359-368.
Kays, W. M. and London, A. L., Compact Heat Exchangers, 3rd Ed., McGraw-Hill (1984).
Kim, M.-H., Kim, H., Kim, D. R. and Lee, K. S., A novel louver fin design to enhance thermal and drainage performances during periodic frosting/defrosting conditions, Energy Conversion and Management, Vol. 110 (2016) pp. 494-500.
Kim, N.-H., Private communication with Samsung Electronics (2019)
Kim, N.-H. and Cho, H., Airside heat transfer and pressure drop of louver-finned parallel flow heat exchanger having a drainage channel, Journal of Thermal Science and Technology, Vol. 13, No. 1 (2018) DOI:10.1299 /jtst.2018jtst0018
Kim, N.-H., Kim, D.-Y. and Hwang, J.-H., Wet surface heat transfer and pressure drop of aluminum parallel flow heat exchangers at different inclination angles, J. Mech. Sci. Tech., Vol. 22 (2008), pp. 1-11.
McLaughlin, W. J. and Webb, R. L., Condensate drainage and retention in louver fin automotive evaporators, SAE Technical Paper Series (2000), Paper No. 2000-01-0575.
Webb, R. L. and Kim, N.-H., Principles of Enhanced Heat Transfer, 2nd Ed., Taylor and Francis Pub. (2005).
Zhang, P. and Hrnjak, P., Air-side performance evaluation of three types of heat exchangers in dry, wet and periodic frosting conditions, Int. J. Refrig., Vol. 32 (2009), pp. 911-921.
Zhang, P. and Hrnjak, P., Effect of some geometric parameters on performance of PF2 heat exchangers in periodic frosting, Int. J. Refrig., Vol. 33 (2010a), pp. 334-346.
Zhang, P. and Hrnjak, P., Air-side performance of a parallel-flow parallel-fin (PF2) heat exchanger in sequential frosting, Int. J. Refrig., Vol. 33 (2010b), pp. 1118-1128.