ORIGINAL ARTICLE
Left Ventricular Mechanical Dyssynchrony after Acute Myocardial Infarction Assessed by CardioGRAF Analysis
Is a Predictor of Subsequent Cardiac Events
Makito Sato, MD1), Takuji Toyama, MD2), Shu Kasama, MD1),
Hiroshi Hoshizaki, MD2), Shigeru Oshima, MD2)and Masahiko Kurabayashi, MD1) Received: June 7, 2016/Revised manuscript received: February 9, 2017/Accepted: February 15, 2017 J-STAGE Advance published: August 10, 2017
○CThe Japanese Society of Nuclear Cardiology 2017
Abstract
Objective: Left ventricular mechanical dyssynchrony (LVMD) is associated with deterioration of systolic function and adverse clinical outcomes. This study investigated whether LVMD influenced subsequent cardiac events (CEs), including cardiac death, recurrent nonfatal myocardial infarction, hospitalization for heart failure, and ventricular tachycardia/ventricular fibrillation in patients with acute myocardial infarction (AMI).
Methods: Two hundred and six AMI patients aged 64±11 years (163 men) who underwent successful percutaneous coronary intervention between April 1998 and December 2007 were enrolled. All patients received myocardial 99mTc-sestamibi or 99mTc-tetrofosmin perfusion imaging at rest, and the total defect score was calculated as the sum of the defect scores in 17 standard myocardial segments. Indicators of left ventricular (LV) function were acquired with quantitative gated SPECT software, including the LV end-diastolic volume (LVEDV), LV end-systolic volume (LVESV), and LV ejection fraction (LVEF). Then the LVMD index was evaluated by using CardioGraf software.
Results: The follow-up period was 63±31 months. Cardiac events (CEs) occurred in 30 patients, including 15 patients hospitalized for congestive heart failure, 8 patients with recurrent AMI, 4 patients with ventricular tachycardia, and 3 patients with cardiac death. These patients were classified as the CE group, while the other 176 patients without CEs formed the non-CE group. According to univariate analysis with the Cox proportional hazards model, the maximum creatine kinase, frequency of multivessel disease (2-vessel or 3-vessel disease), total defect score, LVEDV, LVESV, and dyssynchrony index were all significantly higher in the CE group than the non-CE group. In contrast, LVEF and the peak ejection rate were significantly lower in the CE group than in the non-CE group. Multivariate analysis showed that multivessel disease (p=0.003) and the LVMD index (p=0.047) were independent prognostic factors for CEs.
Conclusion: LVMD contributes to the risk of subsequent cardiac events in AMI patients.
Keywords: Acute myocardial infarction, Gated myocardial perfusion SPECT, Left ventricular mechanical dyssynchrony
Ann Nucl Cardiol 2017;3(1):20-28
I
t has been demonstrated that detection of left ventricular mechanical dyssynchrony (LVMD) by echocardiography can provide prognostic information in patients with acute coronary syndrome (1). Phase analysis on gated SPECT showsa good correlation with speckle tracking echocardiography and is suitable for assessment of LVMD (2). In addition, Civa et al.
reported that LVMD measured by tissue Doppler imaging echocardiography in patients with acute ST elevation
doi: 10.17996/anc.17-00002
1) Makito Sato, Shu Kasama, Masahiko Kurabayashi
Department of Medicine and Biological Science, Gunma University Graduate School of Medicine, 3-39-15 Showa-machi, Maebashi, Gunma, Japan 371-8511
E-mail: [email protected]
2) Takuji Toyama, Hiroshi Hoshizaki, Shigeru Oshima
Division of Cardioligy, Gunma Prefectural Cardiovascular Center, Maebashi, Japan
myocardial infarction (STEMI) undergoing primary percu- taneous intervention is a prognosticfactor for LV dilation and deterioration of LV systolicand diastolicfunction during follow-up for 6 months (3). It has also been reported that LVMD assessed by gated SPECT phase analysis is an independent predictor of death in patients with advanced coronary artery disease (4).
After STEMI, patients develop LVMD on gated SPECT phase analysis without evidence of electrical dyssynchrony and improvement of this LVMD is correlated with beneficial ventricular remodeling (5). So, assessment of LVMD is thought to be important for risk classification and careful follow up in patients after AMI. But there are few studies to validate whether LVMD assessed by SPECT phase analysis affects their prognosis in patients after AMI.
In the present study, we retrospectively investigated whether LVMD measured by gated SPECT phase analysis was a predictor of cardiac events in patients with acute myocardial infarction (AMI), including cardiac death, recurrent nonfatal myocardial infarction, hospitalization for heart failure, and ventricular tachycardia (VT) or ventricular fibrillation (VF).
Materials and methods Study population and protocol
This study included patients with AMI who underwent successful percutaneous intervention (PCI) at Gunma Prefec- ture Cardiovascular Center between April 1998 and December 2007. A total of 347 patients underwent myocardial 99mTc- sestamibi or99mTc-tetrofosmin perfusion imaging at rest in the subacute phase (3-30 days after the onset) of AMI. Baseline data were extracted from the medical records with regard to hypertension, diabetes mellitus, hyperlipidemia, smoking, and body mass index in the acute and subacute phases of AMI.
Among the 347 patients, 117 patients were ineligible for this study because of the lack of important clinical data (such as SPECT findings or the past medical history) and 15 patients were excluded because the follow-up period was too short (<12 months). We defined cardiac events (CE) as cardiac death, recurrent AMI, hospitalization for heart failure, symptomaticVT or VF requiring an implantable cardioverter defibrillator, or antiarrhythmictherapy for sustained VT.
Informed consent was not obtained because this was a retrospective study. We determined the current status of patients from the medical records, or we sent a letter informing the patient about this study and asking their status if there was no current information in the record. We failed to obtain information about the current status of 9 patients. As a result, 206 patients were investigated. This study was approved by the Ethical Review Board of Gunma Prefecture Cardiovascu- lar Center. All procedures were in accordance with the ethical standards of this committee and with the 1964 Declaration of
Helsinki and its later amendments or comparable ethical standards.
Myocardial perfusion imaging
Patients underwent myocardial perfusion imaging with
99mTc-sestamibi (MIBI, n=127) or99mTc-tetrofosmin (TF, n=
79) at rest in the subacute phase of AMI. Each patient received an intravenous injection of 740 MBq of99mTc-MIBI or99mTc- TF, and gated SPECT images were acquired after 30 min.
Myocardial SPECT imaging was performed using a three- headed IRIX SPECT system (Picker, Cleveland, OH) with low-energy, all-purpose resolution, parallel-hole collimators.
The detector system was linked to a dedicated nuclear medicine computer. A total of 72 projection images were obtained over a 360°arcin 5°increments, with acquisition for 40 s/view for99mTc-MIBI. Data were recorded on a 64×64 pixel matrix, and short-axis and long-axis slices (5. 4 mm thick) were generated. Regional tracer uptake was scored semiquantitatively on a five-point scale: 0) normal uptake; 1) slightly reduced uptake; 2) moderately reduced uptake; 3) severely reduced uptake; and 4) no uptake. The total defect score was calculated as the sum of the scores for all 17 segments.
All patients were in sinus rhythm during image acquisition.
Commercially available quantitative gated SPECT software (Cedars-Sinai Medical Center, Los Angeles, CA) with a temporal resolution of 16 frames per RR interval was used to create a 3-dimensional cine mode display. Then this cine mode display was employed to calculate the left ventricular ejection fraction (LVEF), left ventricular end-diastolic volume (LVEDV), left ventricular end-systolic volume (LVESV), peak ejection rate, peak filling rate (PFR), and time to peak filling (TPF) throughout the cardiac cycle by using an automaticedge detection algorithm (6-8).
Image analysis
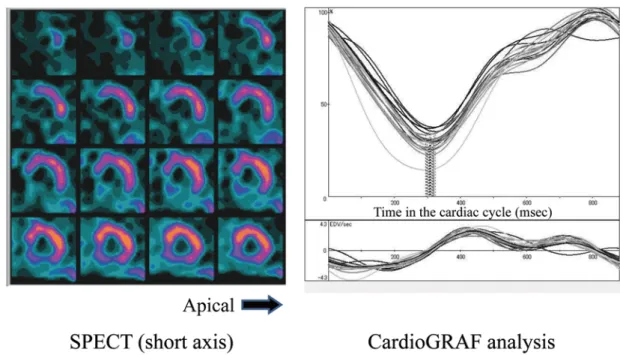
Perfusion and function assessment for myocardial SPECT (p-FAST2, Sapporo Medical University, Japan) is a free software program for quantitative analysis of myocardial perfusion and left ventricular function (6). After obtaining short axial SPECT images in each of the 16 periods of the cardiac cycle by the above-mentioned method, we determined the endocardial contour with p-FAST software. After we determined the image mode processing range of this program, abstraction of the endocardial contour was performed automatically.
We also used the free CardioGRAF software program (Fujifilm RI Pharma Co., Ltd. Japan) to compute the timing and visualize regional LV contraction as time-volume curves.
This program allowed us to draw time-volume curves for each of the 17 segments by performing Fourier transformation to
improve temporal resolution (6, 7). Next, we determined the time to end-systole in each segment and calculated its standard deviation (SD). Finally, we obtained the dyssynchrony index (DI), after correcting the SD of the time to end-systole by the heart rate using the following formula:
DI=SD×100/RR (milliseconds) (8).
Statistical analysis
Continuous variables are expressed as the mean+/-SD, and categorical variables are presented as percentages.
Statistical analysis was performed with SPSS software (ver.
22; IBM, Armonk, NY, USA). The unpaired two-tailed t-test was used for comparisons between the CE and non-CE groups.
Cox proportional hazard models were employed to identify variables with a significant influence on CE, and only
variables showing p<0.1 were considered in the multivariate analysis. Kaplan-Meier curves were drawn to estimate the prognosis. For all analyses, p<0.05 was considered statistical- ly significant.
Results
The follow-up period was 63+/-31 months. CEs occurred in 30 patients, including 15 patients hospitalized for congestive heart failure, 8 patients with recurrent AMI, 4 patients with VT (no VF was observed), and 3 patients with cardiac death.
These 30 patients were classified as the CE group, while the other 176 patients without cardiac events during the observation period formed the non-CE group.
Baseline clinical characteristics of the two groups are summarized in Table 1. The mean age of the patients was Table 1 Study Population, CE group vs. non-CE group
Student’s T-test
Parameters CE group (n=30) non-CE Group (n=176) P value
Age (years) 64.4+/-11.9 63.9+/-10.8 0.801
Male sex, n (%) 25 (83.0) 138 (78.9) 0.530
Body mass index 22.5+/-3.0 23.7+/-3.7 0.107
Maximum Creatine kinase (U/L) 4140+/-3115 3169+/-2172 0.079
Recanal time, h 9.7+/-13.4 6.9+/-8.2 0.162
From onset to SPECT, day 12.3+/-9.6 10.2+/-14.1 0.460
Diabetes Mellitus, n (%) 11 (36.7) 59 (33.5) 0.738
Dyslipidemia, n (%) 13 (14.3) 103 (58.9) 0.115
Hypertension, n (%) 19 (63.3) 119 (67.4) 0.662
Currest smoker, n (%) 17 (56.0) 95 (54.2) 0.801
QRS duration time (msec) 107.8+/-22.8 99.2+/-15.7 0.032
Multiple Diseased Vessels, n (%) 14 (46.7) 44 (25.0) 0.034
Medication
β-blocker, n (%) 13 (43.3) 63 (36.0) 0.048
ACE/ARB, n (%) 23 (76.7) 144 (82.2) 0.682
Ca chanel blocker, n (%) 6 (20.0) 31 (17.6) 0.702
Nitrates, n (%) 8 (26.7) 35 (20.0) 0.364
DAPT, n (%) 26 (86.7) 166 (94.9) 0.314
SPECT
TDS 16.7+/-10.8 11.2+/-8.6 0.002
LVEDV (ml) 133+/-55.5 108+/-31.5 0.020
LVESV (ml) 82.3+/-45.1 54.9+/-24.8 0.003
LVEF (%) 42.7+/-12.4 50.6+/-10.4 <0.001
PER(EDV/sec) 2.37+/-0.9 2.78+/-1.0 0.041
PFR (EDV/sec) 1.87+/-0.6 2.06+/-0.7 0.162
TPF (msec) 183+/-102 177+/-121 0.763
mean TES (msec) 305+/-150 278+/-61 0.346
Standard Deviation of TES 60.0+/-55.6 36.2+/-38.2 0.030
DI 7.68+/-6.83 4.47+/-4.50 0.018
R-R interval (msec) 823+/-181 820+/-171 0.932
Data are expressed as means+/-SD (%).
ACE: angiotensin converting enzyme; ARB: angiotensin II receptor blocker;
DAPT: dual antiplatelet therapy; MVD: multi vessel disease (2 Vessel Disease or 3 Vessel Disease);
TDS: total defect score; LVEDV: left ventricular end diastolic volume;
LVESV: left ventricular end systolic volume; LVEF: left ventricular ejection fraction;
PER: peak ejection rate; PFR: peak filling rate; TPF: time to peak filling; TES: time to end systole;
DI: dyssynchrony index
64+/-11 years, and 163 patients (79%) were men. There were no significant differences between the two groups with regard to age, sex, BMI, and the prevalence of diabetes mellitus, dyslipidemia, hypertension, or smoking. There were also no significant differences in the time from onset of AMI to recanalization (p=0.162) or the number of days from onset of AMI to performance of SPECT (p=0.460). The maximum creatine kinase level showed no significant difference between the CE group and the non-CE group (p=0.079). We classified the patients into 2 groups based on the number of vessels involved, which were 1-vessel disease vs. a combination of 2- vessel disease and 3-vessel disease (multivessel disease). The CE group had a higher proportion of patients with multivessel disease than the non-CE group (p=0.034). Complete right bundle branch block was found in 6 patients from the non-CE group, but did not occur in the CE group, while complete left bundle branch block was identified in 2 patients from the CE group and was not seen in the non-CE group. QRS duration was significantly longer in the CE group than the non-CE group (p=0.032), and use ofβ-blockers was significantly more frequent in the CE group than in the non-CE group (p=
0.048).
Table 1 also shows the SPECT, quantitative gated SPECT, and CardioGRAF parameters of both groups.
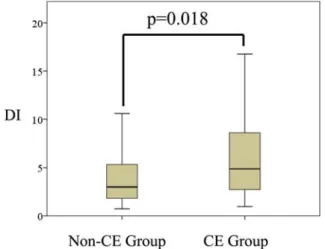
The CE group had a significantly higher total defect score (p=0. 002), LVEDV (p=0. 020), LVESV (p=0. 003), peak ejection rate (p=0.041), and DI (p=0.0018, Fig. 1) compared with the non-CE group. In addition, the CE group had a significantly smaller LVEF than the non-CE group (p<0.001).
Cox proportional hazard models were employed for univariate and multivariate analyses in order to identify independent prognosticfactors for CEs after AMI. The results of univariate analysis are summarized in Table 2. According to univariate analysis, the maximum creatine kinase (p=0.021),
multivessel disease (p=0.015), total defect score (p=0.001), LVEDV (p<0.001), LVESV (p<0.001), LVEF (p<0.001), peak ejection rate (p=0.028), SD (p=0.003), and DI (p=0.005) were predictors of CEs. QRS duration (p=0. 070) and β- blocker use (p=0. 257) showed a significant difference between the two groups by Student’s t-test, but were not significant predictors according to Cox proportional hazards analysis. Variables showing p<0.1 in univariate analysis were selected for multivariate analysis, including the QRS duration, multivessel disease, maximum creatine kinase, total defect score, LVEDV, LVESV, peak ejection rate, and DI. The results of multivariate analysis are summarized in Table 3.
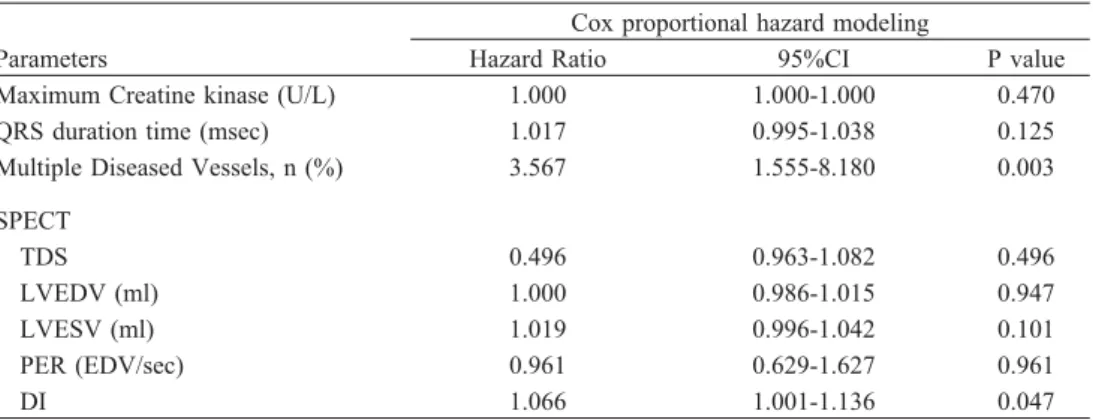
Both multivessel disease (p=0.003) and DI (p=0.047) were found to be independent prognosticfactors for CEs, while the maximum creatine kinase (p=0. 470), QRS duration (p= 0.125), total defect score (p=0.496), EDV (p=0.947), ESV (p=0. 101), and peak ejection rate (p=0. 961) were not significant predictors.
Next, a receiver operating characteristic (ROC) curve was drawn for the relation between DI and CE, revealing that the area under the curve was 0.653 (Fig. 2). Then Youden’s index was determined to identify the optimum DI threshold for predicting CEs, and we found that DI≥4 could predict CEs with a sensitivity of 0.67 and a specificity of 0.64. When we defined severe LVMD as DI≥4 (n=82) and mild LVMD as DI
< 4 (n= 124), Kaplan-Meier analysis demonstrated that patients with severe LVMD had a significantly worse prognosis than patients with mild LVMD (p<0.001, log-rank test; Fig. 3).
Representative examples of mild and severe LVMD are shown in Fig. 4-7.
Discussion
This study demonstrated that LVMD in the subacute phase of AMI is a valuable predictor of subsequent CEs, including chronic heart failure, recurrent AMI, ventricular arrhythmias, and cardiac death. LVMD measured by tissue Doppler imaging has been reported to be a predictor of LV remodeling (9). Though the echocardiography field has made various advances, many echocardiographic clinical studies of LVMD have yielded negative results (11-12). Several investigations of cardiac resynchronization therapy in patients with systolic heart failure, a narrow QRS complex, and LVMD on echocardiography have been terminated prematurely because cardiac resynchronization showed no benefit and was possibly harmful (10-12).
Nuclear imaging techniques have been adopted relatively recently for assessment of LVMD. The chief advantages of gated SPECT are excellent repeatability and reproducibility owing to automated processing of digital data (13). SPECT data are averaged over thousands of cardiac cycles, while Fig. 1 DI in the CE group and the non-CE group
DI was significantly higher in the CE group than the non-CE group (p=0.0018).
CE: cardiac event; DI: dyssynchrony index
echocardiographic data are derived from only a single cardiac cycle (14). It is still unclear whether LVMD determined by gated SPECT is a good indicator for cardiac resynchronization therapy, but it may be a useful prognosticfactor.
In patients with heart failure, Nagao et al. analyzed LVMD by cine-tagged MRI and revealed that basal/apical dyssyn- chrony is an independent predictor of major adverse cardiac events, although septal/lateral dyssynchrony is not (15). We did not precisely assess LVMD geometry in the present study, but patients with the LAD as the culprit vessel would be expected to have basal/apical dyssynchrony, and they were more likely to show larger LVMD (n=120, number of DI≥4 patients=62) than patients with non-LAD culprit vessels (n=
86, number of DI≥4 patients=20) (p<0.001, chi-square test).
In our study, recurrent AMI was classified as one of the major CEs. Studies using tissue Doppler echocardiography have shown that diastolicdysfunction is correlated with LV remodeling and recurrent myocardial ischemia in patients with unstable angina (16), but no previous study has revealed a relation between LVMD and recurrent AMI, although multivessel disease is reported to be a predictor of reinfarction after AMI (17). In the present study, a higher proportion of patients with recurrent AMI had multivessel disease (4/8 patients) than patients without recurrent AMI (54/198 patients). Though there was no significant difference in the frequency of multivessel disease between these groups (p=
0.07 by the chi-square test with Yates’ correction), such disease may influence the recurrence of CEs. In our study, Table 2 Univariate analysis, CE group vs. non-CE group
Cox proportional hazard modeling
Parameters Hazard Ratio 95%CI P value
Age (years) 1.006 0.973-1.040 0.739
Male sex, n (%) 0.664 0.254-1.740 0.405
Body mass index 0.933 0.835-1.042 0.217
Maximum Creatine kinase (U/L) 1.000 1.000-1.000 0.021
Recanal time, h 1.024 0.994-1.055 0.120
From onset to SPECT, day 1.005 0.998-1.022 0.573
Diabetes Mellitus, n (%) 1.189 0.566-2.499 0.648
Dyslipidemia, n (%) 1.666 0.808-3.435 0.167
Hypertension, n (%) 0.867 0.412-1.823 0.707
Currest smoker, n (%) 0.890 0.425-1.863 0.757
QRS duration time (msec) 1.018 0.999-1.037 0.070
Multiple Diseased Vessels, n (%) 2.450 1.194-5.029 0.015
Medication
β-blocker, n (%) 1.539 0.730-3.242 0.257
ACE/ARB, n (%) 1.302 0.619-2.738 0.486
Ca chanel blocker, n (%) 1.170 0.474-2.886 0.733
Nitrates, n (%) 1.281 0.560-2.928 0.558
DAPT, n (%) 1.170 0.474-2.886 0.733
SPECT
TDS 1.069 1.028-1.111 0.001
LVEDV (ml) 1.017 1.009-1.026 <0.001
LVESV (ml) 1.024 1.015-1.033 <0.001
LVEF (%) 0.933 0.900-0.966 <0.001
PER (EDV/sec) 0.613 0.397-0.947 0.028
PFR (EDV/sec) 0.635 0.357-1.131 0.123
TPF (msec) 1.000 0.997-1.003 0.900
mean TES (msec) 1.003 1.000-1.006 0.059
Standard Deviation of TES 1.008 1.003-1.013 0.003
DI 1.072 1.021-1.126 0.005
R-R interval (msec) 1.000 0.998-1.002 0.908
Data are expressed as means+/-SD (%).
ACE: angiotensin converting enzyme; ARB: angiotensin II receptor blocker; DAPT: dual antiplatelet therapy;
MVD: multi vessel disease (2 Vessel Disease or 3 Vessel Disease); TDS: total defect score;
LVEDV: left ventricular end diastolic volume; LVESV: left ventricular end systolic volume;
LVEF: left ventricular ejection fraction; PER: peak ejection rate; PFR: peak filling rate;
TPF: time to peak filling; TES: time to end systole; DI: dyssynchrony index
ventricular arrhythmias were also included among CEs. Hage et al. reported that LVMD is independently associated with the potential for sudden cardiac death in patients with systolic heart failure (18). In addition, Aljaroudi et al. reported that the severity of LVMD (evaluated by phase analysis of gated SPECT images) was associated with the risk of cardiac death and appropriate shock responses in patients with an implantable cardioverter defibrillator (19). On the other hand, LVMD did not predict ventricular arrhythmias with/without death in patients who had mild heart failure with or without left bundle branch block (LBBB) in the MADIT-CRT trial (20). However, if LVMD is correlated with progression of LV remodeling after AMI, the risk of ventricular arrhythmia may possibly be increased. Turan et al. reported that LVMD was a strong predictor of LV remodeling after acute AMI (21). Also,
a recent study employing speckle tracking echocardiography revealed that LVMD is independently associated with VT after AMI (22).
Because we did not analyze changes of LVMD during the follow-up period, it is not clear whether improvement of LVMD can contribute to reduction of CEs. However, some previous studies have shown that LVMD evaluated by phase analysis improves within six months after revascularization in AMI patients and that dyssynchrony parameters are not independent predictors of adverse LV remodeling (23).
Hida et al. reported that stress-induced LVMD assessed by phase analysis is of diagnosticvalue in patients with multivessel disease (24). Tanaka et al. also reported that ATP- Table 3 Multivariate analysis CE group vs. non-CE group
Cox proportional hazard modeling
Parameters Hazard Ratio 95%CI P value
Maximum Creatine kinase (U/L) 1.000 1.000-1.000 0.470
QRS duration time (msec) 1.017 0.995-1.038 0.125
Multiple Diseased Vessels, n (%) 3.567 1.555-8.180 0.003
SPECT
TDS 0.496 0.963-1.082 0.496
LVEDV (ml) 1.000 0.986-1.015 0.947
LVESV (ml) 1.019 0.996-1.042 0.101
PER (EDV/sec) 0.961 0.629-1.627 0.961
DI 1.066 1.001-1.136 0.047
Data are expressed as means+/- SD (%) .
MVD: multi vessel disease (2 Vessel Disease or 3 Vessel Disease) TDS: total defect score; LVEDV: left ventricular end diastolic volume;
LVESV: left ventricular end systolic volume; LVEF: left ventricular ejection fraction;
PER: peak ejection rate; DI: dyssynchrony index
Fig. 2 ROC curve for the relation between DI and CEs The area under the curve was 0.653.
CEs: cardiac events; DI: dyssynchrony index
Fig. 3 Prognosis after AMI in patients with mild or severe LVMDThe Kaplan-Meier curve for CE-free survival after AMI indicates that patients with severe LVMD have a significantly worse prognosis than those with mild LVMD (p<0.001).
AMI: acute myocardial infarction; CE: cardiac events, including chronic heart failure, recurrent AMI, ventricular arrhythmias, and cardiac death; LVMD: left ventricular mechanical dyssynchrony
induced LVMD is useful for diagnosis of multivessel disease (25). In the present study, both groups had patients with multivessel disease and all SPECT data were obtained before PCI for residual stenosis. However, it was considered that there was little risk of overestimating LVMD caused by non- culprit vessels, because we evaluated LVMD without stressors
such as exercise or dobutamine.
This study had several limitations.
First, CardioGRAF is designed to automatically assess LVMD, but we often encountered difficulty in determining whether the p-FAST program traced the inner contour Fig. 4 A case of Mild LVMD
A 64-year-old woman had a lesion in the distal left circumflex artery (the right coronary artery was hypoplastic).
SPECT shows a perfusion defect in the inferior wall. There were no cardiac events during the observation period.
CardioGRAF analysis of 17 segmental curves demonstrated synchronous contraction (ejection fraction: 61%, DI: 1.02).
Dotted line indicates the end-systolic period in each of the 17 segments.
Fig. 5 A case of Severe LVMD
A 56-year-old man had a lesion in the proximal left anterior descending artery. SPECT showed a broad perfusion defect in the anterior wall. He developed VT at 16 months after AMI and received implantation of a cardioverter defibrillator. CardioGRAF analysis showed scattering of the end-systolic time in each segment, indicating severe LVMD (ejection fraction: 34%, DI: 11.0).
correctly on images of the defect segment. It is possible that the influence of non-viable segments led to apparent worsening of LVMD, but relationship between the total defect score and DI was weak (r=0.269 by single regression analysis, dependent variable: DI, coefficient B=0.149, 95% CI: 0.075- 0.223, p<0.001). Also, we assessed the reproducibility of DI and found that the intra-observer intraclass correlation coefficient was 0.746 (95%CI: 0.612-0.834) and the inter- observer coefficient was 0.711 (95% CI: 0.557-0.812), which were acceptable results.
Another limitation is that we did not discriminate between LVMD and LV electrical dyssynchrony. In fact, the CE group included 6 patients with LBBB, while there were none in the non-CE group, indicating that electrical dyssynchrony would have made a contribution to LVMD. However, LV remodeling is associated with LV electrical dyssynchrony, so it is unclear whether electrical dyssynchrony should be distinguished from LVMD.
Furthermore, we did not assess other LVMD parameters such as bandwidth because of lack of data, although bandwidth is thought to be a prognosticindicator in patients with coronary artery disease (26).
Moreover, the CE group (n=30) may have been too small for multivariate analysis, so a larger study will be needed to confirm our results.
Finally, this was a retrospective single-center study, which means that prospective investigation is needed to better define the relationship between LVMD and major adverse cardiac events.
Conclusion
In patients with subacute AMI, CardioGRAF evaluation of LVMD can provide important information for predicting CEs, including chronic heart failure, recurrent AMI, ventricular arrhythmias, and cardiac death.
Acknowledgments
We thank Mr. Toshihiko Ino, Mr. Mizuki Mochiki, and Ms.
Megumi Kano for their technical assistance.
Sources of funding None.
Conflicts of interest None.
Reprint requests and correspondenc:
Makito Sato, MD
Department of Medicine and Biological Science Gunma University Graduate School of Medicine, 3-39-15 Showa- machi, Maebashi, Gunma, Japan 371-8511
E-mail: [email protected]
References
1. Pavel DG, Byrom E, Lam W, et al. Detection and quantification of regional wall motion abnormalities using phase analysis of equilibrium gated cardiac studies. Clin Nucl Med 1983; 8: 315-21.
2. Hsu TH, Huang WS, Chen CC, et al. Left ventricular systolic and diastolicdyssynchrony assessed by phase analysis of gated SPECT myocardial perfusion imaging: a comparison with speckle tracking echocardiography. Ann Nucl Med 2013; 27:
764-71.
3. Siva Sankara C, Rajasekhar D, Vanajakshamma V, et al.
Prognostic significance of NT-proBNP, 3D LA volume and LV dyssynchrony in patients with acute STEMI undergoing primary percutaneous intervention. Indian Heart J 2015; 67:
318-27.
4. Uebleis C, Hellweger S, Laubender RP, et al. Left ventricular dyssynchrony assessed by gated SPECT phase analysis is an independent predictor of death in patients with advanced coronary artery disease and reduced left ventricular function not undergoing cardiac resynchronization therapy. Eur J Nucl Med Mol Imaging 2012; 39: 1561-9.
5. Murrow J, Esteves F, Galt J, et al. Characterization of mechanical dyssynchrony measured by gated single photon emission computed tomography phase analysis after acute ST- elevation myocardial infarction. J Nucl Cardiol 2011; 18: 912- 9.
6. Takahashi N, Yamamoto A, Tezuka S, et al. Assessment of left ventricular dyssynchrony during development of heart failure by a novel program using ECG-gated myocardial perfusion SPECT. CircJ 2008; 72: 370-7.
7. Yamamoto A, Takahashi N, Ishikawa M, et al. Relationship between left ventricular function and wall motion synchrony in heart failure assessed by ECG-gated myocardial perfusion SPECT. Ann Nucl Med 2008; 22: 751-9.
8. Shibata Y, Sone T, Tsuboi H, et al. Left ventricular dyssynchrony in patients with moderate coronary stenosis and border line fractional flow reserve. Nagoya J Med Sci 2015;
77: 155-66.
9. Ko JS, Jeong MH, Lee MG, et al. Left ventricular dyssynchrony after acute myocardial infarction is a powerful indicator of left ventricular remodeling. Korean Circ J 2009;
39: 236-42.
10. Gorcsan J 3rd. Role of echocardiography to determine candidacy for cardiac resynchronization therapy. Curr Opin Cardiol 2008; 23: 16-22.
11. Chung ES, Leon AR, Tavazzi L, et al. Results of the predictors of response to CRT (PROSPECT) trial. Circulation 2008; 117:
2608-16.
12. Ruschitzka F, Abraham WT, Singh JP, et al. Cardiac- resynchronization therapy in heart failure with a narrow QRS complex. N Engl J Med 2013; 369: 1395-405.
13. Lin X, Xu H, Zhao X, et al. Repeatability of left ventricular dyssynchrony and function parameters in serial gated myocardial perfusion SPECT studies. J Nucl Cardiol 2010; 17:
811-6.
14. Soman P, Chen J. Left ventricular dyssynchrony assessment using myocardial single-photon emission CT. Semin Nucl Med 2014; 44: 314-9.
15. Nagao M, Yamasaki Y, Yonezawa M, et al. Geometrical characteristics of left ventricular dyssynchrony in advanced heart failure. Myocardial strain analysis by tagged MRI. Int Heart J 2014; 55: 512-8.
16. Agmadova ZM, Kallaeva AN. Special characteristics of progression of myocardial remodeling in patients with various forms of unstable angina. Kardiologiia 2014; 54: 9-16. (in Russian)
17. Stone SG, Serrao GW, Mehran R, et al. Incidence, predictors, and implications of reinfarction after primary percutaneous coronary intervention in ST-segment-elevation myocardial infarction: the Harmonizing Outcomes with Revascularization and Stents in Acute Myocardial Infarction Trial. Circ CardiovascInterv 2014; 7: 543-51.
18. Hage FG, Aggarwal H, Patel K, et al. The relationship of left ventricular mechanical dyssynchrony and cardiac sympathetic denervation to potential sudden cardiac death events in systolic heart failure. J Nucl Cardiol 2014; 21: 78-85.
19. Aljaroudi WA, Hage FG, Hermann D, et al. Relation of left- ventricular dyssynchrony by phase analysis of gated SPECT images and cardiovascular events in patients with implantable cardiac defibrillators. J Nucl Cardiol 2010; 17: 398-404.
20. Kutyifa V, Pouleur AC, Knappe D, et al. Dyssynchrony and the risk of ventricular arrhythmias. JACC Cardiovasc Imaging 2013; 6: 432-44.
21. Turan B, Yilmaz F, Karaahmet T, et al. Role of left ventricular
dyssynchrony in predicting remodeling after ST elevation myocardial infarction. Echocardiography. 2012; 29: 165-72.
22. Leong DP, Hoogslag GE, Piers SR, et al. The relationship between time from myocardial infarction, left ventricular dyssynchrony, and the risk for ventricular arrhythmia: speckle- tracking echocardiographic analysis. J Am Soc Echocardiogr.
2015; 28: 470-7.
23. Murrow J, Esteves F, Galt J, et al. Characterization of mechanical dyssynchrony measured by gated single photon emission computed tomography phase analysis after acute ST- elevation myocardial infarction. J Nucl Cardiol 2011; 18: 912- 9.
24. Hida S, Chikamori T, Tanaka H, et al. Diagnosticvalue of left ventricular dyssynchrony after exercise and at rest in the detection of multivessel coronary artery disease on single- photon emission computed tomography. Circ J 2012; 76:
1942-52.
25. Tanaka H, Chikamori T, Hida S, et al. Diagnosticvalue of vasodilator- induced left ventricular dyssynchrony as assessed by phase analysis to detect multivessel coronary artery disease.
Ann Nucl Cardiol 2015; 1: 6-17.
26. Hess PL, Shaw LK, Fudim M, et al. The prognosticvalue of mechanical left ventricular dyssynchrony defined by phase analysis from gated single-photon emission computed tomography myocardial perfusion imaging among patients with coronary heart disease. J Nucl Cardiol 2016; 23: 1-9.