Corresponding author: Mana Ishibashi, MD, PhD [email protected]
Received 2018 December 21 Accepted 2019 January 28
Abbreviations: AUC, area under the curve; CT, computed tomogra-phy; FDG, fluorine-18 fluorodeoxyglucose; MTV, metabolic tumor volume; OSEM, ordered-subset expectation maximization; PET, positron emission tomography; ROC, receiver operating character-istics; SD, standard deviation; SUVmax, maximum standardized uptake value; TLG, total lesion glycolytic activity; VOI, volume of interest; WHO, World Health Organization
Usefulness of Preoperative
18F-FDG PET/CT for Patients with Thymic Epithelial
Tumors
Mana Ishibashi,* Yoshio Tanabe,* Hiroto Yunaga,* Hidenao Miyoshi,* Ken Miwa,† Hiroshige Nakamura,† Shinya Fujii* and Toshihide Ogawa*
*Division of Radiology, Department of Pathophysiological and Therapeutic Science, School of Medicine, Tottori University Faculty of Medicine, Yonago 683-8503, and †Division of General Thoracic Surgery, Department of Surgery, School of Medicine, Tottori University Faculty of Medicine, Yonago 683-8503
ABSTRACT
Background The purpose of this study was to
inves-tigate the relationship between preoperative FDG-PET parameters and the World Health Organization (WHO) classification or Masaoka staging system of thymic epi-thelial tumors.
Methods We retrospectively reviewed 32 patients with histologically proven thymic epithelial tumors who un-derwent PET/CT before surgical resection. FDG-PET parameters, including the maximum standardized uptake value (SUVmax), metabolic tumor volume (MTV), and total lesion glycolytic activity (TLG), were measured. These PET parameters were compared in the Masaoka staging system and WHO classification. A re-ceiver operating characteristics (ROC) analysis was per-formed to identify the cut-off values of PET parameters for the accurate differentiation of early and advanced stages in the Masaoka staging system.
Results There were 17 low-risk thymomas (1 type A,
9 type AB, and 7 type B1), 8 high-risk thymomas (4 type B2 and 4 type B3), and 7 thymic carcinomas (7 squa-mous cell carcinoma). Their Masaoka stages were as fol-lows: 24 in the early stage (stages I and II) and 8 in the advanced stage (stage III). Regarding the WHO classifi-cation, only SUVmax showed a significant difference (P < 0.05). In the Masaoka stage, all PET parameters were significantly higher in the advanced stage than in the early stage (P < 0.05). In the ROC analysis to predict the early and advanced stages in thymic epithelial tumors, the area under the curve was the highest for TLG among the PET parameters examined and the cut-off value of TLG for discriminating the early from advanced stage
with maximal sensitivity and specificity was 30.735.
Conclusion Although volumetric PET parameters,
such as MTV and TLG, did not correlate with the WHO classification, a significant correlation was observed between SUVmax and the WHO classification. In the Masaoka staging system, volumetric PET parameters may achieve more precise staging than SUVmax.
Key words fluorodeoxyglucose F18; positron emission
tomography computed tomography; thymic epithelial tumor
Thymic epithelial tumors are the most common primary neoplasms of the anterior mediastinum. The World Health Organization (WHO) histological classification system for thymic epithelial tumors was proposed in 1999 and revised in 2015,1, 2 and divides thymic
epithe-lial tumors into six subtypes: thymoma types A, AB, B1, B2, and B3 and thymic carcinoma, based on the morphology of epithelial cells and the lymphocyte-to epithelial cell ratio.2 A poor prognosis was previously
reported to be slightly more common according to type in the following order: low-risk thymomas (types A, AB, and B1), high-risk thymomas (types B2 and B3), and thymic carcinomas.3–5 Another prognostic factor for
thy-mic epithelial tumors, the Masaoka staging system, as modified by Koga et al., is the most popular staging sys-tem, is based on the level of invasion, and is divided into stages I, IIA, IIB, III, IVA, and IVB.6, 7 The Masaoka
staging system has a greater impact on survival than the WHO classification.3, 8 The preoperative identification of
the histological subtype and tumor stage has important implications on the management, strategy, and prognosis of thymic epithelial tumors.
Positron emission tomography (PET) using fluorine-18 fluorodeoxyglucose (FDG) has emerged as a pow-erful diagnostic tool for the diagnosis, staging, and restaging of several malignancies. Previous studies reported FDG-PET/CT values for predicting histological subtypes or tumor stages in patients with thymic epi-thelial tumors.9–15 The maximum standardized uptake
Preoperative FDG-PET/CT for thymic epithelial tumors
value (SUVmax) is a reproducible imaging biomarker on PET/CT. Newly suggested volumetric parameters, such as the metabolic tumor volume (MTV) and total lesion glycolytic activity (TLG), have recently been reported as additional diagnostic and prognostic biomarkers in various malignant tumors16–19; however, few studies have
examined the relationship between PET volumetric parameters and thymic epithelial tumors.20–23
The purpose of the present study was to investigate the relationships between preoperative PET parameters, including SUVmax and other volumetric parameters, and the WHO classification or Masaoka staging system in patients with resected thymic epithelial tumors. MATERIALS AND METHODS
Patient Population
Our Institutional Review Board approved this retrospec-tive study (IRB number: 1601A109). The requirement to obtain informed consent was waived. This study was a retrospective study of consecutive patients undergoing combined FDG-PET/CT between March 2007 and December 2015 in our hospital. Thirty-two patients (9 males and 23 females; age range, 31–81 years; mean ± SD, 61.7 ± 13.0 years) with thymic epithelial tumors underwent FDG-PET/CT before initial surgery. A de-finitive diagnosis of thymic epithelial tumors had been established in all patients. None of the patients had a his-tory of chemotherapy or radiation therapy before FDG-PET/CT.
All patients underwent surgical resection with tho-racotomy or video-assisted thoracic surgery. The time interval between the PET scan and thymectomy was between 5 and 55 days (median: 21 days). All tumors were staged according to the Masaoka staging system,6
and all surgical specimens were reviewed and classi-fied according to the WHO classification2 (i.e., types
A, AB, B1, B2, and B3 and thymic carcinoma) by an experienced pathologist. All tumors were divided into 3 subgroups: low-risk thymomas (types A, AB, and B1), high-risk thymomas (types B2 and B3), and thymic car-cinomas. In addition, all tumors were divided into two groups by the Masaoka staging system: early stage (stages I and II) and advanced stage (stages III and IV).
PET/CT protocols
FDG (290.8 ± 31.6 MBq, mean ± SD), which was delivered by Nihon Mediphysics (Tokyo, Japan), was administered intravenously after more than 6 hours of
levels ranged between 79 and 145 mg/dL (mean: 101.4 mg/dL) in the FDG-PET/CT study.
The scanning range was from the top of the skull to the mid-thighs of patients. Data acquisition began with an attenuation collection CT scan without contrast agent. The CT scan was performed using a continuous spiral 16-detector-row technique with a tube voltage of 120 kV, gantry rotation speed of 0.5 sec, slice thickness of 6.0 mm, and beam pitch of 0.9375 under breath holding. The X-ray tube current was between 100 and 230 mAs (adjusted automatically for body thickness). The PET scan was immediately followed by a 2-min emission acquisition time at a 162-mm axial field of view per po-sition. Images were reconstructed with a slice thickness of 6.0 mm by the standard ordered-subset expectation maximization (OSEM) technique using 14 subsets and 4 iterations with a 128 × 128 matrix for PET and 512 × 512 matrix for CT.
Image analysis and PET measurements
An experienced nuclear medicine physician who was blinded to the clinical data separately received images on a 3D workstation; SYNAPSE VINCENT (Fujifilm, Tokyo, Japan). An ellipsoidal volume of interest (VOI) was carefully placed to cover the primary thymic epithelial tumors with reference to CT images to avoid the inclusion of activity from nearby organs with high physiological uptake, such as the myocardium.
The SUVmax of tumors were obtained and re-corded. MTV indicates the volume of hypermetabolic tissue within the region of the gross tumor with an SUV greater than the defined threshold, and TLG, which is the multiplication of MTV and SUVmean, signifies the overall tumor burden. To define the contouring margins around the tumor, the defined threshold was considered to be 2.5, according to previous studies.22, 23 If the SUVmax
of a tumor was equal or less than the determined thresh-old, MTV and TLG were considered to be zero.
Statistical analysis
Statistical analyses were performed using SPSS for Windows software (version 24.0; SPSS Inc., Chicago, IL). Clinical and pathological parameters were shown as a mean and standard deviation (SD) for continuous variables or as a frequency and percentage for categor-ical variables. Groups were compared using the Mann-Whitney test or Kruskal-Wallis test. The predictive value of PET parameters was assessed by calculating the area
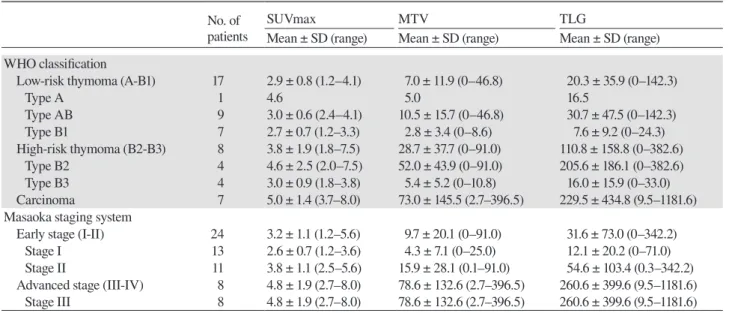
Table 1. PET parameters of patients with thymic epithelial tumors according the WHO classification and Masaoka staging system
No. of patients
SUVmax MTV TLG
Mean ± SD (range) Mean ± SD (range) Mean ± SD (range) WHO classification
Low-risk thymoma (A-B1) 17 2.9 ± 0.8 (1.2–4.1) 7.0 ± 11.9 (0–46.8) 20.3 ± 35.9 (0–142.3)
Type A 1 4.6 5.0 16.5 Type AB 9 3.0 ± 0.6 (2.4–4.1) 10.5 ± 15.7 (0–46.8) 30.7 ± 47.5 (0–142.3) Type B1 7 2.7 ± 0.7 (1.2–3.3) 2.8 ± 3.4 (0–8.6) 7.6 ± 9.2 (0–24.3) High-risk thymoma (B2-B3) 8 3.8 ± 1.9 (1.8–7.5) 28.7 ± 37.7 (0–91.0) 110.8 ± 158.8 (0–382.6) Type B2 4 4.6 ± 2.5 (2.0–7.5) 52.0 ± 43.9 (0–91.0) 205.6 ± 186.1 (0–382.6) Type B3 4 3.0 ± 0.9 (1.8–3.8) 5.4 ± 5.2 (0–10.8) 16.0 ± 15.9 (0–33.0) Carcinoma 7 5.0 ± 1.4 (3.7–8.0) 73.0 ± 145.5 (2.7–396.5) 229.5 ± 434.8 (9.5–1181.6) Masaoka staging system
Early stage (I-II) 24 3.2 ± 1.1 (1.2–5.6) 9.7 ± 20.1 (0–91.0) 31.6 ± 73.0 (0–342.2)
Stage I 13 2.6 ± 0.7 (1.2–3.6) 4.3 ± 7.1 (0–25.0) 12.1 ± 20.2 (0–71.0)
Stage II 11 3.8 ± 1.1 (2.5–5.6) 15.9 ± 28.1 (0.1–91.0) 54.6 ± 103.4 (0.3–342.2) Advanced stage (III-IV) 8 4.8 ± 1.9 (2.7–8.0) 78.6 ± 132.6 (2.7–396.5) 260.6 ± 399.6 (9.5–1181.6)
Stage III 8 4.8 ± 1.9 (2.7–8.0) 78.6 ± 132.6 (2.7–396.5) 260.6 ± 399.6 (9.5–1181.6) All values are expressed as the mean ± standard deviation. MTV, metabolic tumor volume; PET, positron emission tomography; SD, standard deviation; SUVmax, maximum standardized uptake value; TLG, total lesion glycolytic activity; VOI, volume of interest; WHO, World Health Organization.
Fig.1
A
P < 0.05
C
B
SUVmax MTV TLGFig. 1. Box-plot showing the relationship between the WHO clas-sification and PET parameters. There was significant difference in SUVmax, however, there were no significant differences in MTV and TLG. Circles and stars represent extreme values. A: SUVmax. B: MTV. C: TLG. MTV, metabolic tumor volume; PET, positron emission tomography; SUVmax, maximum standardized uptake value; TLG, total lesion glycolytic activity; WHO, World Health Organization.
Preoperative FDG-PET/CT for thymic epithelial tumors
C
P < 0.05
P < 0.05
A
Early stageB
P < 0.05
Advancedstage stage Early Advanced stage
Advanced stage Advanced stage Early stage SUVmax MTV TLG
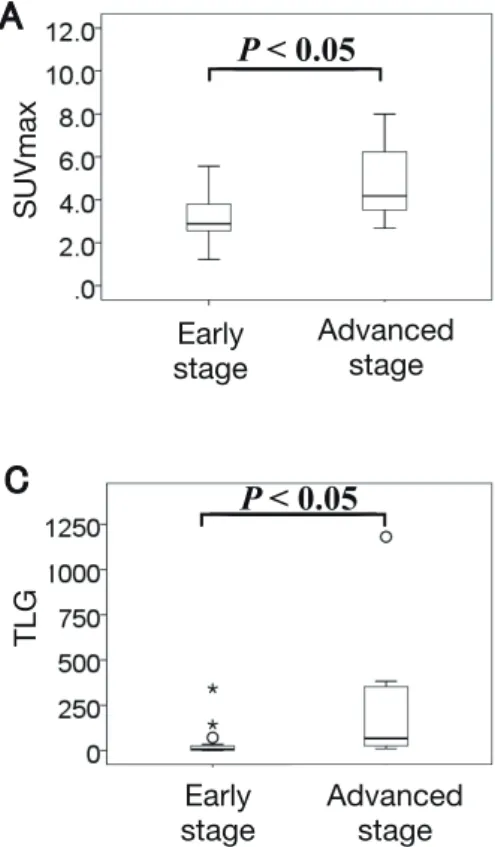
Fig. 2. Box plots showing the relationship between PET param-eters and the Masaoka staging system. All PET paramparam-eters were significantly higher in the advanced stage than in the early stage. Circles and stars represent extreme values. A: SUVmax. B: MTV. C: TLG. MTV, metabolic tumor volume; PET, positron emission tomography; SUVmax, maximum standardized uptake value; TLG, total lesion glycolytic activity.
Fig.3
1 - specificity
Sensitivity
Fig. 3. ROC curve analysis for discriminating early stage from advanced stage. The AUC of TLG was the highest for discriminat-ing the early stage from the advanced stage. AUC, area under the curve; MTV, metabolic tumor volume; ROC, receiver operating characteristics; SUVmax, maximum standardized uptake value; TLG, total lesion glycolytic activity.
RESULTS
Thirty-two thymic epithelial tumors, including 17 low-risk thymomas (1 type A, 9 type AB, and 7 type B1), 8 high-risk thymomas (4 type B2 and 4 type B3), and 7 thymic carcinomas (7 squamous cell carcinomas), were evaluated in the present study. The distribution of tumors according to the simplified WHO classification and Masaoka staging system are shown in Table 1. The proportion of invasive tumors (stages I, II, and III) with reference to the subtype of the Masaoka staging system were 13, 11, and 8 patients, respectively. In all patients, the mean and SD of SUVmax, MTV, and TLG were 3.6 ± 1.5, 26.9 ± 72.0, and 88.7 ± 223.9, respectively.
Patients were grouped into low-risk thymoma, high-risk thymoma, and thymic carcinoma according to the WHO classification, and comparisons of the PET parameters of tumors are shown in Fig. 1. The mean SUVmax was 2.9 ± 0.8 for low-risk thymoma, 3.8 ± 1.9 for high-risk thymoma, and 5.0 ± 1.4 for thymic carcinoma. These differences were significant (P < 0.05). Mean MTV and TLG were 7.0 ± 11.9 and 20.3 ± 35.9 for low-risk thymoma, 28.7 ± 37.7 and 110.8 ± 158.8 for high-risk thymoma, and 73.0 ± 145.5 and 229.5 ±
Comparisons of PET parameters in the Masaoka stage system are shown in Fig. 2. Mean SUVmax, MTV, and TLG were 3.2 ± 1.1, 9.7 ± 20.1, and 31.6 ± 73.0 in the early stage and 4.8 ± 1.9, 78.6 ± 132.6 and 260.6 ±
M. Ishibashi et al.
A
B
C
Fig.4
Fig. 4. A 44-year-old female with low-risk thymoma (type B1, Masaoka stage Ⅱ). CT, PET and fusion images show mild FDG uptake in anterior mediastinal tumor (arrows). PET parameters were as follows; 3.3 for SUVmax, 8.6 for MTV, and 24.2 for TLG. A: CT. B: PET. C: fusion image. CT, computed tomography; FDG, fluorine-18 fluorodeoxyglucose; MTV, metabolic tumor vol-ume; PET, positron emission tomography; SUVmax, maximum standardized uptake value; TLG, total lesion glycolytic activity.
A
B
C
Fig.5
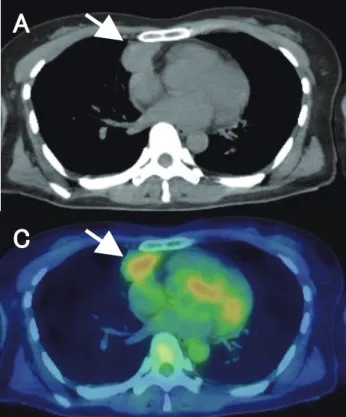
Fig. 5. A 49-year-old female with thymic carcinoma (Masaoka stage Ⅲ). CT, PET and fusion images show strong FDG uptake in anterior mediastinal tumor (arrows). PET parameters were as follows; 7.1 for SUVmax, 396.5 for MTV, and 1181.6 for TLG. A: CT. B: PET. C: fusion image. CT, computed tomography; MTV, metabolic tumor volume; PET, positron emission tomography; SUVmax, maximum standardized uptake value; TLG, total lesion glycolytic activity.
Preoperative FDG-PET/CT for thymic epithelial tumors
and advanced stages of thymic epithelial tumors. The ROC curve obtained is shown in Fig. 3. The area under the curve (AUC) of each PET parameter was as follows: 0.776 for SUVmax, 0.849 for MTV, and 0.854 for TLG. The AUC of TLG was the highest for discriminating the early stage from the advanced stage. The cut-off value of TLG for discriminating the early stage from the advanced stage with maximal sensitivity and specificity was 30.735.
The representative FDG-PET/CT images were shown in Figs. 4 and 5, respectively.
DISCUSSION
The present results indicate that volumetric PET pa-rameters have potential as metabolic and functional biomarkers in the Masaoka stage system for thymic epi-thelial tumors. FDG uptake and PET volumetric param-eters for advanced stage thymic epithelial tumors were higher than those for early stage thymic epithelial tu-mors. Regarding the WHO classification, only SUVmax correlated well with the WHO classification of thymic epithelial tumors, whereas volumetric parameters such as MTV and TLG did not.
Regarding predictions of the Masaoka stage, previ-ous studies reported a correlation between the Masaoka staging system and SUVmax of thymic epithelial tumors.12, 22, 24, 25 Our results also revealed significant
differences in PET parameters between the early and advanced stages. SUVmax, MTV, and TLG were sig-nificantly higher in the advanced stage than in the early stage, and the AUC of MTV and TLG were higher than that of SUVmax. The Masaoka staging system evaluates the local extent of a tumor based largely on surgical findings; therefore, the tumor size may guarantee the tu-mor extent. SUVmax is recognized as a PET parameter related to tumor invasiveness; however, it is a single-pixel value representing the most intense FDG uptake in a tumor. Volumetric parameters such as MTV and TLG define the volume of a tumor based on the distribution of metabolic activity, and may be a better marker for the Masaoka staging system than SUVmax. MTV signifies the volume of the tumor tissue with an increased FDG uptake over a certain threshold, while TLG delineates the overall tumor burden of FDG uptake. Therefore, TLG might be more effective in differentiation between early and advanced stages. In the present study, the cut-off value of TLG for discriminating the early stage from the advanced stage was 30.735. Several studies evaluated
A number of studies have evaluated the usefulness of FDG-PET/CT for predicting the grade of malignancy according to the WHO classification and outcomes in patients with thymic epithelial tumors9–15; most reported
that SUVmax was useful for differentiating thymomas from thymic carcinomas.9, 10, 13, 15, 23 In contrast,
controver-sy surrounds the ability of FDG-PET/CT to differentiate high-risk thymomas from low-risk thymomas. SUVmax has been shown to differentiate low-risk thymomas from high-risk thymomas,11–13, 26, 27 whereas other studies
reporting conflicting data9, 10, 23, 28 possibly because of
a marked overlap in FDG uptake. The present results demonstrated that only SUVmax differentiated low-risk and high-low-risk thymomas from thymic carcinomas, whereas other volume-dependent parameters did not, which is consistent with previous findings.22 SUVmax
represents the highest point of metabolic activity, re-flecting the greatest biologically aggressiveness, while volumetric parameters such as MTV and TLG indicate the tumor volume and glycolysis with increased tumor aggressiveness, respectively. Therefore, we hypothesized that volumetric parameters may be more useful than SUVmax for evaluating tumor invasiveness. Based on the present results, we considered that tumor size does not necessarily reflect tumor invasiveness. SUVmax is still the best predictor among several PET parameters in the era of volume-dependent parameters.
Our study is limited by the relatively small number of surgical cases and its retrospective design, which may have weakened the statistical power and contributed to selection bias. Furthermore, there were no patients with stage IV in our study group. We were unable to predict the outcomes of patients with thymic epithelial tumors because of the long follow-up period required. Further studies with larger numbers of patients and longer follow-ups are needed to evaluate the usefulness of FDG-PET/ CT for predicting patient outcomes.
In conclusion, although volumetric PET parameters such as MTV and TLG did not correlate with the WHO classification, a significant correlation was observed between SUVmax and the WHO classification. In the Masaoka staging system, volumetric PET parameters may achieve more precise staging than SUVmax. FDG-PET/CT parameters may be useful for predicting the histological subtype and tumor stage of thymic epithelial tumors.
REFERENCES
1 Rosai J, Sobin LH. Histological typing of tumours of the thymus, in international histological classification of tumours. 2nd ed. Berlin: Springer; 1999.
2 Travis WD, Brambilla E, Burke AP, Marx A, Nicholson AG. WHO classification of tumours of the lung, pleura, thymus and heart. 4th ed. Lyon: IARC Press; 2015.
3 Okumura M, Ohta M, Tateyama H, Nakagawa K, Matsumura A, Maeda H, et al. The World Health Organization histologic classification system reflects the oncologic behavior of thy-moma: a clinical study of 273 patients. Cancer. 2002;94:624-32. PMID: 11857293.
4 Marchevsky AM, Gupta R, McKenna RJ, Wick M, Moran C, Zakowski MF, et al. Evidence-based pathology and the patho-logic evaluation of thymomas: the World Health Organization classification can be simplified into only 3 categories other than thymic carcinoma. Cancer. 2008;112:2780-8. PMID: 18442102. 5 Tseng YC, Tseng YH, Kao HL, Hsieh CC, Chou TY, Goan
YG, et al. Long term oncological outcome of thymoma and thymic carcinoma - an analysis of 235 cases from a single institution. PLoS One. 2017;12:e0179527. PMID: 28632791. 6 Masaoka A, Monden Y, Nakahara K, Tanioka T. Follow-up
study of thymomas with special reference to their clinical stages. Cancer. 1981;48:2485-92. PMID: 7296496.
7 Koga K, Matsuno Y, Noguchi M, Mukai K, Asamura H, Goya T, et al. A review of 79 thymomas: modification of staging system and reappraisal of conventional division into invasive and non-invasive thymoma. Pathol Int. 1994;44:359-67. PMID: 8044305.
8 Nakagawa K, Asamura H, Matsuno Y, Suzuki K, Kondo H, Maeshima A, et al. Thymoma: a clinicopathologic study based on the new World Health Organization classification. J Thorac Cardiovasc Surg. 2003;126:1134-40. PMID: 14566259. 9 Sung YM, Lee KS, Kim BT, Choi JY, Shim YM, Yi CA.
18F-FDG PET/CT of thymic epithelial tumors: usefulness for
distinguishing and staging tumor subgroups. J Nucl Med. 2006;47:1628-34. PMID: 17015898.
10 Kumar A, Regmi SK, Dutta R, Kumar R, Gupta SD, Das P, et al. Characterization of thymic masses using (18)F-FDG PET-CT. Ann Nucl Med. 2009;23:569-77. PMID: 19585212. 11 Inoue A, Tomiyama N, Tatsumi M, Ikeda N, Okumura M,
Shiono H, et al. (18)F-FDG PET for the evaluation of thymic ep-ithelial tumors: Correlation with the World Health Organization classification in addition to dual-time-point imaging. Eur J Nucl Med Mol Imaging. 2009;36:1219-25. PMID: 19219429.
12 Terzi A, Bertolaccini L, Rizzardi G, Luzzi L, Bianchi A, Campione A, et al. Usefulness of 18-F FDG PET/CT in the pre-treatment evaluation of thymic epithelial neoplasms. Lung Cancer. 2011;74:239-43. PMID: 21439670.
13 Seki N, Sakamoto S, Karube Y, Oyaizu T, Ishihama H, Chida M. 18F-fluorodeoxyglucose positron emission tomography for
evaluation of thymic epithelial tumors: utility for World Health Organization classification and predicting recurrence-free survival. Ann Nucl Med. 2014;28:257-62. PMID: 24430867. 14 Nakajo M, Kajiya Y, Tani A, Yoneda S, Shirahama H,
Higashi M, et al. 18FDG PET for grading malignancy in
thy-mic epithelial tumors: significant differences in 18FDG uptake
and expression of glucose transporter-1 and hexokinase II between low and high-risk tumors: preliminary study. Eur J Radiol. 2012;81:146-51. PMID: 20810231.
15 Nakagawa K, Takahashi S, Endo M, Ohde Y, Kurihara H, Terauchi T. Can 18F-FDG PET predict the grade of
malignan-cy in thymic epithelial tumors? An evaluation of only resected tumors. Cancer Manag Res. 2017;9:761-8. PMID: 29263700. 16 Hanamoto A, Tatsumi M, Takenaka Y, Hamasaki T, Yasui T,
Nakahara S, et al. Volumetric PET/CT parameters predict local response of head and neck squamous cell carcinoma to chemo-radiotherapy. Cancer Med. 2014;3:1368-76. PMID: 25045041. 17 Sakane M, Tatsumi M, Hori M, Onishi H, Tsuboyama T,
Nakamoto A, et al. Volumetric parameters of 2-deoxy-2-[18F] fluoro-d-glucose positron emission tomography/computed tomography can predict histopathologic treatment response after neoadjuvant chemoradiotherapy in pancreatic adenocar-cinoma. Eur J Radiol. 2017;94:64-9. PMID: 28712692. 18 Park SY, Lee SJ, Yoon JK. The prognostic value of total
lesion glycolysis via 18F-fluorodeoxyglucose PET-CT in surgically treated esophageal squamous cell carcinoma. Ann Nucl Med. 2016;30:81-8. PMID: 26497543.
19 Kitajima K, Miyoshi Y, Yamano T, Odawara S, Higuchi T, Yamakado K. Prognostic value of FDG-PET and DWI in breast cancer. Ann Nucl Med. 2018;32:44-53. PMID: 29134565. 20 Bertolaccini L, Viti A, Lanzi E, Fortunato M, Chauvie S,
Bianchi A, et al. (18)Fluorine-fluorodeoxyglucose positron emission tomography/computed tomography total glycolytic volume in thymic epithelial neoplasms evaluation: a repro-ducible image biomarker. Gen Thorac Cardiovasc Surg. 2014;62:228-33. PMID: 24477745.
21 Scagliori E, Evangelista L, Panunzio A, Calabrese F, Nannini N, Polverosi R, et al. Conflicting or complementary role of computed tomography (CT) and positron emission tomogra-phy (PET)/CT in the assessment of thymic cancer and thy-moma: our experience and literature review. Thorac Cancer. 2015;6:433-42. PMID: 26273398.
22 Park SY, Cho A, Bae MK, Lee CY, Kim DJ, Chung KY. Value of 18F-FDG PET/CT for predicting the World Health
Organization malignant grade of thymic epithelial tumors: focused in volume-dependent parameters. Clin Nucl Med. 2016;41:15-20. PMID: 26545017.
23 Morita T, Tatsumi M, Ishibashi M, Isohashi K, Kato H, Honda O, et al. Assessment of mediastinal tumors using suvmax and volumetric parameters on FDG-PET/CT. Asia Ocean J Nucl Med Biol. 2017;5:22-9. PMID: 28840135. 24 Lee G, I H, Kim SJ, Pak K, Cho JS, Jeong YJ, et al. Initial
Experience of 18F-FDG PET/MRI in thymic epithelial
tumors: morphologic, functional, and metabolic biomarkers. Clin Nucl Med. 2016;41:8-14. PMID: 26284773.
25 Luzzi L, Campione A, Gorla A, Vassallo G, Bianchi A, Biggi A, et al. Role of fluorine-flurodeoxyglucose positron emission tomography/computed tomography in preoperative assess-ment of anterior mediastinal masses. Eur J Cardiothorac Surg. 2009;36:475-9. PMID: 19501523.
26 Endo M, Nakagawa K, Ohde Y, Okumura T, Kondo H, Igawa S, et al. Utility of 18FDG-PET for differentiating the grade
of malignancy in thymic epithelial tumors. Lung Cancer. 2008;61:350-5. PMID: 18304691.
27 Kaira K, Endo M, Abe M, Nakagawa K, Ohde Y, Okumura T, et al. Biologic correlation of 2-[18F]-fluoro-2-deoxy-D- glucose uptake on positron emission tomography in thymic epithelial tumors. J Clin Oncol. 2010;28:3746-53. PMID: 20625125. 28 Fukumoto K, Taniguchi T, Ishikawa Y, Kawaguchi K, Fukui
T, Kato K, et al. The utility of [18F]-fluorodeoxyglucose pos-itron emission tomography-computed tomography in thymic epithelial tumours. Eur J Cardiothorac Surg. 2012;46:e152-6. PMID: 23024234.