連星中性子星
(NS-‐NS)合体からの
重力波・電磁波・ニュートリノ放射
仏坂健太
(京都大学)
日本物理学会 第
69回年次大会
宇宙線・宇宙物理領域、理論核物理領域合同シンポジウム
重力波源とその電磁波、ニュートリノ対応天体
Outline
• 連星中性子星合体の重力波天文学
• 連星中性子星合体に付随する電磁波
• まとめ
ü ショートガンマ線バースト
ü 質量放出に伴う電磁波放射
ü
Short GRB 130603B の巨新星
重力波と人類の歩み
ü
1916年、Einsteinの計算
=>一般相対論から重力波の存在の予言。
ü
1974年、Hulse-‐Taylor パルサーの発見
=>理論予想どうりに重力波を放射。
ü
2014年、BICEP2によるCMBの原始重力波起源
の
B-‐modeの発見!?
=>重力波は宇宙空間を伝播している。
ü
201X年、重力波検出器によって、直接検出。
重力波天文学:初検出に向けて
Advanced LIGO
Advanced Virgo
KAGRA
予想イベントレート
(NS-‐NS合体)
これまで
(IniTal LIGO, Virgo) 数年後から(KAGRA, Advanced LIGO, Virgo)
0.0002 〜 0.2 /yr 0.4 〜 400 /yr
Abadie et al (2010)
GW
有望なターゲット:
コンパクト天体の合体
数値相対論:
NS-‐NS合体と重力波形
M
1
= 1.4M
sun
M
2
= 1.3M
sun
EOS : APR (R=11km, Mmax=2.2Msun)のモデル
コンパクト連星合体からの重力波を捉える
-2e-21 -1e-21 0 1e-21 2e-21 2 2.01 2.02 2.03 2.04 2.05h
time[s]データ:雑音+
重力波
-0.15 -0.1 -0.05 0 0.05 0.1 0.15 2 2.01 2.02 2.03 2.04 2.05 h time[s]理論波形
(テンプレート)
テンプレートとデータの
内積を取って重力波信号を
取り出す
マッチドフィルター解析
運動に関わる物理量
(質量など) 軌道運動
重力波波形
検出
重力波観測で測定される物理量
マッチドフィルター解析
(SNR〜20,1.4-‐1.4Msun)
ü 天体の個々の質量が〜
15% で測定。
ü 合体時刻〜
1msの精度でわかる?
ü 中性子星の半径
±2km 程度で測定?
ü 天体までの距離が〜数
10% で測定。
ü 天球面上の位置が〜
10deg^2 で測定
連星進化
GRB, gravity
核物質
宇宙論
!?
関連テーマ
ü 重力波検出を他の実験
(観測)
によって追確認できるか?
ü 重力波天文学をより豊かなものできるか?
重力波の対応天体の観測に期待
Outline
•
連星中性子星合体からの重力波
• 連星中性子星合体に付随する電磁波
•
まとめ
ü
ショートガンマ線バースト
ü
質量放出に伴う等方電磁波放射
ü
Short GRB 130603B の巨新星
重力波ー電磁波観測
• 次世代重力波望遠鏡時代のコンパクト連星天文学
ü 〜200Mpcまでカバーする => 数10万の銀河
検出閾値付近のイベントが多い➡電磁波で確認➡発見の手助け
重力波源の電磁波による追観測が重要!!
電磁波で母銀河、距離を決定➡
GW-‐photon伝播の物理
ü 波源の位置決定が苦手(10deg^2)。
波源は中性子星?ブラックホール?または? 電磁波観測と比較
ü 重力波から合体時刻、天体の質量はわかるだろう。
電磁波の観測戦略が必要
ü 有望な重力波の対応天体とは?
1. 連星中性子星合体に付随する確率が高い。
2. 現在、または将来の望遠鏡で観測可能。
3. 他の天体現象と区別可能。
ü いつ、どの波長、どの感度で観測すべきか?
30
28
26
-‐2 0 2 4 6 8 10
log
(L) [
er
g/s]
Log
Lu
m
in
os
ity
(e
rg
/s
/Hz)
log(t) [s]
Merger remnant
(radio)
Kilonova
/Macronova
(NIR)
Extended Emission (X)
GRB Aferglow (X)
Merger Breakout (X)
GRB Aferglow (visible)
GRB aferglow
(radio)
GRB (X~γ)
52
50
48
46
44
42
log
(Lν
) [
er
g/
s/
Hz]
Merger Breakout (radio)
予想光度曲線
Norris & Bonnell (2006) Refs: Nakar (2007) Sari, Piran, Narayan (1998)Li & Paczynski (1998) Nakar & Piran (2012) Kyutoku, Ioka, Shibata (2012) Kelley, Mandel, Ramirez-‐Ruiz (2012)
Tanaka & Hotokezaka (2013) Nakamura et al (2013)
明るさ
Outline
•
連星中性子星合体からの重力波
• 連星中性子星合体に付随する電磁波
•
まとめ
ü ショートガンマ線バースト
ü
質量放出に伴う等方電磁波放射
ü
Short GRB 130603B の巨新星
ショート
/ロング ガンマ線バースト
1993ApJ...413L.101KKouveliotou
et al (1993)
Short GRB
Long GRB
Long GRB => ときどき超新星爆発が付随 => 一部は重力崩壊が起源
Short GRB => 星形成が終わった銀河でも起こる => コンパクト星合体?
duraTon
非常に強度の高いガンマ線
~X線が短時間に放射される現象。
とても明るい、観測済
=>NS-‐NS合体の対応天体として有望!?
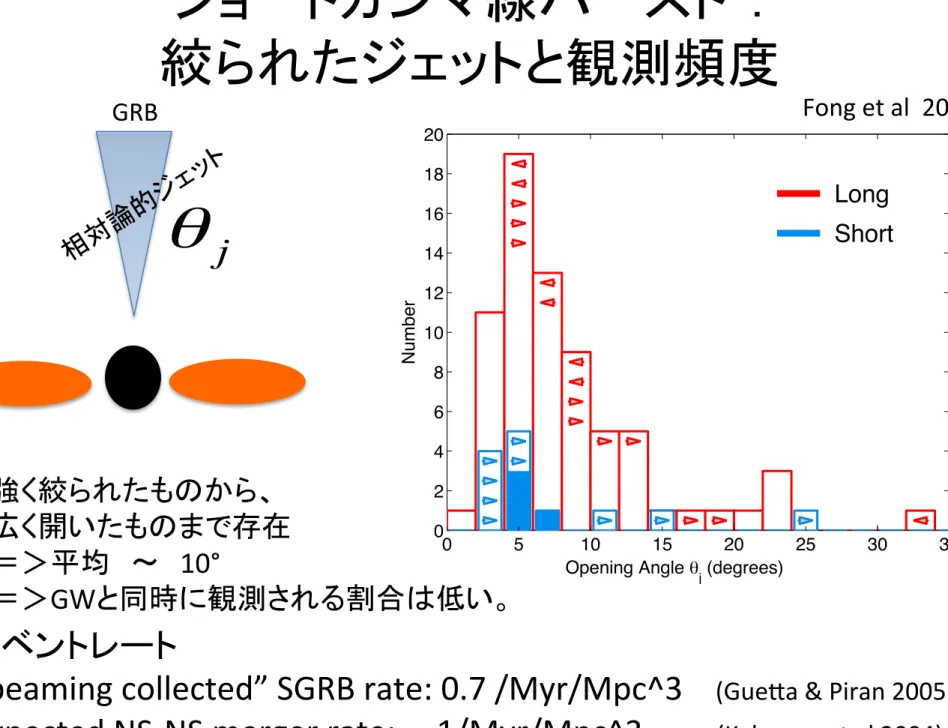
ショートガンマ線バースト :
絞られたジェットと観測頻度
Short GRB 130603B 7
in GRB 130603B.
We note that of the ≈ 10 short GRBs with X-ray obser-vations to δt ! 1 d, two events, GRBs 050724 and 080503, also exhibited late-time X-ray excess emission on timescales of δt ∼ 1 − 2 d (Grupe et al. 2006; Perley et al. 2009). How-ever, unlike GRB 130603B, these bursts both had corre-sponding behavior in the optical bands (Malesani et al. 2007; Perley et al. 2009), suggesting that the optical and X-ray emission were from the same emitting region.
6. COMPARISON TO PREVIOUS SHORT GRBS
The broad-band afterglow observations of GRB 130603B provide the second detection of a multi-wavelength jet break in a short GRB, and the first detection of a jet break in the radio band. Radio afterglow emission has thus far been detected in two short GRBs: GRB 050724A (Berger et al. 2005), GRB 051221A (Soderberg et al. 2006). The ability to monitor the radio afterglow of GRB 130603B at a flux density level of " 0.1 mJy highlights the improved sensitivity of the VLA.
Indeed, the radio evolution can provide an important constraint on the progenitor. In the context of the com-pact object binary progenitor, the radioactive decay of r-process elements in the sub-relativistic merger ejecta is pre-dicted to produce transient emission, termed a “kilonova” (Li & Paczy´nski 1998; Metzger et al. 2010; Goriely et al. 2011; Roberts et al. 2011; Rosswog et al. 2013), which is ex-pected to peak in the NIR (Barnes & Kasen 2013; Kasen et al. 2013; Tanaka & Hotokezaka 2013). Late-time NIR emis-sion in GRB 130603B detected with the Hubble Space
Tele-scope (Figure 2; Berger et al. 2013; Tanvir et al. 2013) has
been interpreted as the first detection of a r-process kilonova. An alternative scenario to explain the excess NIR emission of GRB 130603B may be a wide, mildly relativistic com-ponent of a structured jet (Jin et al. 2013) which has been used to explain the light curve behavior of a handful of long GRBs (e.g., Berger et al. 2003; Sheth et al. 2003; Peng et al. 2005; Racusin et al. 2008). In this scenario, the predicted radio emission is similarly boosted, and will be ≈ 80 µJy at δt ≈ 84 d, the time of our final radio observations (Jin et al. 2013). Instead, the non-detection of any radio emission to " 34 µJy provides a strong constraint on the existence of a two component jet, and supports the kilonova interpretation of the NIR emission.
The detection of a jet break in GRB 130603B leads to an opening angle measurement of 4 − 14◦, with a
more likely range of 4 − 8◦. This opening angle is
the fourth10 such measurement for a short GRB after GRB 051221A (7◦
; Soderberg et al. 2006), GRB 090426 (5 − 7◦
; Nicuesa Guelbenzu et al. 2011), and GRB 111020A (3 − 8◦; Fong et al. 2012). From these four short GRB opening
angle measurements, the median is #θj$ ≈ 6◦ (Figure 3).
The non-detections of jet breaks can provide lower lim-its on the opening angles, assuming on-axis orientation, as off-axis observing angles could disguise jet breaks (van Eerten & MacFadyen 2012, 2013). Indeed, such non-detections to timescales of ∼ 1 day with Swift/XRT have led to lower limits of θj ! 2 − 6◦ (Fong et al. 2012), while
monitoring with more sensitive instruments such as
Chan-dra and XMM-Newton to timescales of ∼ 1 week has led to
more meaningful limits of θj ! 10 − 25◦ (Figure 3; Fox et al.
11We note that Nicuesa Guelbenzu et al. (2012) claimed a jet break in the
GRB 090305A afterglow but this is based on a single optical data point.
0 5 10 15 20 25 30 35 0 2 4 6 8 10 12 14 16 18 20
Short
Long
Opening Angle θ j (degrees) NumberFigure 3. Distribution of opening angles for long (red) and short (blue) GRBs, updated from Fong et al. (2012). Arrows represent up-per and lower limits. The long GRB population includes pre-Swift (Frail et al. 2001; Berger et al. 2003; Bloom et al. 2003; Ghirlanda et al. 2004; Friedman & Bloom 2005), Swift (Racusin et al. 2009; Filgas et al. 2011), and Fermi (Cenko et al. 2010; Goldstein et al. 2011; Cenko et al. 2011) bursts. For short GRBs, the existing measurements are GRB 051221A (7◦; Soderberg et al. 2006), GRB 090426 (5 − 7◦, assigned 6◦ here;
Nicuesa Guelbenzu et al. 2011), GRB 111020A (3 − 8◦, assigned 5.5◦ here;
Fong et al. 2012) and GRB 130603B (4 − 8◦, assigned 6◦ here; this work).
Short GRB lower limits are from the non-detection of jet breaks in Swift/XRT data (Fong et al. 2012), Chandra data for GRBs 050724A (Grupe et al. 2006), 101219A (Fong et al. 2013), 111117A (Margutti et al. 2012a; Sakamoto et al. 2013), and 120804A (Berger et al. 2013) and optical data for GRBs 050709 (Fox et al. 2005) and 081226A (Nicuesa Guelbenzu et al. 2012).
2005; Grupe et al. 2006; Berger et al. 2013). The search for jet breaks has been less fruitful in the optical bands, pri-marily due to the intrinsic faintness of the optical after-glows and contamination from host galaxies. Indeed, the sole lower limit from a well-sampled optical light curve is from GRB 081226A, with θj ! 3◦ (Nicuesa Guelbenzu et al.
2012), while we conservatively adopt a lower limit of θj!15◦
for GRB 050709 based on a sparsely-sampled optical light curve (Fox et al. 2005). Using the measured opening angles and lower limits of ! 10 −25◦, a likely median for short GRBs
is #θj$ ≈ 10◦.
The opening angle distribution of short GRBs impacts the true energy scale and event rate. The true energy is lower than the isotropic-equivalent value by the beaming factor, fb ( fb ≡ 1 − cos(θj), E = fbEiso), while the actual
event rate is increased by f−1
b . For GRB 130603B, with
an opening angle of ≈ 4 − 8◦, the resulting beaming factor
is fb ≈ (0.2 − 1) × 10−2. Therefore, the true energies are
Eγ ≈ (0.5 − 2) × 1049 erg and EK ≈ (0.1 − 1.6) × 1049 erg.
The small population of short GRBs with well-constrained opening angles have beaming-corrected energies of Eγ ≈
EK ≈ 1049 erg (Soderberg et al. 2006; Burrows et al. 2006;
Grupe et al. 2006; Fong et al. 2012; Nicuesa Guelbenzu et al. 2012), roughly two orders of magnitude below the inferred true energies for long GRBs (Frail et al. 2001; Bloom et al. 2003; Kocevski & Butler 2008; Racusin et al. 2009).
The true event rate is elevated compared to the observed rate by fb−1. The current estimated observed short GRB volumetric rate is ≈ 10 Gpc−3 yr−1 (Nakar et al. 2006).
For a median opening angle of ≈ 10◦, the median
in-強く絞られたものから、
広く開いたものまで存在
=>平均 〜
10°
=>
GWと同時に観測される割合は低い。
イベントレート
“beaming collected” SGRB rate: 0.7 /Myr/Mpc^3
(Guepa & Piran 2005)
Expected NS-‐NS merger rate: 1/Myr/Mpc^3
(Kalogera et al 2004)
Fong et al 2013
θ
j
ショートガンマ線バーストの長短
長所:
とても明るいので、現行の観測衛星で観測可能。
ショートガンマ線バーストの親星の
smoking gun。
短所:
相対論的ビーミング+絞られたジェットのため、
真っ正面の観測者にしか見えない。
Outline
•
連星中性子星合体からの重力波
• 連星中性子星合体に付随する電磁波
•
まとめ
ü
ショートガンマ線バースト
ü 質量放出に伴う等方電磁波放射
ü
Short GRB 130603B の巨新星
相対論的ジェット
=>short GRB
ü インスパイラル
=>重力波放射
ü 合体
⇒ 質量放出
ü ブラックホール形成
=> 相対論的ジェット形成
合体=>質量放出=>
(等方)電磁波放射
NS-‐NS合体では、質量放出は起こるのか?
質量放出が起こるとすると、どう光るのか?
数値相対論シミュレーション:赤道面の質量放出
300 km x 300 km 2400 km x 2400 km
Model : 1.2Msun – 1.5Msun, EOS=APR
log(density g/cc)
300 km x 300 km 2400 km x 2400 km
Model : 1.2Msun – 1.5Msun, EOS=APR
log(density g/cc)
質量放出
: Mej 〜 0.01Msun, v 〜 0.2c
数値相対論シミュレーション:赤道面の質量放出
質量放出機構
(潮汐トルク)
Heavy NS
Light NS
1. 軽い星が引き延ばされる
2. 外側が角運動量をもらう
3. 系から脱出する
特徴:物質の放出は、
赤道面に集中する。
log(density g/cc)
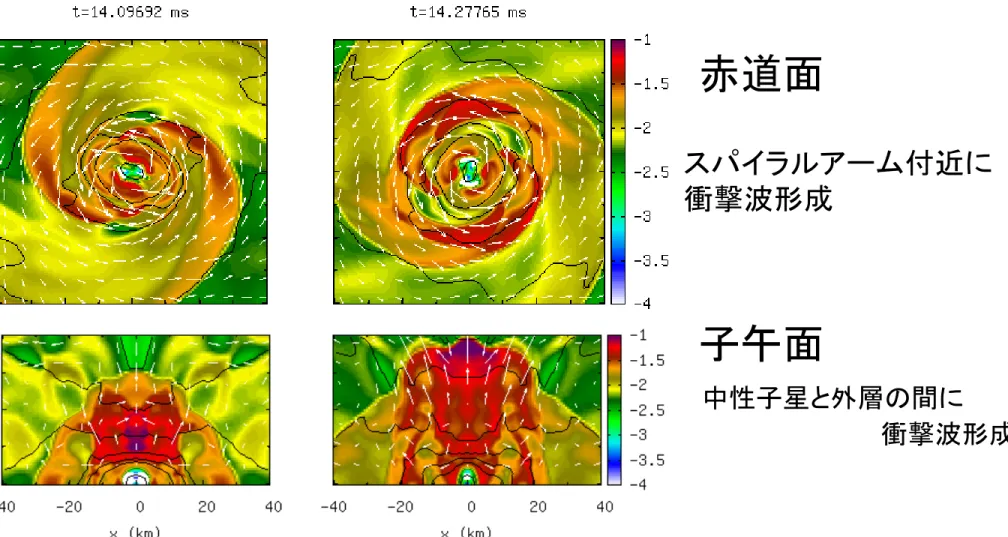
質量放出機構
~衝撃波加熱~
Model=135Msun-‐1.35Msun, APR
12 0 5e+14 1e+15 1.5e+15 0 10 20 30 40 ρ c (g/cm 3 ) t (ms) APR4-135135 ALF2-135135 H4-135135 MS1-135135 0 5e+14 1e+15 1.5e+15 0 10 20 30 40 ρ c (g/cm 3 ) t (ms) APR4-120150 ALF2-120150 H4-120150 MS1-120150FIG. 6: The central density as a function of time for models with m1 = m2 = 1.35M (left), and m1 = 1.2M and m2 = 1.5M
(right). Before the merger of unequal mass binaries, the central density of heavier neutron stars are plotted. th = 1.8 is
employed for the results presented here.
FIG. 7: Snapshots of the thermal part of the specific internal energy ("th) profile in the vicinity of HMNSs on the equatorial
(top) and x-z (bottom) planes for an equal-mass model APR4-135135. The rest-mass density contours are overplotted for every
decade from 1015 g/cm3.
Figures 3 – 5 indicate that there are two important
processes for the mass ejection. The first one is the
heating by shocks formed at the onset of the merger between the inner surfaces of two neutron stars. Fig-ures 7 and 8 display snapshots of the thermal part of the
specific internal energy, "th, in the vicinity of HMNSs
for APR4-135135 and APR4-120150, respectively. These
figures show clearly that hot materials with "th <⇠ 0.1
(1.0 <⇠ 100MeV) are indeed ejected from the HMNSs,
in particular, to bidirectional regions on the equatorial plane and to the polar region. This suggests that the shock heating works efficiently to eject materials from
Specific internal energy
スパイラルアーム付近に
衝撃波形成
中性子星と外層の間に
衝撃波形成
赤道面
子午面
0.01
0.1
1
10
0.13
0.14
0.15
0.16
0.17
0.18
0.19
0.2
M
ej/10
-2M
sunM
tot/2R
1.35NS-NS models
APR4 SLy ALF2 H4 MS10.01
0.1
1
10
0.13
0.14
0.15
0.16
0.17
0.18
0.19
M
ej/10
-2M
sunM
NS/R
1.35BH-NS models
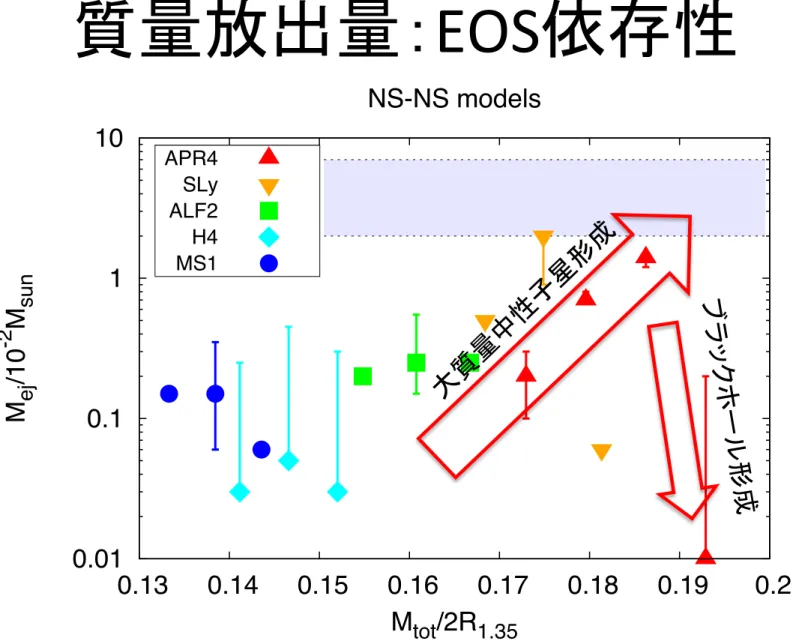
APR4 ALF2 H4 MS1 ALF2(7,0.5) H4(7,0.5) MS1(7,0.5)Figure 8.2: Ejecta masses as a function of the compactness of the neutron star, which is
defined by GM
tot
/2R
1.35
c
2
and GM
NS
/R
1.35
c
2
for NS–NS and BH–NS models, respectively.
Left panel: NS–NS models. Each point shows the ejecta mass for the equal mass cases.
Error bars denote the dispersion of the ejecta masses due to the various mass ratios.
Right panel: BH–NS models. The filled and open symbols correspond to the models
with (Q, χ) = (3–7, 0.75) and (7, 0.5), respectively. The blue shaded region in each panel
shows the allowed ejecta masses to reproduce the observed near-infrared excess of GRB
130603B, 0.02
! M
ej
/M
!
! 0.07 and 0.02 ! M
ej
/M
!
! 0.1 for NS-NS and BH-NS
models, respectively. The lower and upper bounds are imposed by the hypothetical
high-and low-heating models, respectively. This figure is taken from Hotokezaka et al. (2013d).
employ the heating rate computed with the abundance distribution that reproduces the
solar r-process pattern (see Tanaka et al. 2013 for more detail). Heating is due to
β-decays only, which increase the atomic numbers from the neutron-rich region toward the
β-stability line without changing the mass number A. This heating rate is in reasonable
agreement with those from previous nucleosynthesis calculations (Metzger et al. 2010;
Goriely et al. 2011; Grossman et al. 2013) except for the first several seconds.
We note that there could exist quantitative uncertainties in the heating rate as well
as in the opacities. As an example, the heating rate would be about a factor 2 higher
if the r-process abundances of A
∼ 130 (or those produced with the electron fraction of
Y
e
∼ 0.2) were dominant in the ejecta (Metzger et al. 2010; Grossman et al. 2013). To
take into account such uncertainties, we also consider the cases in which the light curves
of mergers are twice and half as luminous (high- and low-heating models; only explicitly
shown for the NS–NS models in Fig. 3) as those computed with the fiducial-heating model.
8.4
Light curves and possible progenitor models
The computed light curves and observed data in r and H-band are compared in Fig. 8.3.
The left panel of Fig. 8.3 shows the light curves of the NS–NS merger models SLy (Q =
121
質量放出量:
EOS依存性
ブ
ラ
ッ
ク
ホ
ー
ル形成
超大質量中性子星形成に伴って、多くの物質が放出される。
30
28
26
-‐2 0 2 4 6 8 10
log
(L) [
er
g/s]
Log
Lu
m
in
os
ity
(e
rg
/s
/Hz)
log(t) [s]
Merger remnant
(radio)
Kilonova
/Macronova
(NIR)
Extended Emission (X)
GRB Aferglow (X)
Merger Breakout (X)
GRB Aferglow (visible)
GRB aferglow
(radio)
GRB (X~γ)
52
50
48
46
44
42
log
(Lν
) [
er
g/
s/
Hz]
Merger Breakout (radio)
質量放出にともなう電磁波:予想光度曲線
(4π)
時間
明るさ
30
28
26
-‐2 0 2 4 6 8 10
log
(L) [
er
g/s]
Log
Lu
m
in
os
ity
(e
rg
/s
/Hz)
log(t) [s]
Merger remnant
(radio)
Kilonova
/Macronova
(opt-‐NIR)
Extended Emission (X
)
GRB Aferglow (X)
Merger Breakout (X)
GRB Aferglow (visible)
GRB aferglow
(radio)
GRB (X~γ)
52
50
48
46
44
42
log
(Lν
) [
er
g/
s/
Hz]
Merger Breakout (radio)
時間
明るさ
質量放出にともなう電磁波:予想光度曲線
(4π、
非環境依存
)
環境に依存する放射は、
村瀬孔太氏の講演
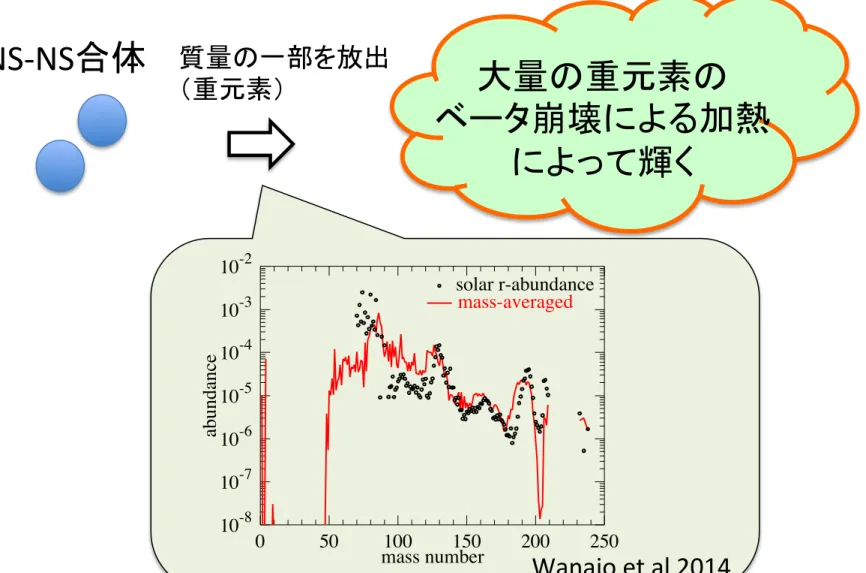
大量の重元素の
ベータ崩壊による加熱
によって輝く
NS-‐NS合体
質量の一部を放出
(重元素)
Kilonova/Macronova (巨新星)
NS-‐NS合体の可視光対応天体として予想。Li & Paczynski 1998
Nova < Kilonova/Macronova < Supernova
4 Wanajo et al. mass number abundance 0 50 100 150 200 250 10-8 10-7 10-6 10-5 10-4 10-3 10-2 Y e = 0.09 0.14 0.19 0.24 0.34 0.44 mass number abundance 0 50 100 150 200 250 10-8 10-7 10-6 10-5 10-4 10-3 10-2
mass-averagedsolar r-abundance
Fig. 4.—Final nuclear abundances for selected trajectories (top; Ye = 0.09, 0.14, 0.19, 0.24, 0.34, and 0.44) and that mass-averaged (bottom; compared with the solar r-process abundances).
abundances by weighting the final yields for the repre-sentative trajectories with their Ye mass fractions
(Fig-ure 3). We find a remarkable agreement of our result with the solar r-process abundance distribution over the full-A range of ∼ 90–240. This striking result, differ-ing from the previous works exhibitdiffer-ing production of A > 130 nuclei only, is a consequence of the wide Ye
distribution predicted from our full-GR merger simula-tion with neutrino effects taken into account. Note also that fission plays only a subdominant role for the fi-nal nucleosynthetic abundances. The second (A ∼ 130) and rare-earth-element (A ∼ 160) peak abundances are dominated by direct production from the trajectories of Ye ∼0.2. Our result reasonably reproduces the solar-like
abundance ratio between the second (A ∼ 130) and third (A ∼ 195) peaks as well, which is difficult to explain by fission recycling.
Given that the model is representative of NS-NS merg-ers, our result gives an important implication; the dy-namical component of NS-NS merger ejecta can be the dominant origin of the Galactic r-process nuclei. Other contributions from, e.g., the BH-torus wind after col-lapse of HMNSs (Surman et al. 2008; Wanajo & Janka 2012; Fern´andez & Metzger 2013), as invoked in the pre-vious studies to account for the (solar-like) r-process uni-versality, may not be needed. The amount of the en-tirely r-processed ejecta, Mej ≈ 0.01 M!, with present
estimates of the Galactic event rate, a few 10−5 yr−1
(e.g., Dominik et al. 2012), is also compatible with
the mass of the Galactic r-process abundances (e.g., Wanajo & Janka 2012).
4. RADIOACTIVE HEATING
The r-processing ends a few 100 ms after the onset of merger. The subsequent abundance changes by β-decay, fission, and α-decay are followed up to 100 days after the merging; the resulting radioactive heating is rel-evant for kilonova emission. Figure 5 displays the tempo-ral evolutions of the heating rates for selected trajecto-ries (top-left) and those mass-averaged (top-right). For a comparison purpose, the heating rate for the nuclear abundances with the solar r-process pattern ( ˙qsolar-r),
β-decaying back from the initial composition at neutron-separation energies of 2 MeV (A ≥ 90, the same as that used in Hotokezaka et al. 2013a; Tanaka et al. 2014), is also shown by a black-solid line in each panel. The short-dashed line indicates an analytical approximation defined by ˙qanalytic ≡2 × 10¹⁰t−1.3 (in units of erg g−1 s−1; t is
time in day, see, e.g., Metzger et al. 2010). Lower panels are the same as the upper panels, but for those relative to ˙qanalytic.
Overall, each curve reasonably follows ˙qanalytic by ∼
1 day. After this time, the heating is dominated by a few radioactivities and becomes highly dependent on Ye. Contributions from the ejecta of Ye > 0.3 are
gen-erally unimportant after ∼ 1 day. We find that the heating for Ye = 0.34 turns to be significant after a few
10 days because of the β-decays from 85Kr (half-life of T1/2 = 10.8 yr; see Figure 4, bottom, for its large
abun-dance), 89Sr (T
1/2 = 50.5 d), and 103Ru (T1/2 = 39.2 d).
Heating rates for Ye = 0.19 and 0.24, whose
abun-dances are dominated by the second peak nuclei, are found to be in good agreement with ˙qsolar-r. This is due
to a predominance of β-decay heating from the second peak abundances, e.g., 123Sn (T1/2 = 129 d) and 125Sn
(T1/2 = 9.64 d) around a few 10 days.
Our result shows that the heating rate for the lowest Ye
( = 0.09) is the greatest after 1 day (Figure 5, left panels). The values are larger than the previous results (with Ye ∼
0.02–0.04 in Goriely et al. 2011; Rosswog et al. 2014) by a factor of a few. In our case, the radioactive heating is dominated by the spontaneous fissions of 254Cf, 259Fm and 262Fm. It should be noted, however, the heating from spontaneous fission is highly uncertain because of the many unknown half-lives and decay modes of nuclides reaching to this quasi-stable region (A ∼ 250–260 with T1/2 of days to years). In fact, tests with another set of theoretical estimates show a few times smaller rates after ∼ 1 day (as a result of diminishing contributions from 259Fm and 262Fm), being similar to the previous works. It appears, therefore, difficult to obtain reliable heating rates with currently available nuclear data when fission plays a dominant role.
In our result the total heating rate is dominated by β-decays all the times (Figure 5, right panels) because of the small ejecta amount of Ye < 0.15 (in which
fis-sion becomes important). The radioactive heating after ∼1 day is mostly due to the β-decays from a small num-ber of species with precisely measured half-lives. Uncer-tainties in nuclear data are thus irrelevant. The mass-averaged heating rate for t ∼ 1–10 days is smaller than ˙qanalytic and ˙qsolar-r because of the overabundances near
Radiative Transfer Simulations for NS Merger Ejecta
9
20 21 22 23 24 25 26 27 0 5 10 15 20 Observed magnitudeDays after the merger
u band 200 Mpc NSM-all APR4 (soft) H4 (stiff) 4m 8m 1.2 + 1.5 1.3 + 1.4 20 21 22 23 24 25 26 27 0 5 10 15 20 Observed magnitude
Days after the merger
g band 200 Mpc 1m 4m 8m 20 21 22 23 24 25 26 27 0 5 10 15 20 Observed magnitude
Days after the merger
r band 200 Mpc 1m 4m 8m 20 21 22 23 24 25 26 27 0 5 10 15 20 Observed magnitude
Days after the merger
i band 200 Mpc 1m 4m 8m 20 21 22 23 24 25 26 27 0 5 10 15 20 Observed magnitude
Days after the merger
z band 200 Mpc 1m 4m 8m 20 21 22 23 24 25 26 27 0 5 10 15 20 Observed magnitude
Days after the merger
J band 200 Mpc 4m space 20 21 22 23 24 25 26 27 0 5 10 15 20 Observed magnitude
Days after the merger
H band 200 Mpc 4m space 20 21 22 23 24 25 26 27 0 5 10 15 20 Observed magnitude
Days after the merger
K band 200 Mpc 4m
space
Fig. 8.—
Expected observed ugrizJ HK-band light curves (in AB magnitude) for model NSM-all and 4 realistic models. The distance
to the NS merger event is set to be 200 Mpc. K correction is taken into account with z = 0.05. Horizontal lines show typical limiting
magnitudes for wide-field telescopes (5σ with 10 min exposure). For optical wavelengths (ugriz bands), “1 m”, “4 m”, and “8 m” limits
are taken or deduced from those of PTF (Law et al. 2009), CFHT/Megacam, and Subaru/HSC (Miyazaki et al. 2006), respectively. For
NIR wavelengths (J HK bands), “4 m” and “space” limits are taken or deduced from those of Vista/VIRCAM and the planned limits of
WFIRST (Green et al. 2012) and WISH (Yamada et al. 2012), respectively.
Radiative Transfer Simulations for NS Merger Ejecta
9
20 21 22 23 24 25 26 27 0 5 10 15 20 Observed magnitude
Days after the merger
u band 200 Mpc NSM-all APR4 (soft) H4 (stiff) 4m 8m 1.2 + 1.5 1.3 + 1.4 20 21 22 23 24 25 26 27 0 5 10 15 20 Observed magnitude
Days after the merger
g band 200 Mpc 1m 4m 8m 20 21 22 23 24 25 26 27 0 5 10 15 20 Observed magnitude
Days after the merger
r band 200 Mpc 1m 4m 8m 20 21 22 23 24 25 26 27 0 5 10 15 20 Observed magnitude
Days after the merger
i band 200 Mpc 1m 4m 8m 20 21 22 23 24 25 26 27 0 5 10 15 20 Observed magnitude
Days after the merger
z band 200 Mpc 1m 4m 8m 20 21 22 23 24 25 26 27 0 5 10 15 20 Observed magnitude
Days after the merger
J band 200 Mpc 4m space 20 21 22 23 24 25 26 27 0 5 10 15 20 Observed magnitude
Days after the merger
H band 200 Mpc 4m space 20 21 22 23 24 25 26 27 0 5 10 15 20 Observed magnitude
Days after the merger
K band 200 Mpc 4m
space
Fig. 8.—
Expected observed ugrizJHK-band light curves (in AB magnitude) for model NSM-all and 4 realistic models. The distance
to the NS merger event is set to be 200 Mpc. K correction is taken into account with z = 0.05. Horizontal lines show typical limiting
magnitudes for wide-field telescopes (5σ with 10 min exposure). For optical wavelengths (ugriz bands), “1 m”, “4 m”, and “8 m” limits
are taken or deduced from those of PTF (Law et al. 2009), CFHT/Megacam, and Subaru/HSC (Miyazaki et al. 2006), respectively. For
NIR wavelengths (JHK bands), “4 m” and “space” limits are taken or deduced from those of Vista/VIRCAM and the planned limits of
WFIRST (Green et al. 2012) and WISH (Yamada et al. 2012), respectively.
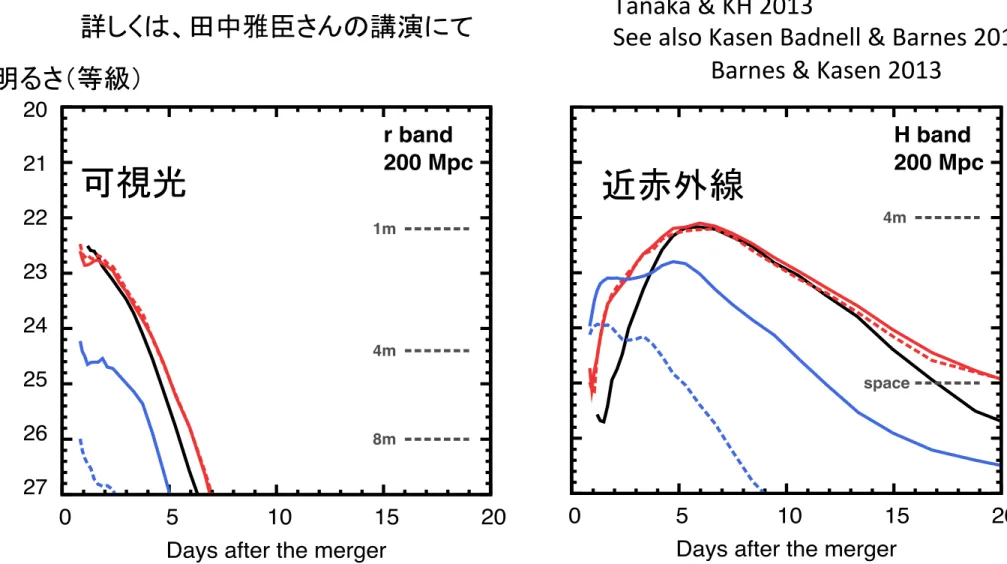
可視光
近赤外線
Tanaka & KH 2013
See also Kasen Badnell & Barnes 2013
Barnes & Kasen 2013
Kilonova/Macronova の予想光度曲線
可視の赤側から、赤外にかけて
day〜weekで増光
詳しくは、田中雅臣さんの講演にて
明るさ(等級)
Radiative Transfer Simulations for NS Merger Ejecta
9
20 21 22 23 24 25 26 27 0 5 10 15 20 Observed magnitude
Days after the merger
u band 200 Mpc NSM-all APR4 (soft) H4 (stiff) 4m 8m 1.2 + 1.5 1.3 + 1.4 20 21 22 23 24 25 26 27 0 5 10 15 20 Observed magnitude
Days after the merger
g band 200 Mpc 1m 4m 8m 20 21 22 23 24 25 26 27 0 5 10 15 20 Observed magnitude
Days after the merger
r band 200 Mpc 1m 4m 8m 20 21 22 23 24 25 26 27 0 5 10 15 20 Observed magnitude
Days after the merger
i band 200 Mpc 1m 4m 8m 20 21 22 23 24 25 26 27 0 5 10 15 20 Observed magnitude
Days after the merger
z band 200 Mpc 1m 4m 8m 20 21 22 23 24 25 26 27 0 5 10 15 20 Observed magnitude
Days after the merger
J band 200 Mpc 4m space 20 21 22 23 24 25 26 27 0 5 10 15 20 Observed magnitude
Days after the merger
H band 200 Mpc 4m space 20 21 22 23 24 25 26 27 0 5 10 15 20 Observed magnitude
Days after the merger
K band 200 Mpc
4m
space
Fig. 8.— Expected observed ugrizJHK-band light curves (in AB magnitude) for model NSM-all and 4 realistic models. The distance
to the NS merger event is set to be 200 Mpc. K correction is taken into account with z = 0.05. Horizontal lines show typical limiting magnitudes for wide-field telescopes (5σ with 10 min exposure). For optical wavelengths (ugriz bands), “1 m”, “4 m”, and “8 m” limits are taken or deduced from those of PTF (Law et al. 2009), CFHT/Megacam, and Subaru/HSC (Miyazaki et al. 2006), respectively. For NIR wavelengths (JHK bands), “4 m” and “space” limits are taken or deduced from those of Vista/VIRCAM and the planned limits of WFIRST (Green et al. 2012) and WISH (Yamada et al. 2012), respectively.
Outline
•
連星中性子星合体からの重力波
• 連星中性子星合体に付随する電磁波
•
まとめ
ü
ショートガンマ線バースト
ü
質量放出に伴う電磁波放射
ü
Short GRB 130603B の巨新星
2013年、 “Kilonova/Macronova”発見?
ショートガンマ線バースト
GRB 130603Bの後に、
“Kilonova/Macronova”の初めての観測に成功。
Tanvir et al.,Nature,2013
Berger et al., ApJ, 2013
de Ugarte PosTgo et al, 2013
ü ショートガンマ線バーストがコンパクト連星合体起源である傍証
ü
R-‐process の起源に迫る (地球質量の数10倍の金が生産)
Page 8 of 16
Figure 1 HST imaging of the location of SGRB 130603B. The host is well resolved
and displays a disturbed, late-type morphology. The position (coordinates RA
J2000
= 11
28 48.16, Dec
J2000
= +17 04 18.2) at which the SGRB occurred (determined from
ground-based imaging) is marked as a red circle, lying slightly off a tidally distorted
spiral arm. The left-hand panel shows the host and surrounding field from the higher
resolution optical image. The next panels show in sequence the first epoch and second
epoch imaging, and difference (upper row F606W/optical and lower row F160W/nIR).
The difference images have been smoothed with a Gaussian of width similar to the psf,
to enhance any point-source emission. Although the resolution of the nIR image is
inferior to the optical, we clearly detect a transient point source, which is absent in the
optical.
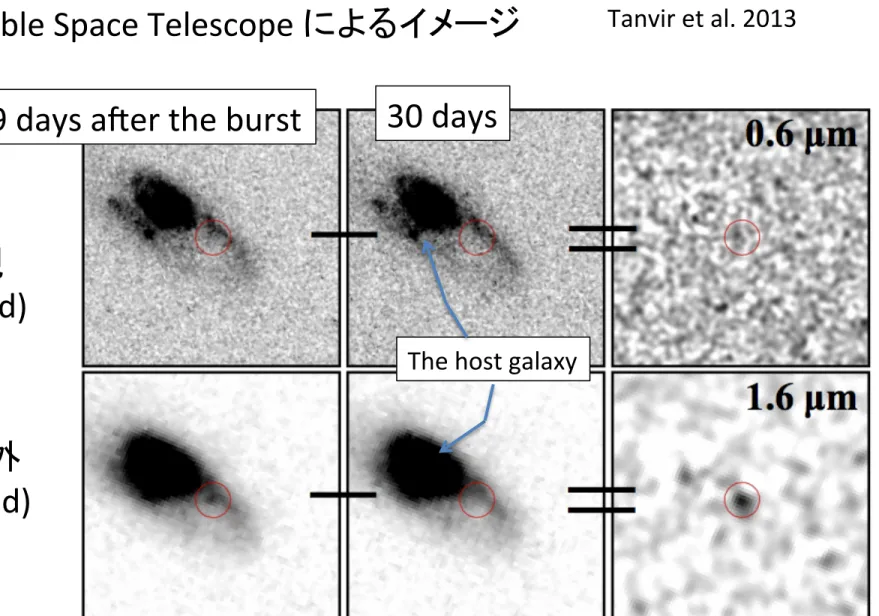
u Hubble Space Telescope によるイメージ
可視
(r-‐band)
近赤外
(H-‐band)
9 days afer the burst
30 days
The host galaxy
Tanvir et al. 2013
Radiative Transfer Simulations for NS Merger Ejecta
9
20 21 22 23 24 25 26 27 0 5 10 15 20 Observed magnitudeDays after the merger
u band 200 Mpc NSM-all APR4 (soft) H4 (stiff) 4m 8m 1.2 + 1.5 1.3 + 1.4 20 21 22 23 24 25 26 27 0 5 10 15 20 Observed magnitude
Days after the merger
g band 200 Mpc 1m 4m 8m 20 21 22 23 24 25 26 27 0 5 10 15 20 Observed magnitude
Days after the merger
r band 200 Mpc 1m 4m 8m 20 21 22 23 24 25 26 27 0 5 10 15 20 Observed magnitude
Days after the merger
i band 200 Mpc 1m 4m 8m 20 21 22 23 24 25 26 27 0 5 10 15 20 Observed magnitude
Days after the merger
z band 200 Mpc 1m 4m 8m 20 21 22 23 24 25 26 27 0 5 10 15 20 Observed magnitude
Days after the merger
J band 200 Mpc 4m space 20 21 22 23 24 25 26 27 0 5 10 15 20 Observed magnitude
Days after the merger
H band 200 Mpc 4m space 20 21 22 23 24 25 26 27 0 5 10 15 20 Observed magnitude
Days after the merger
K band 200 Mpc 4m
space
Fig. 8.—
Expected observed ugrizJ HK-band light curves (in AB magnitude) for model NSM-all and 4 realistic models. The distance
to the NS merger event is set to be 200 Mpc. K correction is taken into account with z = 0.05. Horizontal lines show typical limiting
magnitudes for wide-field telescopes (5σ with 10 min exposure). For optical wavelengths (ugriz bands), “1 m”, “4 m”, and “8 m” limits
are taken or deduced from those of PTF (Law et al. 2009), CFHT/Megacam, and Subaru/HSC (Miyazaki et al. 2006), respectively. For
NIR wavelengths (J HK bands), “4 m” and “space” limits are taken or deduced from those of Vista/VIRCAM and the planned limits of
WFIRST (Green et al. 2012) and WISH (Yamada et al. 2012), respectively.
Radiative Transfer Simulations for NS Merger Ejecta
9
20 21 22 23 24 25 26 27 0 5 10 15 20 Observed magnitude
Days after the merger
u band 200 Mpc NSM-all APR4 (soft) H4 (stiff) 4m 8m 1.2 + 1.5 1.3 + 1.4 20 21 22 23 24 25 26 27 0 5 10 15 20 Observed magnitude
Days after the merger
g band 200 Mpc 1m 4m 8m 20 21 22 23 24 25 26 27 0 5 10 15 20 Observed magnitude
Days after the merger
r band 200 Mpc 1m 4m 8m 20 21 22 23 24 25 26 27 0 5 10 15 20 Observed magnitude
Days after the merger
i band 200 Mpc 1m 4m 8m 20 21 22 23 24 25 26 27 0 5 10 15 20 Observed magnitude
Days after the merger
z band 200 Mpc 1m 4m 8m 20 21 22 23 24 25 26 27 0 5 10 15 20 Observed magnitude
Days after the merger
J band 200 Mpc 4m space 20 21 22 23 24 25 26 27 0 5 10 15 20 Observed magnitude
Days after the merger
H band 200 Mpc 4m space 20 21 22 23 24 25 26 27 0 5 10 15 20 Observed magnitude
Days after the merger
K band 200 Mpc 4m
space
Fig. 8.—
Expected observed ugrizJHK-band light curves (in AB magnitude) for model NSM-all and 4 realistic models. The distance
to the NS merger event is set to be 200 Mpc. K correction is taken into account with z = 0.05. Horizontal lines show typical limiting
magnitudes for wide-field telescopes (5σ with 10 min exposure). For optical wavelengths (ugriz bands), “1 m”, “4 m”, and “8 m” limits
are taken or deduced from those of PTF (Law et al. 2009), CFHT/Megacam, and Subaru/HSC (Miyazaki et al. 2006), respectively. For
NIR wavelengths (JHK bands), “4 m” and “space” limits are taken or deduced from those of Vista/VIRCAM and the planned limits of
WFIRST (Green et al. 2012) and WISH (Yamada et al. 2012), respectively.
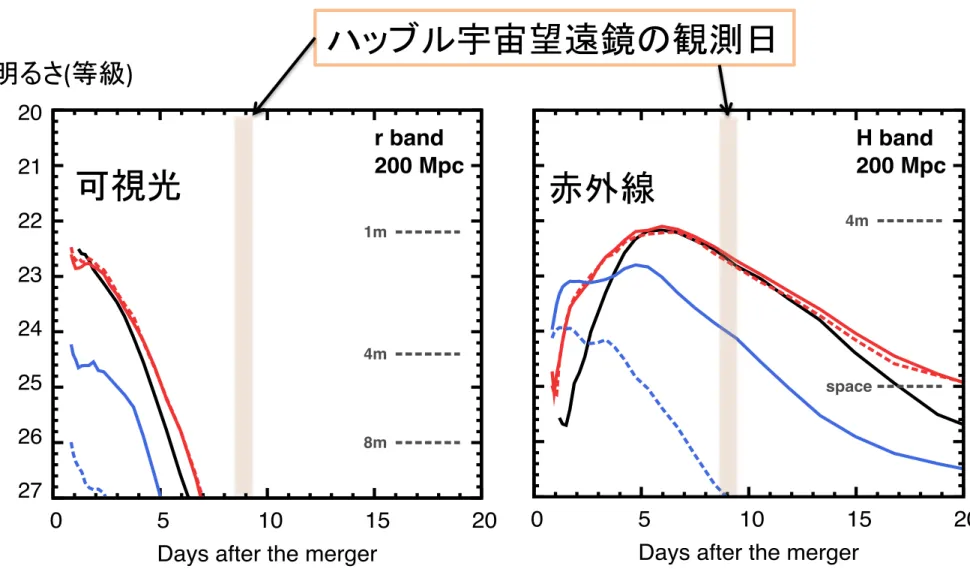
ハッブル宇宙望遠鏡の観測日
可視光
赤外線
Tanaka & KH 2013
明るさ
(等級)
Radiative Transfer Simulations for NS Merger Ejecta
9
20 21 22 23 24 25 26 27 0 5 10 15 20 Observed magnitude
Days after the merger
u band 200 Mpc NSM-all APR4 (soft) H4 (stiff) 4m 8m 1.2 + 1.5 1.3 + 1.4 20 21 22 23 24 25 26 27 0 5 10 15 20 Observed magnitude
Days after the merger
g band 200 Mpc 1m 4m 8m 20 21 22 23 24 25 26 27 0 5 10 15 20 Observed magnitude
Days after the merger
r band 200 Mpc 1m 4m 8m 20 21 22 23 24 25 26 27 0 5 10 15 20 Observed magnitude
Days after the merger
i band 200 Mpc 1m 4m 8m 20 21 22 23 24 25 26 27 0 5 10 15 20 Observed magnitude
Days after the merger
z band 200 Mpc 1m 4m 8m 20 21 22 23 24 25 26 27 0 5 10 15 20 Observed magnitude
Days after the merger
J band 200 Mpc 4m space 20 21 22 23 24 25 26 27 0 5 10 15 20 Observed magnitude
Days after the merger
H band 200 Mpc 4m space 20 21 22 23 24 25 26 27 0 5 10 15 20 Observed magnitude
Days after the merger
K band 200 Mpc
4m
space
Fig. 8.— Expected observed ugrizJHK-band light curves (in AB magnitude) for model NSM-all and 4 realistic models. The distance
to the NS merger event is set to be 200 Mpc. K correction is taken into account with z = 0.05. Horizontal lines show typical limiting magnitudes for wide-field telescopes (5σ with 10 min exposure). For optical wavelengths (ugriz bands), “1 m”, “4 m”, and “8 m” limits are taken or deduced from those of PTF (Law et al. 2009), CFHT/Megacam, and Subaru/HSC (Miyazaki et al. 2006), respectively. For NIR wavelengths (JHK bands), “4 m” and “space” limits are taken or deduced from those of Vista/VIRCAM and the planned limits of WFIRST (Green et al. 2012) and WISH (Yamada et al. 2012), respectively.
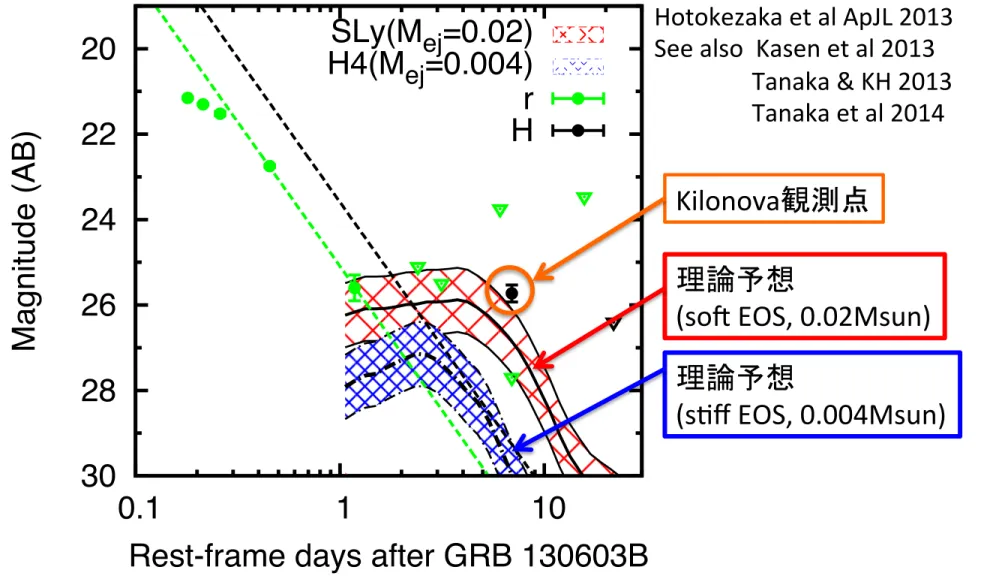
数値相対論+輻射輸送
vs 観測データ
Hotokezaka et al ApJL 2013
See also Kasen et al 2013
Tanaka & KH 2013
Tanaka et al 2014
20
22
24
26
28
30
0.1
1
10
Magnitude (AB)
Rest-frame days after GRB 130603B
SLy(M
ej
=0.02)
H4(M
ej
=0.004)
r
H
20
22
24
26
28
30
0.1
1
10
Magnitude (AB)
Rest-frame days after GRB 130603B
MS1(M
ej
=0.07)
H4(M
ej
=0.05)
APR4(M
ej
=0.01)
r
H
Figure 8.3: Predicted light curves for NS–NS and BH–NS models. Left panel: NS–
NS models. The dashed, solid, and dot-dashed curves show the H-band light curves
for the models: SLy (Q = 1.0, M
ej
= 0.02M
!
), H4 (Q = 1.25, M
ej
= 4
× 10
−3
M
!
),
respectively. The total mass of the progenitor is fixed to be 2.7M
!
. The upper, middle,
and lower curves for each model correspond to the high-, fiducial- and low-heating models.
Right panel: BH-NS models. The dashed, solid, and dot-dashed curves show the models
MS1 (M
ej
= 0.07M
!
), H4 (M
ej
= 0.05M
!
), and APR4 (M
ej
= 0.01M
!
), respectively.
Here only the fiducial-heating models are shown. The thin and thick lines denote the
r and H-band light curves. Here we set (Q, χ) = (3, 0.75). The observed data (filled
circles), upper limits (triangles), and the light curves (dashed lines) of the afterglow model
of GRB 130603B in r and H-band are plotted (Tanvir et al. 2013; de Ugarte Postigo et al.
2013). The observed point in r-band at 1 days after the GRB is consistent with the
afterglow model. The key observations for a kilonova are the observed H-band data at
7 days after the GRB, which exceed the H-band light curve of the afterglow model, and
the upper limit in H-band at 22 days after the GRB. These data suggest the existence
of a kilonova associated with GRB 130603B. This figure is taken from Hotokezaka et al.
(2013d).
124
ü コンパクト連星合体の質量放出(特に、sof EOS)でよく説明できる。
ü
Kilonova/Macronovaから、r-‐process 元素の生産量を見積もれる。
Kilonova観測点
理論予想
(sof EOS, 0.02Msun)
理論予想
まとめ
Ø コンパクト連星合体からの重力波の検出から推定可能量。
Ø コンパクト連星合体時に一部の質量が放出される。
質量放出に伴う電磁波対応天体の観測に期待!
Ø
Short GRB 130603Bに伴った赤外線増光。
Mej > 0.01Msunのr-‐process kilonova (macronova)?
ü 中性子星の半径
ü 波源までの距離
ü イベントレート
ü 天体の質量
ü 合体時刻
ü 脱出速度程度
ü
0.0001 〜 0.01Msun
ü 比較的、等方的
ü ショートガンマ線バースト:明るいけど、稀にしか見えないだろう。
ü
Kilonova/Macronova: 可視(赤)〜赤外で観測できる。
30
28
26
-‐2 0 2 4 6 8 10
log
(L) [
er
g/s]
Log
Lu
m
in
os
ity
(e
rg
/s
/Hz)
log(t) [s]
Merger remnant
(radio)
Kilonova
/Macronova
(opt-‐NIR)
Extended Emission (X)
GRB Aferglow (X)
Merger Breakout (X)
GRB Aferglow (visible)
GRB aferglow
(radio)
GRB (X~γ)
52
50
48
46
44
42
log
(Lν
) [
er
g/
s/
Hz]
Merger Breakout (radio)
予想光度曲線
Norris & Bonnell (2006) Refs: Nakar (2007) Sari, Piran, Narayan (1998)Li & Paczynski (1998) Nakar & Piran (2012) Kyutoku, Ioka, Shibata (2012) Kelley, Mandel, Ramirez-‐Ruiz (2012)
Tanaka & Hotokezaka (2013) Nakamura et al (2013)