University English Class Placement Test Scores
journal or
publication title
福井大学国際交流センター紀要
volume
2
page range
35-49
year
2016-03-01
URL
http://hdl.handle.net/10098/10170
ABSTRACT
The study examined construct validation evidence for English class placement test scores used by one university language program in Japan. Placement test scores consisted of TOEIC listen-ing and readlisten-ing test scores, and five vocabulary scores from the Vocabulary Levels Test. Three research questions were posed and investigated. The first concerned the relationship of the test scores. Results showed that scores were unidimensional, sufficiently reliable, and correlated with one another. The second research question investigated whether placement test scores could predict end-of-semester 1 English course grades. It was found that only the TOEIC listening test scores predicted grades in a positive direction. The last research question examined whether the placement test scores predicted end-of-semester 1 TOEIC listening and reading scores, and it was found they did, though to varying degrees. Though such results can be viewed as positive construct validation evidence, more questions about the construct being tested and the fit of the placement test to the program remain to be studied.
Keywords: English class placement testing, construct validation INTRODUCTION
In Japan, examinations have long played an integral role in the educational system. In order to enter their schools of choice, students have had to study for and pass entrance examinations for university, high school, junior high school, and sometimes even before. Whether these high-stakes tests have done a proper job or not, though, is open to debate. University entrance exami-nations in Japan have been widely criticized (Brown, 1996; Brown & Yamashita, 1995; Murphey, 2001), and whether the criticism has spurred substantive change or not is unclear (Kikuchi, 2006). More study of all types of entrance examinations and more consideration of how to create better tests of all types seem clearly indicated.
Another type of test that is often used in Japanese universities is the placement test for Eng-lish language programs. This test is used to gauge students' language proficiency levels and then place students into classes at those levels. Most teachers and administrators agree that place-ment testing leads to better and more efficient teaching, and most would agree that the class placement affects and matters to students. In fact, though placement tests are generally lower stakes than entrance examinations, Brown (1989) noted that placement testing can be a "cold and
An Examination of Validation Evidence for University
English Class Placement Test Scores
Kristy King Takagi
detached" introduction to their English classes (p. 65). In addition, some teachers and researchers, such as Wistner and Sakai (2008), have made the point that placing students at the incorrect level can be harmful to students, often resulting in some degree of frustration, alienation, loss of confi-dence, or demotivation, for example. Therefore, in serving both student and program needs, a well-made placement test is a necessity for university English programs.
However, there is very little research on placement tests, and little agreement as to which English placement test might be best. Programs use a wide variety; some choose from a number of standardized tests, such as the TOEIC (Test of English for International Communication), TOEFL (Test of English as a Foreign Language), MEPT (Michigan English Placement Test), OPT (Oxford Placement Test), and others, but all have been criticized in one way or another. For example, Brown and Hudson (1998) and others have said that the well-known TOEFL, which has a wide and general focus, is neither precise enough to place students into classes in a particular program, nor relates directly enough to courses taught in an English program. The TOEIC has also been criticized. Though the Educational Testing Service (ets.org) claims that the TOEIC is a test of communicative competence in English, and that scores "provide accurate, reliable meas-urement of English proficiency," Chapman (2003) questioned the construct validity of the test as this sort of measure. In discussing what the test actually measures, Chapman maintained that the TOEIC was measuring a more limited range of English proficiency, receptive listening and reading skills. As for other standardized tests, Wistner and Sakai (2008) concluded that standard-ized tests generally "do not work well" for English class placement in Japan (p. 1047). They and others have recommended that programs create their own placement tests.
But creating tests is not an easy task either. As Spolsky (2000) said, "One of the easiest things to do, it has been suggested, is to develop a new kind of test―what is hard to know is what an ex-isting test really measures." In other words, whether we use a standardized test or one that we have created, it is often far from clear what tests measure. In order to build awareness of what our tests measure, we clearly need a shared theoretical foundation and starting place.
As Bachman (2000) said, Samuel Messick's ideas about test validity have provided a solid foundation for language testers as they think about and respond to questions about test validity and test consequences. In Bachman's words, "Messick's (1989) unitary view of validity―which brings together considerations of both the validity of interpretations and the consequences of test use―has become the paradigm for discussion, research and practice in educational and psy-chological measurement" (p. 21). Messick (1989) emphasized the need to understand what test scores mean in his discussion of validity and test validation. He explained that, even if we believe a test "works" for our program, using such test scores "without some understanding of what they mean is like using a drug that works without knowing its properties and reactions" (p. 8). In ex-plaining the process of test validation, Messick emphasized that validity is not a total of separate
types (content, criterion, etc.), with each one "enough" to justify using a particular test; rather, va-lidity is a unitary, though multi-faceted concept. The essence of vava-lidity, he said, lies in construct validity, and the goal of construct validation is to interpret test scores in a meaningful and trust-worthy manner (p. 8).
Evidence to be examined in building an argument for construct validation includes many types. Messick (1989) said that we want information about the "range and limit of content cover-age" and about other scores predicted by the test scores. He said that this kind of evidence "clearly contributes to score interpretation" (p. 8). Bachman (2004), in advocating Messick's ap-proach to test validation, also made clear that collecting validation evidence entails analyzing test content, correlating test scores with scores of other tests of the same ability, and correlating test scores with future performance (p. 260). Test score interpretation, then, should be our focus in test validation; as Messick (1989) said, the "bridge or connective tissue that sustains this unified view of validity is the meaningfulness or trustworthy interpretability of the test scores, which is the goal of construct validation" (p. 8).
By understanding and interpreting test scores, we can have a clear way to discuss construct validation. In this paper, building in a small way on Messick's foundation, I will examine construct validation evidence for English placement test scores used by one language program in Japan.
Research Questions
Research Question 1: How are the placement test scores related to each other?
Research Question 2: Do placement test scores predict end-of-semester 1 English course grades? Research Question 3: Do placement test scores predict TOEIC listening and reading scores at the end of semester 1?
METHOD Participants
The participants were 561 members of one cohort of freshman engineering students enrolled in a university in western Japan. The majority were Japanese, and 18 to 19 years of age. Their English proficiency upon entrance to university ranged from a total of 150 to 840, as measured by the TOEIC ( M = 345.08; SD = 91.71).
Materials TOEIC
Published by the Educational Testing Service, the TOEIC includes a four-part, 45-minute lis-tening test which contains 100 questions, together with a three-part, 75-minute reading test which also contains 100 questions. The scaled score for each test is 5 to 495 points, and the total
possible score is 990 points. Vocabulary Levels Test
This vocabulary test was developed, revised, and researched by the well-known I. S. P. Na-tion. As Nation (1990) explained, the vocabulary levels test was developed in order to determine where students need help with vocabulary learning. The test is divided into five levels, and each of the five tests contains 30 items. The 2,000 and 3,000 level tests contain high-frequency words; the Academic Word List test focuses on words needed for university study; the 5,000 level test contains words "on the boundary of high- and low-frequency words;" and the 10,000 level test con-tains low-frequency words (p. 79). Nation recommends that students master as many high-fre-quency words as possible since these words occur frequently, and that other vocabulary learning be tailored to student needs and goals.
Semester 1 English Course Grade
After completing one semester of an English course that met two times each week for 15 weeks and focused primarily on listening and speaking skills, students earned a final course grade which was based on a 100-point scale.
Procedures and Data Analysis
In order to answer the research questions, a number of statistical analyses were used. In an-swering the first question, I examined descriptive statistics, dimensionality (through principal components analysis), reliability, and correlations among test scores.
In answering the second research question (determining whether placement test scores pre-dicted the semester 1 English course grade) I conducted hierarchical multiple regression analysis. As Field (2005) explained, this analysis is used when the researcher decides the order of variables to be entered into the model based on theory and past research. Types of items on the TOEIC lis-tening and reading tests were not unlike the types of test items used in the university English course; therefore, the TOEIC scores were entered into the model first. The vocabulary scores were entered next, in order to determine whether they could predict the English course grade above and beyond the placement TOEIC scores.
In answering the third research question (determining whether placement test scores pre-dicted end-of-semester 1 TOEIC listening and reading scores), I also used hierarchical multiple regression. I again first entered the placement TOEIC scores, and then, the placement vocabu-lary scores into the model.
RESULTS
Research Question 1: How are the placement test scores related to each other?
The descriptive statistics for the placement TOEIC scores and vocabulary scores are pre-sented in Table 1 and Table 2 below. Results reveal that students scored approximately 50 points higher on the TOEIC listening test than on the reading test. As for vocabulary, students scored
an average of about 80% of the 2,000 most frequent words and about 63% of the words on the Academic Word List. As could be expected, scores on lower frequency words were rather low.
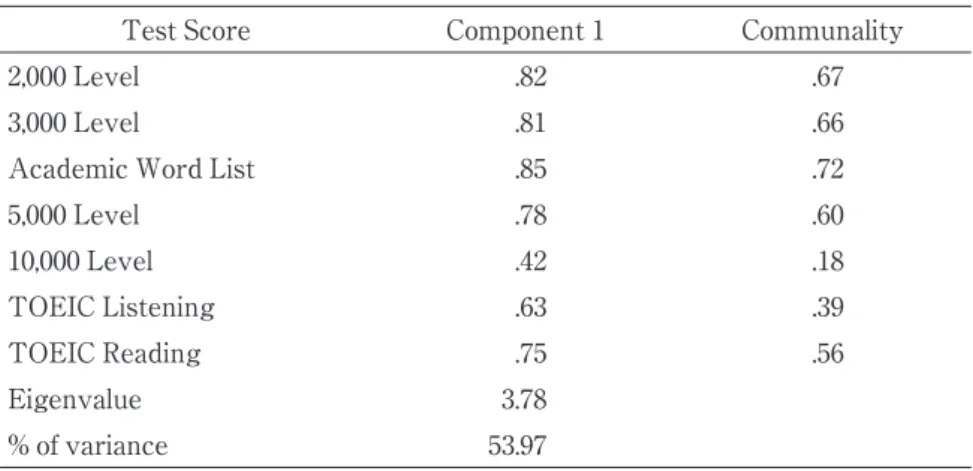
In order to check for unidimensionality of the placement vocabulary and TOEIC test scores, a principal components analysis was conducted. The results are presented in Table 3.
Table 1. Descriptive Statistics for Placement TOEIC Test Scores Placement TOEIC Listening Scores Placement TOEIC Reading Scores M 198.36 146.72 SE 2.29 2.02 95% CI [193.86, 202.86] [142.74, 150.70] SD 54.32 47.94 Skewness .70 1.25 SES .10 .10 Kurtosis 1.40 3.14 SEK .21 .21
Note. N = 561 for both tests. Maximum score for each test = 495. For Listening test,
range = 75-465. For Reading test, range = 35-410.
Table 2. Descriptive Statistics for the Placement Vocabulary Test Scores 2,000 Level 3,000 Level Academic Word List 5,000 Level 10,000 Level M 23.87 17.01 18.93 13.45 3.75 SE .18 .20 .22 .26 .14 95% CI [23.52, 24.22] [16.62, 17.41] [18.50, 19.37] [12.95, 13.95] [3.47, 4.03] SD 4.22 4.79 5.27 6.05 3.36 Skewness -1.30 -.07 -.48 -.45 .46 SES .10 .10 .10 .10 .10 Kurtosis 2.40 -.30 -.02 -.43 -.83 SEK .21 .21 .21 .21 .21
Note. N =561 for all vocabulary scores. For all tests, maximum score = 30. For 2,000 Level test, range
= 4-30; for 3,000 Level test, range = 3-29; for Academic Word List test, range = 0-30; for 5,000 Level test, range = 0-27; for 10,000 Level test, range = 0-13.
Table 3 results show that the placement vocabulary and TOEIC test scores are fundamen-tally unidimensional and account for 53.97% of the variance. According to Armor (1974), any fac-tor that accounts for 40 to 60% of the variance is a good solution; therefore, these results support the hypothesis that the placement tests are assessing a single dimension.
Table 3. Factor Loadings from Principal Components Analysis of Seven Placement Test
Scores: Communalities, Eigenvalue, and Percentage of Variance
Test Score Component 1 Communality
2,000 Level .82 .67
3,000 Level .81 .66
Academic Word List .85 .72
5,000 Level .78 .60 10,000 Level .42 .18 TOEIC Listening .63 .39 TOEIC Reading .75 .56 Eigenvalue 3.78 % of variance 53.97
Reliability of the placement test scores is also an important consideration. Reliability can be estimated using the formula for theta (θ) proposed by Armor (1974). The formula is based on principal components factor analysis and uses p for the number of items in the set of scores, and
λ, for the largest eigenvalue obtained. This formula can be used in the case of a one-factor solu-tion, such as that obtained above (and shown in Table 3):
θ = p / p − 1 (1 − 1 /λ)
If the vocabulary test scores are analyzed separately from the TOEIC scores using principal components analysis, the largest eigenvalue obtained (orλ) for the vocabulary scores is 3.04, and for the TOEIC scores, 1.61. With five vocabulary test scores and an eigenvalue from the principal components analysis of 3.04, the resulting theta is .84. As for the TOEIC scores, with two scores and an eigenvalue of 1.61, the resulting theta is .76. These values confirm the hypothesis, being more than acceptable, given that Pedhazur (1997) reported a range of .50 to .80 range as often ob-tained in non-experimental research.
Placement test vocabulary and TOEIC scores were also correlated, and the results are pre-sented in Table 4. The uncorrected correlations were all statistically significant at the p < .01 level. These correlations are additional evidence that the placement vocabulary and TOEIC test scores are tapping into the same construct. It is also noteworthy that the TOEIC Reading test al-ways correlates more highly than the Listening test with the vocabulary test scores.
Table 4. Intercorrelations of Placement Test Scores
1 2 3 4 5 6 7
1. 2,000 Level
--2. 3,000 Level .70
--3. Academic Word List .71 .70
--4. 5,000 Level .54 .55 .63
--5. 10,000 Level .18 .20 .21 .44
--6. TOEIC Listening .41 .36 .39 .32 .19
--7. TOEIC Reading .48 .47 .52 .47 .29 .61
--Note. All coefficients are significant at p < .01.
In final answer to the first research question, the placement vocabulary scores were used to predict the placement TOEIC listening and reading scores. Table 5 presents the correlation and partial correlation of each predictor with the placement TOEIC Listening scores. The 2,000 Level, Academic Word List, and 10,000 Level test scores had moderate statistically significant correla-tions with the placement TOEIC listening test scores.
Table 5. The Bivariate and Partial Correlations for Placement Vocabulary Test Scores and Placement
TOEIC Listening Test Scores
Predictor Correlation with PlacementTOEIC Listening Placement TOEIC ListeningPartial correlation with
2,000 Level .41*** .16
3,000 Level .36 .05
Academic Word List .39* .09
5,000 Level .32 .03
10,000 Level .19* .08
Note. *p < .05. ***p < .0001.
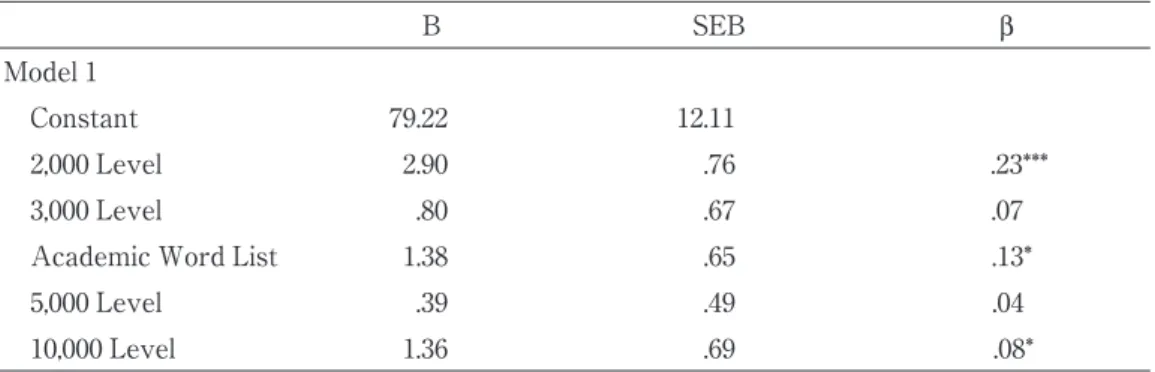
Table 6 presents the results of the multiple regression analysis. Results show that scores from the 2,000 Level, Academic Word List, and 10,000 Level tests accounted for a significant amount of variability in the placement TOEIC listening test scores, R2= .20, F(5, 553) = 27.40, p < .0001.
Table 6. Multiple Regression Results for Predicting Placement TOEIC Listening Scores from Five
Placement Vocabulary Test Scores
B SEB β
Model 1
Constant 79.22 12.11
2,000 Level 2.90 .76 .23***
3,000 Level .80 .67 .07
Academic Word List 1.38 .65 .13*
5,000 Level .39 .49 .04
10,000 Level 1.36 .69 .08*
Note. R2= .20 (p < .0001).
*p < .05. *** p < .0001.
Table 7 presents the correlation and partial correlation of each predictor with the placement TOEIC reading scores.
Table 7. The Bivariate and Partial Correlations for Placement Vocabulary Test Scores and Placement
TOEIC Reading Scores
Predictor Correlation with Placement TOEIC Reading
Partial correlation with Placement TOEIC Reading
2,000 Level .48* .11
3,000 Level .47* .09
Academic Word List .52*** .18
5,000 Level .47* .10
10,000 Level .29*** .15
Note. *p < .05. ***p < .0001.
All placement vocabulary test scores correlated with placement TOEIC reading scores at a statistically significant level. As was true with the TOEIC placement listening scores, the partial correlations showed that, once other predictors were controlled for, the correlations between the vocabulary scores and the TOEIC reading test scores decreased. Nevertheless, all placement vo-cabulary scores had moderate to large statistically significant correlations with placement TOEIC reading test scores.
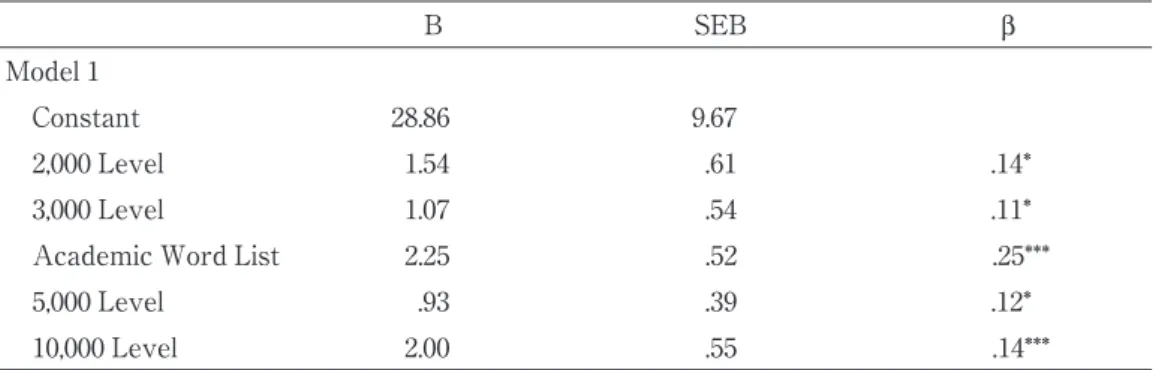
Table 8 presents the results of the multiple regression analysis. Results show that scores from all vocabulary tests accounted for a significant amount of variability in the placement TOEIC reading test scores, R2= .34, F(5, 553) = 57.17, p < .0001.
In general, the vocabulary and TOEIC placement tests worked together in a unidimensional ―42―
fashion and were acceptably reliable. All scores were significantly correlated, and the vocabulary scores also were predictors of the TOEIC tests, though in somewhat different ways. These tests appear to be related enough to each other to be tapping into the same construct of English profi-ciency.
Table 8. Multiple Regression Results for Predicting Placement TOEIC Reading Scores from Placement
Vocabulary Test Scores
B SEB β
Model 1
Constant 28.86 9.67
2,000 Level 1.54 .61 .14*
3,000 Level 1.07 .54 .11*
Academic Word List 2.25 .52 .25***
5,000 Level .93 .39 .12*
10,000 Level 2.00 .55 .14***
Note. R2= .34 ( p < .0001).
*p < .05. ***p < .0001.
Research Question 2: Do placement test scores predict end-of-semester 1 English course grades?
The placement test vocabulary and TOEIC scores were examined to determine how each could add to the prediction of first-semester English class grade. In Table 9, the correlations and partial correlations of the test scores with first-semester English class grade are listed. The place-ment TOEIC listening test and the Academic Word List test scores had small but statistically significant correlations with end-of-semester 1 English course grades. However, the Academic Word List test scores had a negative relationship with the English course grades.
Table 9. The Bivariate and Partial Correlations for Placement TOEIC Listening and Reading Scores
and Vocabulary Test Scores with End−of−Semester 1 English Course Grade
Predictor End-of-Semester 1Correlation with English Grade
Partial correlation with End-of-Semester 1
English Grade
Placement TOEIC Listening .10* .09
Placement TOEIC Reading .05 .02
2,000 Level .03 .06
3,000 Level .00 -.003
Academic Word List -.05** -.11
5,000 Level .01 .03
10,000 Level -.003 -.02
Note. *p < .05. **p < .01.
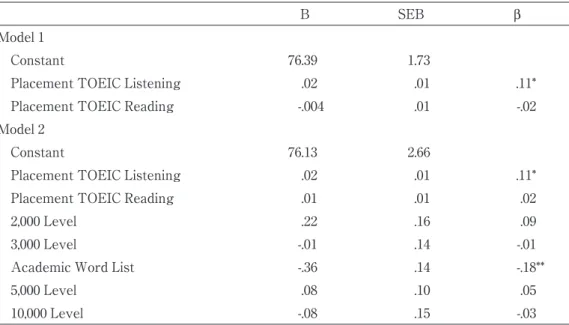
Table 10 shows the results of the hierarchical multiple regression analysis. Initially, the placement TOEIC scores did not account for a significant amount of variability in first-semester grade, R2= .01, F (2, 556) = 2.82, p = .06. A second analysis was conducted to determine whether the placement vocabulary scores predicted end-of-semester 1 English course grade, over and above the placement TOEIC scores. The vocabulary scores did not account for a significant amount of variability in the English course grades, R2change = .01, F (5, 551) = 1.57, p = .17. Of the vocabulary test scores, the Academic Word List score accounted for the most variability in the first-semester English grade, though in a negative direction. That is, students who scored high on this test tended to have lower class grades, an unexpected finding. Of the TOEIC scores, only the TOEIC Listening test score was a statistically significant predictor of the first-semester English grade. Students who scored higher on the Listening test also tended to score higher in their English classes.
Table 10. Multiple Regression Results for Predicting Final First−Semester English Grade from Placement
TOEIC Scores and Five Vocabulary Test Scores
B SEB β
Model 1
Constant 76.39 1.73
Placement TOEIC Listening .02 .01 .11*
Placement TOEIC Reading -.004 .01 -.02
Model 2
Constant 76.13 2.66
Placement TOEIC Listening .02 .01 .11*
Placement TOEIC Reading .01 .01 .02
2,000 Level .22 .16 .09
3,000 Level -.01 .14 -.01
Academic Word List -.36 .14 -.18**
5,000 Level .08 .10 .05
10,000 Level -.08 .15 -.03
Note. R2= .01 for Model 1; R2change = .01 for Model 2 ( p = .17 )
*p < .05. ** p = .01.
Research Question 3: Do placement test scores predict TOEIC listening and reading scores at the end of semester 1?
The placement test vocabulary and TOEIC scores were examined to determine how each could add to the prediction of end-of-semester 1 TOEIC listening scores. In Table 11, the correla-tions and partial correlacorrela-tions of the test scores with end-of-semester 1 TOEIC listening scores are listed. The placement TOEIC listening and reading test scores had statistically significant corre-lations with end-of-semester 1 TOEIC listening scores.
Table 11. The Bivariate and Partial Correlations for Placement TOEIC Listening and Reading Scores
and Vocabulary Test Scores with End−of−Semester 1 TOEIC Listening Scores
Predictor
Correlation with End-of-Semester 1 TOEIC
Listening Scores
Partial correlation with End-of-Semester 1 TOEIC Listening
Scores
Placement TOEIC Listening .70*** .54
Placement TOEIC Reading .56*** .17
2,000 Level .39 .04
3,000 Level .36 .01
Academic Word List .39 .01
5,000 Level .35 .07
10,000 Level .16 -.05
Note. ***p < .0001.
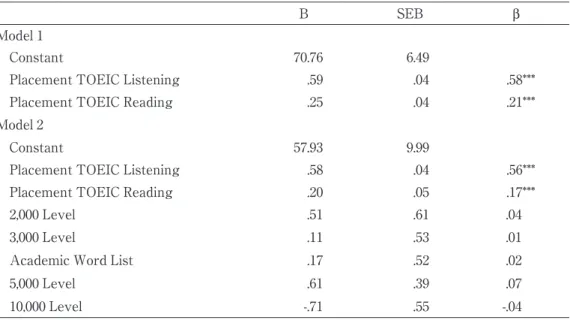
Table 12 shows the results of the hierarchical multiple regression analysis. Initially, the placement TOEIC scores accounted for a significant amount of variability in end-of-semester 1 TOEIC listening scores, R2= .52, F (2, 551) = 300.11, p < .0001. A second analysis was conducted to determine whether the placement vocabulary scores predicted end-of-semester 1 TOEIC listen-ing scores, over and above the placement TOEIC scores. The vocabulary scores did not account for a significant amount of variability in end-of-semester 1 TOEIC listening scores, R2change = .01, F (5, 546) = 1.87, p = .10. As expected, the early TOEIC test scores were strong predictors of later TOEIC listening test scores.
Table 12. Multiple Regression Results for Predicting End−of−Semester 1 TOEIC Listening Score from
Placement TOEIC Scores and Five Vocabulary Test Scores
B SEB β
Model 1
Constant 70.76 6.49
Placement TOEIC Listening .59 .04 .58***
Placement TOEIC Reading .25 .04 .21***
Model 2
Constant 57.93 9.99
Placement TOEIC Listening .58 .04 .56***
Placement TOEIC Reading .20 .05 .17***
2,000 Level .51 .61 .04
3,000 Level .11 .53 .01
Academic Word List .17 .52 .02
5,000 Level .61 .39 .07
10,000 Level -.71 .55 -.04
Note. R2= .52 for Model 1; R2change = .01 for Model 2 ( p = .10)
***p < .0001.
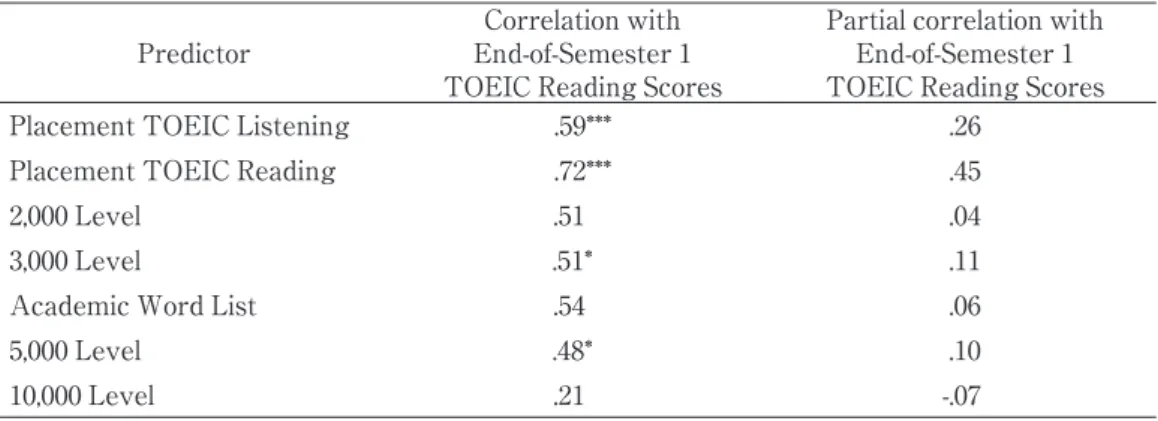
The placement vocabulary test and TOEIC scores were also examined to determine how each could add to the prediction of end-of-semester 1 TOEIC reading scores. In Table 13, the cor-relations and partial corcor-relations of the test scores with end-of-semester 1 TOEIC reading scores are listed. The placement TOEIC listening and reading test scores had statistically significant correlations with end-of-semester 1 TOEIC listening scores, but the 3,000 Level and 5,000 Level vocabulary test scores also had statistically significant correlations.
Table 13. The Bivariate and Partial Correlations for Placement TOEIC Listening and Reading Scores
and Vocabulary Test Scores with End−of−Semester 1 TOEIC Reading Scores
Predictor End-of-Semester 1Correlation with TOEIC Reading Scores
Partial correlation with End-of-Semester 1 TOEIC Reading Scores
Placement TOEIC Listening .59*** .26
Placement TOEIC Reading .72*** .45
2,000 Level .51 .04
3,000 Level .51* .11
Academic Word List .54 .06
5,000 Level .48* .10
10,000 Level .21 -.07
Note. *p < .05. ***p < .0001.
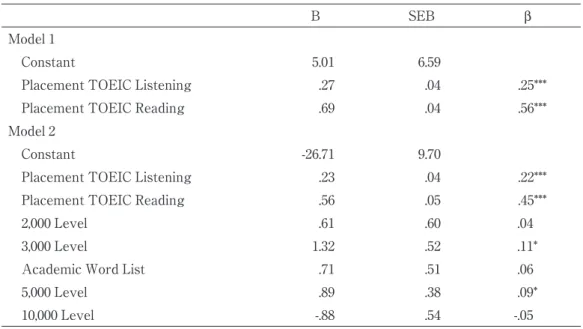
Table 14 shows the results of the hierarchical multiple regression analysis. Initially, the placement TOEIC scores accounted for a significant amount of variability in end-of-semester 1 TOEIC reading scores, R2= .55, F (2, 551) = 338.59, p < .0001. A second analysis was conducted to determine whether the placement vocabulary scores predicted end-of-semester 1 TOEIC read-ing scores, over and above the placement TOEIC scores. In this analysis, the vocabulary scores did account for a significant amount of variability in end-of-semester 1 TOEIC reading scores, R2 change = .05, F (5, 546) = 12.03, p< .0001. As expected, the early TOEIC test scores were strong predictors of later TOEIC reading test scores. However, unlike the results concerning the end-of-semester TOEIC listening test, the placement vocabulary scores were also significant predictors of later TOEIC reading test scores. In particular, the 3,000 Level and 5,000 Level vocabulary scores were significant predictors of the end-of-semester 1 TOEIC reading scores.
Table 14. Multiple Regression Results for Predicting End−of−Semester 1 TOEIC Reading Scores from
Placement TOEIC Scores and Five Vocabulary Test Scores
B SEB β
Model 1
Constant 5.01 6.59
Placement TOEIC Listening .27 .04 .25***
Placement TOEIC Reading .69 .04 .56***
Model 2
Constant -26.71 9.70
Placement TOEIC Listening .23 .04 .22***
Placement TOEIC Reading .56 .05 .45***
2,000 Level .61 .60 .04
3,000 Level 1.32 .52 .11*
Academic Word List .71 .51 .06
5,000 Level .89 .38 .09*
10,000 Level -.88 .54 -.05
Note. R2= .55 for Model 1; R2change = .05 for Model 2 ( p < .0001)
*p < .05. ***p < .0001.
DISCUSSION
The purpose of this study was to examine construct validation evidence for a university English class placement test that consisted of scores from the TOEIC listening and reading tests and from the Vocabulary Levels Test. Results indicated that test scores were unidimensional and sufficiently reliable. They also were significantly correlated with one another. Placement vocabu-lary scores predicted the placement TOEIC test scores, though somewhat differently for the two tests. In short, placement test scores appeared to tap into a single dimension, or construct. As for prediction of end-of-semester 1 English course grade, only the TOEIC listening test scores pre-dicted the English course grade in a positive direction. An unexpected finding was that the Aca-demic Word List scores predicted the English grade in a negative direction. As for prediction of end-of-semester 1 TOEIC scores, placement test scores were statistically significant predictors, though to varying degrees. The end-of-semester 1 TOEIC listening test scores were predicted by only the placement TOEIC scores, but the TOEIC reading test scores were predicted by both the placement TOEIC test scores and a number of the vocabulary scores. Although there was evidence from other parts of the study that the vocabulary scores and the TOEIC listening test scores are related, the reading test scores were found to be more consistently related to the vo-cabulary scores.
In conclusion, this study found positive construct validation evidence for these placement ―47―
tests in that they tapped into a single dimension of English proficiency, one that was linked to vo-cabulary and receptive listening and reading skills. But Messick (1989) warned us to consider the threat of construct underrepresentation, when what is being tested is too narrow, as well as con-struct-irrelevant variance, caused by items being easier or more difficult for reasons uncon-nected to the construct. Even though the results of this study are generally positive, whether the placement tests are assessing skills most needed in the program of study sufficiently and pre-cisely is another question, one that requires further consideration and investigation.
REFERENCES
Armor, D. J. (1974). Theta reliability and factor scaling. Sociological Methodology, 5, 17-50.
Bachman, L. F. (2000). Modern language testing at the turn of the century: Assuring that what we count counts. Language Testing, 17(1), 1-42.
Bachman, L. F. (2004). Statistical analyses for language assessment. Cambridge: Cambridge Univer-sity Press.
Brown, J. D. (1996). English language entrance examinations in Japan: Problems and solutions.
Proceedings of the JALT 1995 conference, Nagoya, Japan, 272-283.
Brown, J. D., & Hudson, T. (1998). The alternatives in language assessment. TESOL Quarterly, 32 (4),653-675.
Brown, J. D., & Yamashita, S. O. (1995). English language entrance examinations at Japanese uni-versities: 1993 and 1994. In J. D. Brown & S. O. Yamashita (Eds.), Language testing in Japan (pp. 86-106). Tokyo: Japan Association for Language Teaching.
Chapman, M. (2003). The role of the TOEIC in a major Japanese company. Proceedings of the 2nd
Annual JALT Pan−SIG Conference, Kyoto, Japan, 73-79.
Field, A. (2005). Discovering statistics using SPSS (2nded.). London: Sage.
Kikuchi, K. (2006). Revisiting English entrance examinations at Japanese universities after a dec-ade. JALT Journal, 28(1), 77-96.
McNamara, T. (2007). Language assessment in foreign language education: The struggle over constructs. The Modern Language Journal, 91(2), 280-282.
Messick, S. (1989). Meaning and values in test validation: The ethics of assessment. Educational
Re-searcher, 18(2), 5-11.
Murphey, T. (2001). Nonmeritorious features of the entrance exam system in Japan. The Language
Teacher, 25(10), 1-4.
Nation, I. S. P. (1990). Teaching and learning vocabulary. Boston: Heinle & Heinle.
Spolsky, B. (2000). Language testing in the Modern Language Journal. The Modern Language Journal ,
84(4), 536-552.
Wistner, B., & Sakai, H. (2008). Rasch analyses of English language placement tests. In K. Brad-ford Watts, T. Muller, & M. Swnson (Eds.), JALT2007 conference proceedings (pp.1045-1055). Tokyo: Japan Association for Language Learning.
大学英語クラス分けテストスコアの検証証拠における考察
Kristy King Takagi 本研究では,ある日本の大学の語学プログラムで使用された英語クラス分けテストスコアにお ける構成概念妥当性を考察する。クラス分けテストスコアは,TOEIC のリスニングとリーディ ングテストスコア,並びに5つの単語レベルテストから成る。3つの研究課題が提起され,調査 が行われた。第一の関心事はそれぞれのテストスコアの関連性である。調査の結果,スコアは一 元的,十分に信頼出来,且つ相関性があった。第二の研究課題は,クラス分けテストスコアで生 徒の学期末の英語成績を予測出来るかと言う点である。結果,TOEIC リスニングテストのみが 確実に出来る事が解った。最後の研究課題は,クラス分けテストスコアで,生徒の学期末の TOEIC リスニング及びリーディングテストスコアを予測出来るかと言う点である。結果,クラス分けテ ストスコアで予測出来る事が解った。これらの結果は,構成概念妥当性を肯定すると見なし得る ものではあったが,構成概念に関する疑問点を分析し,クラス分けテストをプログラムに適合さ せると言う課題に関して,引き続き研究が必要である。 ―49―
![Table 1. Descriptive Statistics for Placement TOEIC Test Scores Placement TOEIC Listening Scores Placement TOEICReading Scores M 198.36 146.72 SE 2.29 2.02 95% CI [193.86, 202.86] [142.74, 150.70] SD 54.32 47.94 Skewness .70 1.25 SES .10 .10 Kurtosis 1.40](https://thumb-ap.123doks.com/thumbv2/123deta/10068612.1470320/6.773.105.577.256.487/descriptive-statistics-placement-placement-listening-placement-toeicreading-skewness.webp)