Southeast Asz"an Studz"es, Vol. 11, No.2, September 1973
The Plant Height
or
Rice in Delta
- - A Case Study in the Chao Phraya Delta of
Thailand--by
Y oshikazu TAKAYA
*
Abstract
The rice plants in the deltaic area of the Chao Phraya are classified into eight types, from I to VIII, based on the plant height.
Type I occurs in a geological depression in the middle of the delta, called Trough, and is distinc-tively characterized by an extremely wide height range, varying from 150 em to 400 em (Figs. 2& 3). Type II coyers the Old Delta and has a reasonably wide height range and a rapid lateral change of plant height (Figs. 2 & 4). Type III grows all along the marginal zones of the deltaic area, and has a pattern of plant height distribution similar to Type II, though the average height is slightly shorter than Type II. Type IV to VIII are found in the Young Delta and are characterized by a narrow range and a smooth lateral change of plant height distribution (Figs. 2 & 5).
The subdivision of the Young Delta divided according to Types IV toVln demonstrates that the further inland one goes the taller the plants are (Fig. 2). This phenomenon is explained by the help of a simplified delta model in which a scarp, characteristic of all deltas, separates the Old and Young Deltas. During a large and prolonged flood, the water inundates the deltaic area, with the flood depth increasing as one goes inland (Fig. 7). The greatest depth occurs at the foot of the scarp. The existing distribution of the plant height in the Young Delta seems to be a reflection of the topo-hydrographic conditions mentioned above.
Introduction
The great floods caused by the monsoon rain is so overwhelming in the deltaic area that it cannot be controled by bunds and even polders. Rice plants must adjust their heights to the depth of the flood in order to survive. This paper aims at more clearly understanding of the deltaic environment during the flood season by studying the plant height of rice.
I
Physiographic Setting
The deltaic region of the Chao Phraya can be divided into four physiographic regions: Old Delta, Trough, Young Delta, and Fan Terrace Complex as shown in Fig. 1.
The Old Delta1.2)consists of the upper half of the delta and has a slightly undulating
and gently sloped ground surface. The local relief which often attains 5 m is caused either by the normal dissection of existing streams or by the superposition of levee deposits on
~Trough
o
Young deltao
Hills and mountainsD Old delta
o
Fan - terrace camp lexFig. 1 The physiographic map of the deltaic area of the Chao Phraya
the original surface. Most areas are cultivated to rice, out of which the relatively higher portions form fragmented rice fields with scattered trees and bush clumps while the relatively depressional portions are treeless rice fields.
The Troughl )is supposed to be a vestige of a huge valley of the last glacial age. This elongated depression penetrates the Old Delta having nearly a parallel orientation to the existing Chao Phraya River. Because of this relatively low elevation, deep and prolonged inundation occurs every year. Floating rice is commonly found in this zone.
The Young Delta is a very flat and lowlying land. The dominant portion has a ground height between 1 to 2 m above sea level. Monotoneous scenary of endless rice fields is the typical feature of the Young Delta during rice growing season.
The Fan Terrace Complex is a gently sloped transitional zone sandwiched between the delta proper and the surrounding hilly regions. Minor streams which sporadically gush out from the hills are main sources of water for the region. Thus, hydrographically the region actually has no relation with the delta proper in which the water condition is directly governed by such trunk rivers as the Chao Phraya and the Noi.
II Method of Measurement of Plant Height
Field trips to obtain the measurement of plant height were conducted in the months of March and April of 1973. March was, however, already too late to observe standing crops, because the reaping of most of main season rice in the area had ended by the beginning
Y. TAKAYA: The Plant Height of Rice in Delta
of Februay. The plant height was, consequently, estimated by measuring the heights of remaining culms on the fields and adding 80 cm which is the persistent length of clipped ear in the area.
As for the sampling density, it was tried to take one measurement for every 4 km2 and all the motorable roads and some of the canals were traced. Two thousand observation sites were obtained by this way, yet it turned out that the distribution was not as homogeneous as expected because of the poor accessibility to some portions of the area.
The culms of off season rice were seen in places. But these were carefully excluded in order to avoid creating a misleading picture by mixing up main and off season rices which are grown under quite different water conditions.
III Results of the Measurements
1. The Distribution of Plant Height
Measured plant heights were plotted on a map and were grouped into eight types as shown in Fig. 2. Type I occupies the heart of the deltaic area, forming an elongated con-figuration. Type II is concentrated in the upper portion of the delta. Type III grows all along the marginal zones of the delta. While Types IV to VIII occur in the lower portion of the area and show a somewhat distorted zonal arrangement parallel to the coast, having the order of Types V, VI, VII, and VIII from inland towards the coast.
The criteria of the groupings are as illustrated in a chart below Fig. 2. Type I has a very wide height range, varying from 150 to more than 400 em. Type II and Type III also have reasonaly wide height ranges with predominating heights of 160-200 cm and 140-160 cm respectively. All types from IV through VIII, by contrast, are characterized by narrow height ranges, and their predominating plant heights are 300 cm±, 260 cm±, 220 cm±, 180 cm± and 150 cm± respectively.
11. The Pattern of Plant Height Distribution
The height range shown in the chart does not give the whole picture of the height varia-tion as such. Even units having the same height distribution can have entirely different patterns of height variation by being provided with a different smoothness. For instance, when one has a smooth distribution, the other may have a rough and fractional distribution. Three representative patterns of height variation which characterize the types are shown below.
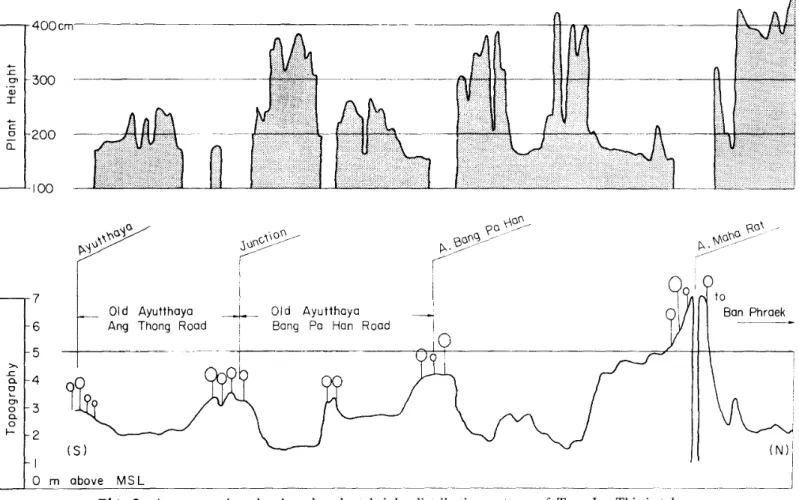
Cross Sectz'on of Type I (Fig. 3)
This represents an extreme example of a pattern having wide height range and a rough distribution. Field evidence shows that the wide range and roughness are caused by uneven topography. The tallest plants coincide with the deepest parts of backswamps, whereas the shortest ones correspond to elevated portions near natural levees. Sometimes natural levees are too high to allow rice growing, then they give fractions such as those shown as non-rice land on the cross section.
(
\
12°
b=!==,====,==!:::=~50 km
Range of Plant Height (em) Type .II ][ N V VI 'lIT VI[
Non Rice Land
160 200 240 280 320 400
270
Fig. 2 A map and a chart showing the distrilmtion of plant height of rice in
I
o
m above MSL t; ~ ~ :;0 ;:;. C1> 5' o ...,:<
I-j ;.. ~ ;.. -< ;.. I-j ::r C1> '"t:l ;-~:r:
C1> i1Q' ~ 'l'!'c'00;:c\ .-!,>~.-.-/ oc '00 {\ BO{\~ I""~- ~.-~ f:>.'~~~ ~ i I --J Old AyutthayaBang Po Han Road
F~
i I --j---Ayutthaya Thong Road (S)~,\0"'(\C'\C
.r:::.::' r
300 (l) I+-£
r
200 100 7 6 5 >, ~ 1-4 o g' I-3 a. o f- L2Fig. 3 A cross-section showing the plant height distribution pattern of Type1. This is taken
along the old Ayutthaya-Amphoe Maha Rat road.
N
-l
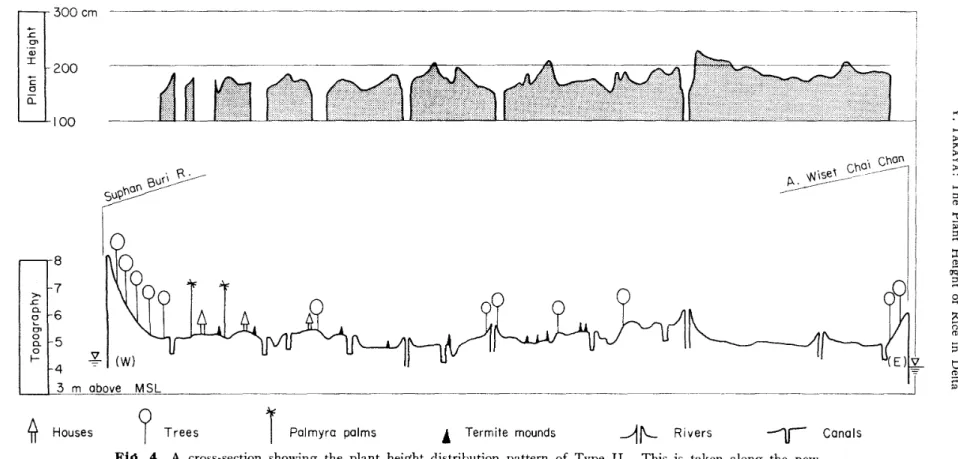
Cross Section of Type I I (Fig. 4)
This has apparently a narrower height range and a smoother pattern than Type I but still shows an abrupt height change and fractions. These roughness in the pattern is again the product of topographic irregularity.
Type III has a pattern of height variation similar to Type II, though its average height is shorter than that of Type II.
Cross Section of Type IV to VIII (Fig. 5)
Instead of the similar height ranges, Fig. 4 and Fig. 5 appear quite distinguishable, because of their different patterns of height variation. The cross section through Types VI and VII has a very smooth distribution, while that of Type III has a fractional and rugged pattern. Types IV and V have also as smooth a pattern of distribution as those of Types VI and VII. Thus smoothness is regarded as a common characteristic of Types IV through VIII.
In Fig. 2, areas marked with dots are the places characterized by a rough pattern of distribution, while those with stripes are of a smooth pattern of distribution.
Fig. 5 does not show any sharp break within and between Type VI and Type VII. The only pattern seen in the figure is a kind of warping. In other words, there is no clear demarcation between the two types. This is true not only in the case of Types VI and VII, but in all the cases from Types IV through VIII. Considering this situation, the following scale was set up and the division was made rather artificially.
Type IV over 280 cm V 240-280 cm VI 200-240 cm VII 160-200 cm VIII less than 160 cm
IV
A Correlation with Physiographic Divisions
A comparison of Fig. 1 and FIg. 2 indicates that there is a very close correspondence between the physiographic divisions and the plant height divisions. The correlation can be made as follows:
272
Physiographic Divisions Trough
Old Delta
Fan Terrace Complex Young Delta
Plant Height Divisions Type I
II III IV to VIII
300 em 4 3 m 7 >. .c ~ ~6 en &~5 o t-"1:l ~ g
...,
0-<1> o ....,:<
...,
;" :>:: ;" ><: ;" ~ (;. (t S' tJ !!. p; ::r: <1> tiq.g-r.. \f'J\se' ello\ ell on
~---
---l
~
'B "-0(\ e,u(\ . Su?"I
~ I (W) 8 200 100c
o ii .c 0> Q) Iof Type II. This is taken along the new
~
Houses9
TreesT
Palmyra palms j Termite moundsFig. 4 A cross-section showing the plant height distribution pattern
highway linking Suphan Buri and Ang Thong.
-1r'-
Rivers-r
CanalsN
- l
~
:c
Ol Q) :r: c o 0... 300em 200 100 TypeV1f ~~---d ' " '0\i\~/ P>::;\~~'..:~~ Type VI Type Vlf \ v.-\f'100~ Co(\o 1mf 3M "'! \' "'! $1 ~~ 4~ ~3
0-0 ~ f-2 0 0-0 l-Orn'ii
Houses-1f'-
CreeksU
Canalsf-' f - ' ~~
N
lJin
Fig. 5 A cross-section showing plant height distribution pattern in TypesVI and VII. This is taken along
Y. TAKAYA: The Plant Height ofRice in Delta
The correlation is almost perfect, except for the case of Type I where a slight disagree-ment is recognized. Field evidences show that Type I can be obtained only in those places where the Trough is superimposed by a web of natural levees and backswamps of such great rivers as the Chao Phraya, Noi and Lopburi. These rivers eventually cut the Trough ob-liqely, though the angles are very sharp, and this results in the disagreement in the ex-tentions of Type I and the Trough. Type I, in this respect, may have to be called a type associated with backswamps within the Trough.
V
A Simplified Model of Plant Height in Delta
The plant height distribution shown III Fig. 2 may be schematically summarized as
follows:
a) Cross sectionally, the middle portions of a delta which have a relatively lower elevation produce taller plants than the marginal portions which have a relatively high elevation.
b) Longitudinally, the plants in the Young Delta are arranged in such a zonal way that the further inland one goes the taller the plants are.
The validity of the above generalization becomes apparent when the water level of the flood season is drawn over a topographical cross section. The first statement is self-explanatory. The second one, which suggests a more interesting feature of the delta ecology, can also be understood by Fig. 7, in which a scarp separating the Old and Young Deltas
hill _----_
fan
-terrace---complex old delta
young delta
Fig. 6 An E-W cross-section of the deltaic area with a flood
level in rainy season
old del to
--
-'~'--young del to
Fig. 7
sea
A N -S profile showing a theoretical flood level on the Old and Young deltas. Notice that the flood depth is deepest just in front of the scarp separating the Old delta and Young delta
is shown. During a deep and prolonged flood, the water inundates the whole deltaic area, with the flood depth increasing as one goes inland. In Fig. 7, the greatest depth occurs at the foot of the scarp. The existing distribution of plant height in the Young Delta seems to be a reflection of this topo-hydrographic condition.
Acknowled~ements
This field survey was conducted with the permission of the National Research Council of Thailand. The writer is grateful to Prof. Swai Sundharovat, Head of the Geology Depart-ment of Chulalongkorn University for his kind encourageDepart-ment to the author during the trip. Financial support was granted by the Center for Southeast Asian Studies of Kyoto University.
References
1) Takaya, Y.1969. "Topographical Analysis of the Southern Basin of the Central Plain, Thailand,"Tonan Ajia Kenkyu (Southeast Asian Studies), vol. 7, no. 3, pp. 293-300, Kyoto Dniv.
2) Takaya, Y.1971. "Physiography of Rice Land in the Chao Phraya Basin of Thailand,"Tonan A/ia Kenkyu
(Southeast Asian Studies), vol. 9, no. 3, pp. 375-397, Kyoto Dniv.