C211
Monitoring of Flow and Sediment Using Image-Based Techniques for Water Resources
Management
〇Mahmood M. AL MAMARI, Sameh KANTOUSH, Mohamed SABER, Tetsuya SUMI
1. Introduction
The runoff characteristics and sedimentation processes in ephemeral and perennial rivers play a significant role in terms of water resources management. Monitoring of river elements are quite challenging due to large scale and difficulties to access during extreme condition. However, the rapid development of technology and techniques can provide alternative solutions for observation and data collection.
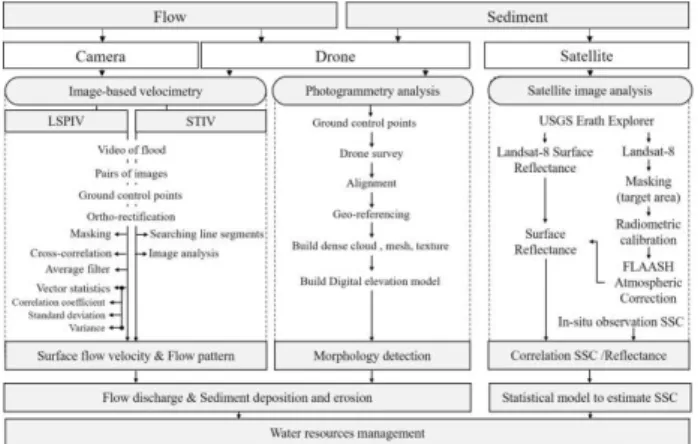
In this research, we estimated surface flow velocity map and pattern using Large-Scale Image Particle Velocimetry (LSPIV) method, and integrated with photogrammetry technique to quantify erosion and deposition processes in both arid regions (Wadi El-Khoud, Oman) and humid regions (Kizu River, Japan), for both applications we conducted pre and post survey. Satellite images were used for mapping surface suspended sediment concentration distribution over Kazeya dam reservoir.
2. Objectives and methods
In wadi system, we installed fixed camera to acquired flash flood (FF) videos to investigate the efficiency of using LSPIV technique for three stages (rising, peak and recession), this will assist to provide alternative solution for monitoring FF in ungauged basins. In addition, photogrammetry processes applied to generate cross sectional profile from digital elevation module DEM (calibrated and validated using ground control points (GCP). Then it combined with LSPIV to compute discharge (Al-Mamari, 2019).
Seigyu is one of traditional river training structures in Japan, used to restoring and maintaining riverbanks. Additionally, the influence of the installed Seigyu structures on flow pattern, riverbed de-formation was investigated (S.A. Kantoush, 2020).
Figure 2.(a)(b) show camera and water level gauge location with GCP (c) the rapid flow of FF in wadi. Figure 1. Flow chart of integrated approach using remote
The LSPIV method used to extract surface flow velocity by detecting the movements of flow over each pixel with space and time at sequent frames. Where Drone survey conducted to acquired images and video for analysis and used to generate DEM to detect channel bed change around Seigyu.
In third method, several dams reservoir are severing from high sedimentation, which increased settlement of sediments and reduce the capacity storage. We utilized satellite remote sensing to monitor and mapping SSC distribution using 2014–2018 in situ measurements from the Kazeya reservoir. The observed data was correlated with surface reflectance data extracted from Landsat-8 OLI and compared between two different level datasets (Level-1 and Level-2) to generate algorithm model. This technique can optimize the operation of water supply intake and manage the sediment discharge.
3. Results and discussion
The LSPIV results in wadi system showed a reliable result for surface flow velocity by its comparison with the computed flow rate from image analysis and slope area measurements (Figure 3). The drone survey used to generate DEM by using photogrammetry process to extract cross sectional profile after calibration and validation by the ground control points GCP.
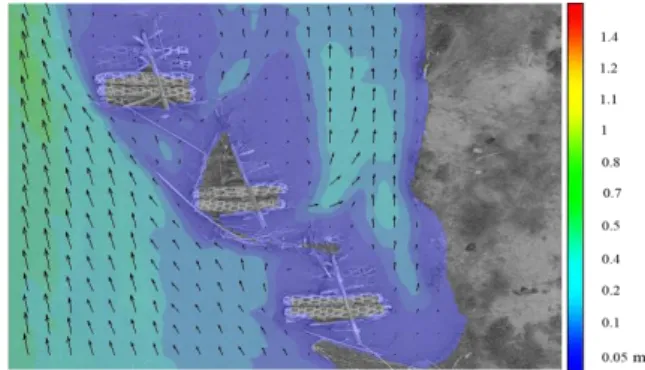
Figure 4. Flow pattern and velocity map nearby Seigyu.
The assessment impacts of river training structure in flow pattern and velocity exhibited that the flow characteristics affected directly by partially and fully submerged condition of Seigyu. The surface flow velocity of LSPIV were validated, during partially and submerged condition floods with observation data around Seigyu (Figure 4). We generated DEM with 0.1-meter resolution for pre- and post-flood to detect geomorphology change. Seigyu has affected the bed form, by inducing erosion and deposition locally.
In remote sensing application, the results show that LS8 L1 images atmospherically corrected using the FLAASH method were able to provide a reasonable surface reflectance value for red over green band ration and red band expression (R2 = 0.89 and R2=
0.86, respectively).
Figure 3. The computed discharge from surface flow velocities LSPIV comparison with computed discharge from water levels.
Figure 5. Mapping of surface suspended sediments in dam reservoir
References
1- Al-Mamari, M. M., 2019. Real-Time Measurement of Flash-Flood in a Wadi Area by LSPIV and STIV.. Hydrology, p 2- S.A. Kantoush,, 2020. River Flow 2020, Flow patterns and bed changes due to traditional river training structures “Seigyu”.