D14
豪雨による花崗岩風化地域における土砂流動化現象-2014 年 8 月の広島土砂災害について
Fluidized Landsliding Phenomenon on weathered granite Slope during Heavy Rainfall:
Case study of the Hiroshima geohazard in August 2014
○王功輝・江耀○Gonghui WANG, Yao JIANG
On August 20, 2014, a heavy rainstorm attached Hiroshima City and triggered clusters of debris flows on Asa-minami and Asa-kita areas, resulting 74 dead, 44 injured, and 133 buildings being destroyed. Field survey revealed that in most cases the debris flow had shallow landslide(s) on its source area of most upper slope, and the main materials came from the colluvial debris deposits along the traveling paths (streams). Piping holes were found in the source areas of many shallow landslides. Undrained and partially drained ring shear tests on those samples taken from the sources areas showed that all these samples can suffer from liquefaction failure phenomena. A series of rainfall-triggered landslides in a flume revealed that piping flow on the source area can remarkably elevated the mobility of displaced landslide materials.
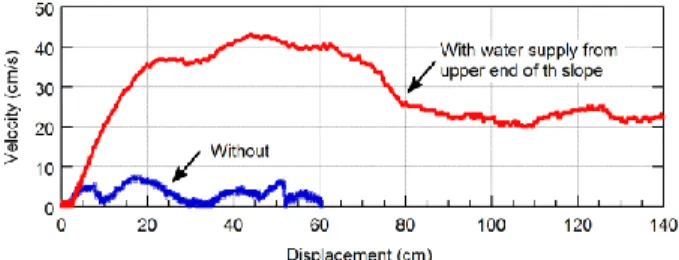
1.はじめに 2014 年 8 月 20 日,広島市内では 3 時間 217.5mm の猛烈な雨が観測された.この雨により,広島市 安佐南区および安佐北区の斜面において数多くの 土石流が発生した.殆どの土石流が斜面直下の住 宅地を直撃し,死者 74 名,家屋の被害 133 戸以上 という甚大な被害をもたらした.この災害の発 生・運動機構を解明するために,著者らは,発災 後に現地調査および室内実験を行った.本稿では, 得られた室内実験結果について報告する. 2.実験方法と結果 現地調査を実施した結果,①殆どの土石流は, 源頭部斜面に於ける浅層崩壊+渓流堆積物の浸食 により形成されたものだ;②崩壊の源頭部には, パイピングホールが多数あることと,分かった. リングせん断試験機を用いて,崩壊の源頭部およ び斜面の末端(渓流の出口付近)から採取した試 料に対して飽和非排水・自然排水せん断試験を行 った.飽和非排水せん断試験では,両試料におい て,崩壊に伴って高い過剰間隙水圧が発生し,せ ん断抵抗がほぼゼロまで低下した (Fig. 1). 崩壊土層が浅いため,崩土が非排水状態ではな く,自然排水状態にあると考えられる.こういっ た排水過程をも考慮し,せん断箱の排水口を開け たままに,水の粘性係数より 15 倍高い液で飽和し た試料に対する高速せん断試験をも行った.その 結果,高い過剰間隙水圧が蓄積でき,せん断抵抗 が著しく低下したことが分かった(Fig. 2).すなわ ち,浅くても崩壊土層において液状化現象が発生 しうることが分かった. 安佐北区可部東の崩壊地から採取された試料 (WG)を用いて,降雨による斜面崩壊模型実験を実 施した.崩壊源頭部のパイピング現象による斜面 崩壊への影響を調べるために,模型土層の上部に 異なる圧力水頭を与えて実験を実施した.いずれ の実験においても,後退性崩壊が発生したが,圧 力水頭の高い実験において,崩壊土塊はより規模 が大きく高速で流下したことが分かった(Fig. 3).
Fig. 1 Undrained shear test on saturated WG
Fig. 2 Partially drained shear test on SM15-saturated WG
Fig. 3 Sliding distance against velocity of the main
displaced mass in flume tests (sample: WG). 2D Graph 1
Effective stress (kPa)
0 20 40 60 80 100 120 140 S h e a r re s is ta n c e ( k P a ) 0 20 40 60 80 Peak point Steady state point
C.L.