Using HMM-Based Audio Recognition and SVM Regression to Evaluate Toothbrushing Performance
8
0
0
全文
(2) Vol.2015-UBI-47 No.1 Vol.2015-ASD-2 No.1 2015/7/27. IPSJ SIG Technical Report. Fig. 1. Assumed setup for using a smartphone to record audio from tooth brushing.. Fig. 3 Fig. 2. MFCC representation of audio data from four tooth brushing activity classes.. sound data. The research contributions of this paper are that: (1) We propose a method for evaluating tooth brushing performance using a machine learning approach. (2) We propose a method for automatically generating the HMM sets used as the basis for estimating scores, generating separate HMM sets for each score, with each set tailored to improve the accuracy of its corresponding score estimates. (3) We evaluate our method using 94 sessions of tooth brushing audio data taken from 14 research participants.. 2. Related Work 2.1 Environmental sound recognition There are many ubicomp studies on environmental sound recognition. For example, in [3], bathroom activities such as showering, flushing, and urination are recognized using microphone data. Also, several studies recognize daily activities with microphones in smartphones by recognizing environmental sounds such as vacuuming sounds and the sound of running water [15], [18]. 2.2 Sensing toothbrushing In [11], Braun’s SmartGuide was used to study the effects of real-time feedback on the quality of tooth brushing, in which they found a significant improvement in brushing habits when using this system. Other research has been conducted on the analysis of tooth brushing behavior using optical motion capture systems [2], [10] and embedded accelerometer sensors [9], [12], [13]. In particular, a system developed in [2] used an optical recognition system that encouraged children to brush their teeth by providing feedback on their performance by means of a cartoon display. Regions of the mouth that were adequately brushed were depicted as free of plaque in the cartoon, giving the children simple feedback on their performance. The results of their research indicated a significant improvement in brushing performance as a result of the feedback. Similarly, [9] used an embedded accelerometer to evaluate tooth brushing performance, using graphical feedback to motivate better performance. In each of these systems, specialized hardware was required, such as a specialized toothbrush or an accelerometer. In contrast, in this paper we propose a lowcost system built around an off-the-shelf smartphone, which eliminates the need for most users to purchase any new equipment.. c 2015 Information Processing Society of Japan ⃝. Four regions of the mouth used during evaluation of tooth brushing performance.. 3. Tooth brushing sensor data 3.1 Assumed environment In our method, users record the sound of their tooth brushing using their smartphone’s microphone. Figure 1 shows the assumed setup, where the user places his/her smartphone next to the sink when recording the sound of his/her tooth brushing. We extracted features from the raw audio data as vectors of mel-frequency cepstral coefficients (MFCCs). Although MFCCs were originally designed for use in speech recognition, they have also been successfully applied to environmental sound recognition [3]. Figure 2 shows graphical representations of MFCC data derived from tooth brushing audio. As shown in the figure, the audio characteristics differ when brushing the back teeth from when brushing the front teeth. Similarly, the characteristics also differ depending on the technique (or strength) of the brushing stroke. The quality of a participant’s tooth brushing is dependent on their stroke technique and on how evenly they brush all areas of the mouth, e.g., a participant who uses too forceful of a stroke will be at higher risk of damaging their gums and teeth. By using these characteristics of the audio data to recognize which regions of the mouth were brushed along with the brushing technique used, we can facilitate the evaluation of the user’s tooth brushing. 3.2 Tooth brushing activity We use HMMs based on audio characteristics to recognize the following seven activities (referred to as “tooth brushing activities”). The performance of the participant’s tooth brushing was then evaluated based on the output from these HMMs: - Outer surface of front teeth, rough stroke (FO-Rough) - Outer surface of front teeth, fine stroke (FO-Fine) - Outer surface of back teeth, rough stroke (BO-Rough) - Outer surface of back teeth, fine stroke (BO-Fine) - Inner surface of front teeth, fine stroke (FI-Fine) - Inner surface of back teeth, fine stroke (BI-Fine) - No tooth brushing activity (None) In this study, “inner surface” refers to the lingual surface, “outer surface” refers to the facial surface, “front teeth” refers to the incisors and canine teeth, and “back teeth” refers to the molars. The term “rough” indicates that the stroke used when. 2.
(3) IPSJ SIG Technical Report. brushing was too forceful, while “fine” indicates that a smaller, lighter stroke was used. (Dentists recommend that a fine stroke, used in brushing methods such as the horizontal scrub and Fones methods, be used when brushing one’s teeth, as such a stroke is effective in removing plaque, while a rougher stroke increases the risk of damaging the teeth and gums.) The seven tooth brushing activities listed above were chosen because they can be differentiated when performing recognition by means of audio data and are important when evaluating the effectiveness of a person’s tooth brushing. During our investigation, a limitation was found in using audio data to classify tooth brushing activities. While audio data can be used to differentiate between brushing the front vs. the back of the mouth and between brushing the inner surface vs. the outer surface of the teeth, it cannot be used for more symmetric differentiations such as the left vs. right side or upper vs. lower teeth. Because of this limitation, some issues can arise when scoring a user’s tooth brushing. For example, in the case where a user brushes their upper front teeth for a long time, but not their lower front teeth, the scoring of that tooth brushing should be reduced. However, if no distinction can be made between upper front teeth and lower front teeth, then the resulting score can be incorrect. The section entitled Computing independent variables contains a detailed discussion on ways to address this issue. 3.3 Tooth brushing evaluation by a dentist Using the audio data collected as described above, we then applied a machine learning approach to evaluate and estimate a score for the user’s tooth brushing performance. To do this, we needed training data that could be used to generate score estimates. In this research, a dentist (researching tooth brushing instruction) prepared such training data, allowing for an evaluation of tooth brushing performance that is based on an actual dentist’s evaluation. One typical method used by dentists for evaluating tooth brushing is a plaque test. In a plaque test, a dentist applies a plaque indicator liquid to the patient’s teeth. This liquid reacts to the patient’s plaque, staining it so that the plaque is easily visible. This highlights the plaque left remaining after brushing, which the dentist then uses as the basis for scoring how well the patient brushed. While plaque tests are a typical method of evaluation, preparing a large amount of training data for machine learning using plaque tests would be costly. Additionally, because the scores derived from plaque tests are influenced by the foods eaten prior to testing, the condition of the patient’s saliva, and the methods of tooth brushing used in the days preceding the test, plaque tests may not be an ideal test for evaluating isolated sessions of tooth brushing. Because plaque tests are unsuitable for a machine learning approach to evaluation, we instead evaluated the brushing based on video data. Using the setup illustrated in Figure 1, we recorded video data for each session of tooth brushing using a smartphone. A dentist then evaluated the tooth brushing performance using the video data, and assigned evaluation scores for each session of tooth brushing. These scores were then combined with audio data extracted from the videos to build the score estimation models. Because the dentist evaluated the tooth brushing performance. c 2015 Information Processing Society of Japan ⃝. Vol.2015-UBI-47 No.1 Vol.2015-ASD-2 No.1 2015/7/27. based only on video data, the resulting score was independent of other factors such as what was eaten prior to the test or the condition of the subject’s saliva. During evaluation, the dentist assigned scores for each of the four regions of the mouth depicted in Figure 3. The evaluation of each of these four regions was conducted based on the following three criteria: - Coverage: Did the brushing evenly cover the entire region? - Stroke: Was the motion of the brush a fine stroke (good) or a rough stroke (poor)? - Duration: Was the region brushed for a sufficient amount of time? Researchers in the field of dental care instruction consider each of these criteria to be important for plaque removal. For a given region, we award up to 2 points for each of these criteria, with 2 points awarded if a criterion is fully satisfied, giving a maximum score of 6 points per region. Combining the scores for all four regions gives a maximum score of 24 points per session. 3.4 Relationship between evaluation criteria and plaque scores During this study, an experiment was carried out to verify the connection between our evaluation criteria and plaque scores. In this experiment, 14 subjects were videoed while brushing their teeth using the setup depicted in Figure 1. After brushing their teeth, a dentist then performed a plaque test on each subject, applying a plaque indicator liquid to each subject’s teeth and calculating a score based on the test results. After this, the videos were then used to determine the scores for the criteria used by this study. The experiment was conducted over two days, using the following procedure. On the first day, the subjects brushed their teeth using the setup depicted in Figure 1. Then, a dentist performed a plaque test on each subject, calculating a plaque score based on the results. On the second day, a dentist instructed the subjects on how to properly brush their teeth. This instruction was deemed necessary to facilitate the collection of data with high performance scores, after observing that many of the participants achieved poor performance scores on the first day. After the instruction, the subjects again brushed their teeth and another plaque score was calculated. Finally, all videos were evaluated using this study’s criteria to assign scores, and these scores were compared to the plaque scores. The experiment showed that plaque scores and the scores used in this study have a strong correlation (−0.76). The correlation is negative, since low plaque scores reflect proper brushing, while high values reflect proper brushing for our evaluation score. Therefore, by using this study’s scoring method, it is possible to assign scores that closely correspond to the de facto standard plaque score without applying plaque indicator liquid. Furthermore, based on these results, it is possible to easily prepare large amounts of tooth brushing scores using video data. 3.5 Data set In this study, we gathered a total of 94 sessions of tooth brushing from 14 participants. The average time for each session of 3.
(4) IPSJ SIG Technical Report. tooth brushing was approximately 94 seconds. The participants used either their own toothbrush, or a toothbrush which we provided. The study was conducted over the course of three months, with the data collected in a quiet environment, either in our graduate school building or in the participant’s own home. In addition, during the course of the experiment, each participant received instruction from a dentist on the proper tooth brushing technique. All sessions were evaluated using video data as was described in the section entitled Tooth brushing evaluation by a dentist. All audio data was labeled using the corresponding video data for each session, with each label corresponding to one of the classes of tooth brushing activity described in the section Tooth brushing activity.. 4. Proposed method 4.1 Na¨ıve architecture The basic procedure used in this study starts with using audio data to recognize the seven tooth brushing activities listed in the Tooth brushing activity section. We then extract independent (explanatory) variables from those recognition results, using these independent variables to build regression models for estimating scores for sessions of tooth brushing activity. Figure 4 shows our simplest implementation of this architecture. In this architecture, we use an HMM set consisting of seven HMMs, one for each of the seven tooth brushing activities, to recognize tooth brushing activities in the audio data. We then use the results from these seven models to create the independent variables for the regression model. Finally, the regression model outputs a score from 0 to 24, representing the total score for each session. However, in order to provide a user with an assessment of various aspects of their brushing, it is necessary to estimate the scores in more detail. Figure 5 shows such an architecture that estimates six separate scores (each ranging from 0 to 4), three scores each for the front teeth and back teeth, with those three scores corresponding to the three criteria: coverage, stroke, and duration. For example, the Front Coverage score represents the total coverage score for both the upper front teeth and the lower front teeth, including both the inner and outer surfaces. For even more detailed scores, an architecture could further differentiate between the inner and outer surfaces to give 12 separate scores (each ranging from 0 to 2), corresponding to the three criteria for each of the four regions of the mouth, e.g., Front Inner Duration and Front Outer Duration. (Note that, in general, an architecture that provides scores in finer granularity has higher estimation errors. Therefore, the decision of which architecture to apply to an application should consider both the granularity of scores required and the estimation accuracy required.) However, the simple architectures described above have the following problems: - Accurate classification of tooth brushing activities into seven classes is difficult, and in the case of some architectures it is unnecessary. For example, the architecture in Figure 5 estimates scores for only two regions, front teeth and back teeth. In this case, distinguishing between all seven tooth brushing activities may be unnecessary for score estimation, and more accurate estimates are possible by using a coarser set of models without the. c 2015 Information Processing Society of Japan ⃝. Vol.2015-UBI-47 No.1 Vol.2015-ASD-2 No.1 2015/7/27. inner surface and outer surface distinction. - Each of the regression models estimates scores using the classification results from an HMM set, but the usefulness of the tooth brushing activity classes varies for the different regression models. For example, when estimating the coverage score for the back teeth, activities related to the front teeth have less importance while activities such as BI-Fine and BO-Fine should be recognized as accurately as possible. By using coarser models depending on the needs of the regression model, more accurate results can be achieved. 4.2 Overview of proposed approach In the proposed method, we solve the problems with the na¨ıve architectures described above by preparing separate HMM sets for each of the regression models used for score estimation, as is shown in Figure 6. For example, in Figure 6, we prepare a specialized HMM set for the regression model that estimates a score for Front Inner Total. (Note that Total means the sum of the three evaluation criteria scores.) Each of the HMM sets generated is specialized to its regression model, in order to increase the estimation accuracy of the regression model. Specifically, we automatically discover which tooth brushing activities are useful for estimating the score in question and then generate an HMM set that focuses on only those classes. When doing so, we ignore any activity classes that are not considered useful for estimating the score. The recognition results from this reduced model set are then used to build the regression model for that score. We can divide the procedure for constructing the architecture for score estimation into three steps: (1) Identify which tooth brushing activity classes are important when estimating each score. (2) Generate HMM sets for accurately recognizing those important classes. (3) Build a regression model for estimating each score using the recognition results of those HMM sets. Each of these steps is explained in detail below. 4.3 Discovering useful tooth brushing activity classes As discussed above, the usefulness of tooth brushing activity classes vary for the different evaluation criteria. In this study, we use regression models to estimate the evaluation criteria, extracting independent variables from the audio recognition results, e.g., an independent variable for the total duration of segments recognized as belonging to the FI-Fine class. In order to determine the usefulness of the activity classes, we first use the training data to evaluate the usefulness of each of the independent variables in estimating each of the evaluation criteria. Using the results of this evaluation, we can then determine which tooth brushing activity classes are useful for each of the evaluation criteria. For example, if we determine that many of the independent variables calculated using the results from the FO-Fine class are useful for estimating a given score, then we consider the FO-Fine class to be useful for estimating that score. We start by evaluating the independent variables using the RReliefF algorithm [17], a feature selection algorithm which is used to determine the relevance of features to a given regression task. Given n instances of data, each with a set of feature values F (independent variables) along with a predicted value (depen4.
(5) Vol.2015-UBI-47 No.1 Vol.2015-ASD-2 No.1 2015/7/27. IPSJ SIG Technical Report. Fig. 4. Simple architecture for estimating a total score per session. Fig. 5. Architecture for providing detailed assessments by estimating six scores, one for each evaluation criterion for both the front and back of the mouth.. dent variable), RReliefF works by randomly selecting m of the n instances and then determining the k nearest neighbors for each of those m instances. The ith feature fi is assigned a weight based on the degree to which the value for fi for each random instance differs from the values for fi for the random instance’s k nearest neighbors, relative to how much the predicted value for the random instance differs from those of its k nearest neighbors. In simpler terms, a feature’s weight is increased if it discriminates between neighboring instances with differing predicted values and is decreased if it separates neighboring instances with similar predicted values. These weights indicate the importance of the feature fi to the regression task and approximate the difference of probabilities W( fi ) = Pr(FDi | PD) − Pr(FDi | PS ), where FDi means that the values for fi for neighboring instances differ, PD means that the predicted values for neighboring instances differ, and PS means that the predicted values for neighboring instances are similar [17]. Using the weights calculated by RReliefF for each of the features, we can then determine the usefulness of the set of tooth brushing activity classes C for a given evaluation criterion. The usefulness Uc of a tooth brushing activity class c ∈ C is calculated by summing the weights for Fc , where Fc is the subset of F consisting of the features that are computed using recognition results from the tooth brushing activity class c: ∑ Uc = W( f ). f ∈Fc. Since the weights output by RReliefF can be either positive or negative, we first perform feature scaling on all weights W( fi ) so that they fall in the range [0, 1] prior to computing Uc . After computing Uc , we then normalize the values in Uc to sum to 1. 4.4 Tailoring HMM sets to improve score estimates Using the method described in the previous subsection, we can determine which tooth brushing activity classes are useful for estimating scores for a given evaluation criterion. Using this information, we determine the HMM set used to estimate that criterion using only the identified useful classes. As mentioned previously, in the na¨ıve approach there are two issues that arise from using the same HMM set when estimating all the evaluation criteria: (1) Depending on the architecture being used, it may not be necessary to recognize the activities on as fine a scale as with all seven activity classes. (2) Depending on the score being estimated, the ideal set of activity classes to use in the HMM set may not include all seven classes. We address the first of these issues by. c 2015 Information Processing Society of Japan ⃝. Fig. 6. Proposed architecture in which specialized HMM sets are generated for each score estimator.. generating the following four basic HMM sets which have varying granularity: - HMM set 7: A 7-class HMM set generated using all seven tooth brushing activity classes. - HMM set 5: A 5-class HMM set generated using the classes outer surface of front teeth, outer surface of back teeth, inner surface of front teeth, inner surface of back teeth, and no activity (None). - HMM set FB: A 3-class HMM set for distinguishing between the front and back teeth, generated using the classes front teeth, back teeth, and no activity. - HMM set RF: A 3-class HMM set for distinguishing between stroke types, generated using the classes rough stroke, fine stroke, and no activity. We address the second of the issues with the na¨ıve architectures by generating a new HMM set from each basic HMM set, using the method described in the previous subsection to compute the usefulness Uc of each class c ∈ C as the basis for generating HMM sets tailored for estimating each score. We determine which classes to include by setting a threshold T =1 /|C| , where |C| is the total number of tooth brushing activity classes included in a basic HMM set. We then only include the class c in the new model set if Uc ≥ T . Thus, in our proposed method, we attempt to improve the recognition performance for the useful activity classes by ignoring unnecessary activity classes. For example, starting with the HMM set 7 above, in the case where the classes FO-Fine, FO-Rough, BO-Fine, BO-Rough, and None are determined to be unnecessary, we would combine those classes into a single Others class and create a three-class HMM set consisting of the models: FI-Fine, BI-Fine, and Others. By doing so, we can then increase the recognition performance of the more useful classes FI-Fine and BI-Fine. In our proposed method, we then estimate scores using a combination of eight total HMM sets, four basic HMM sets with varying granularity and four HMM sets that are tailored to the score being estimated. 4.5 Tooth brushing activity recognition Using the method described in the previous subsection to select the classes used in each of our HMM sets, we then generate the HMMs used for tooth brushing activity recognition. 4.5.1 Feature extraction In this study, we use MFCCs to recognize tooth brushing activities, as MFCCs have been reported to be one of the better trans-. 5.
(6) Vol.2015-UBI-47 No.1 Vol.2015-ASD-2 No.1 2015/7/27. IPSJ SIG Technical Report. formation schemes for environmental sound recognition [3], [4]. We compute a 12-order MFCC over a window of 50 ms with 50% overlap, windowed using a Hamming window. Along with this 12-order MFCC, we compute the log energy for the window, along with the corresponding 13-order delta and 13-order acceleration coefficients for the MFCC and log energy coefficients, giving a vector of 39 values in total. 4.5.2 Recognition with HMMs Our method recognizes tooth brushing activity classes in audio data using HMMs. The model for each class is a 10-state left-toright HMM with output distributions represented by 32 Gaussian mixture densities. The observed variables for the models are the vectors of 39 MFCC-based coefficients. As was mentioned in the introduction, the model of tooth brush and the shape of the user’s mouth can affect the sound made when brushing his/her teeth, so the audio obtained for the tooth brushing activities will differ per user. In order to cope with this issue, we also employ the maximum likelihood linear regression (MLLR) adaptation method [7], [14] to shift the output distributions of the initial tooth brushing activity models (HMMs) using the target user’s data, so that each state in the HMMs is more likely to generate the target user’s data. We use these HMM sets to recognize tooth brushing activities over full sessions of audio data using the Viterbi algorithm [16], finding the most probable sequence of tooth brushing activity classes across the session. Using these recognition results, we can then compute the independent variables used in the regression models. 4.6 Estimating scores 4.6.1 Computing independent variables Using the adapted HMMs, it is possible to recognize which tooth brushing activities were conducted in a session of audio data. For example, by using HMM set 7, it is possible to detect that the activity Outer surface of front teeth, rough stroke was conducted in the interval from 3.4 sec to 8.9 sec from the start of the audio. Using recognition results such as this, we can compute independent variables for use in the regression models for score estimation. For the first set of independent variables, we create a variable for each of the activity classes in our HMM sets, excluding the None and Others classes. Each of these variables is computed as the total duration of its corresponding tooth brushing activity in the recognition results. We then compute a second set of independent variables to help cope with a limitation we encounter when estimating scores using audio data. This limitation comes from the difficulty in distinguishing between the upper and lower teeth and between the right and left sides of the mouth. Because of this limitation, it is difficult to determine whether an activity was conducted evenly across both the upper and lower teeth or across both the back-left and back-right sides of the mouth. However, take for example the case where a user brushes only their upper teeth. In this case, we expect that features extracted from the audio data will not vary greatly over the course of the activity. On the other hand, if the user had brushed both the upper and lower teeth, then we would expect the features to vary more. Based on this idea, we generate additional independent variables corresponding to the variance of. c 2015 Information Processing Society of Japan ⃝. feature values across a given activity, generating one such independent variable for each of the features (MFCCs). 4.6.2 Estimating a score for each criterion Finally, using these independent variables, we estimate the evaluation scores using regression analysis. We first perform dimensionality reduction using the Random Projection algorithm [5] to reduce the number of variables down to 10. Using these 10 independent variables, we then estimate the scores using the SMO algorithm [19].. 5. Evaluation 5.1 Evaluation methodology In order to investigate the effectiveness of the proposed method, we prepared the following methods: - Avg: A baseline method in which we estimated a user’s scores using the average scores for other users. - SHMM: A baseline method in which we prepared only a single HMM set (HMM set 7). Otherwise this method was the same as the proposed method. - SHMM100: A baseline method that is a variation of the SHMM method in which we built the regression models using corrected labels instead of actual audio recognition results, i.e., this method simulates 100% recognition accuracy for HMM set 7. - MHMM: A baseline method in which we prepared four basic HMM sets: HMM set 7, HMM set 5, HMM set FB, and HMM set RF. Otherwise this method was the same as the proposed method. - Proposed: The proposed method, in which we prepared a separate group of eight HMM sets for each of the scores. Additionally, the following six evaluation architectures were prepared for use with those methods: - Total (24): Estimated a single score (24-point scale) that represents the total score for all tooth brushing activity in the session. - CSD (8): Estimated three scores (8-point scale), one for each of the evaluation criteria: coverage, stroke, and duration. For example, a single score was output for stroke, representing the stroke quality for the entire session. - FB (12): Estimated two scores (12-point scale), one for the front teeth and one for the back teeth. - FB x CSD (4): Estimated six scores (4-point scale), corresponding to each of the three evaluation criteria for both the front teeth and back teeth. For example, a score was output for the duration criterion for the front teeth. - IO x FB (6): Estimated four scores (6-point scale), one for each region of the mouth: outer surface of front teeth, inner surface of front teeth, outer surface of back teeth, and inner surface of back teeth. - IO x FB x CSD (2): Estimated 12 scores (2-point scale), corresponding to each of the three evaluation criteria for each region of the mouth. For example, a score was output for the duration criterion for the outer surface of back teeth. All methods were evaluated using their mean absolute error (MAE) and error ratio (MAE/Maximum S core), with the evaluation done using leave-one-user-out cross validation. That is, when using a user’s data as the test data, the training data consisted of 6.
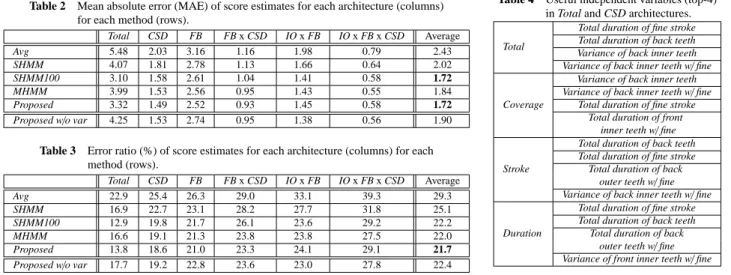
(7) Vol.2015-UBI-47 No.1 Vol.2015-ASD-2 No.1 2015/7/27. IPSJ SIG Technical Report. Table 1 Recognition results for basic HMM sets used in this study. HMM set 7 HMM set 5 HMM set FB HMM set RF. precision 0.457 0.485 0.658 0.677. recall 0.455 0.506 0.654 0.692. F-measure 0.451 0.491 0.652 0.684. the data collected from other users. However, when conducting MLLR adaptation, the adaptation data consisted of the current user’s data (excluding the session being tested). 5.2 Tooth brushing activity recognition results Table 1 shows the recognition results for each of the basic HMM sets used in this study, using the macro-averaged Fmeasure as the performance metric. Both HMM set 7 and HMM set 5 had similar results, with F-measures of 0.451 and 0.491 respectively. Both HMM set FB and HMM set RF had comparable results, achieving average F-measures of 0.652 and 0.684, respectively. In all cases, accuracy is well below 100%, but still high enough to gain a significant amount of information about the location and brush stroke that corresponds to the audio data. 5.3 Score estimation results 5.3.1 Score estimation error Table 2 shows the mean absolute error (MAE) for each architecture using each of the prepared methods. When looking at these results, SHMM100 shows the results when the tooth brushing activity recognition was assumed to have 100% accuracy, and so this is assumed to be the lower bound on score estimation accuracy for a straightforward architecture. Here we observe that the error for the Total architecture for Avg was about 1.8 times as high as that of SHMM100. Additionally, when comparing the SHMM100 results to SHMM, SHMM100 again showed lower error rates, with an MAE 0.97 points lower than that of SHMM for Total. Comparing the error for Total for MHMM to SHMM, MHMM had an MAE that was 0.18 points lower. Using Proposed, the MAE for Total was reduced by 0.75 points from that of SHMM. In addition, using Proposed, we were able to reduce the MAE for Total by over 2 points in comparison to Avg. Moreover, Proposed was able to achieve the same average MAE across the architectures as SHMM100. In comparison to SHMM100, which had a recognition accuracy of 100%, the recognition accuracy for the HMM results in Proposed was much lower. However, by preparing HMM sets that were built using HMMs considered useful to each recognition task, Proposed was able to compensate for its lower recognition accuracy. Looking across all the architectures shown in Table 2, Proposed achieved a much lower MAE than Avg for all the architectures, achieving accuracies similar to those of SHMM100. Table 3 shows the error ratios for the estimates for each architecture using each of the prepared methods. Here, error ratios are computed as the MAE divided by the maximum score, e.g., an MAE of 2.4 for a 24-point scale would have an error ratio of 10%. It can be seen that overall the Proposed method reduced error ratios by about 7.6% on average from those of Avg. Additionally, Proposed reduced error rates by 3.4% on average compared to SHMM and by 0.3% on average compared to MHMM.. c 2015 Information Processing Society of Japan ⃝. 5.3.2 Effectiveness of variance variables In Tables 2 and 3, Proposed w/o var shows the accuracy of Proposed when we omitted the independent variables corresponding to the variances of feature values. Without the variance variables, the average MAE increased by about 0.18 points (0.7% in terms of error ratios). As was discussed above, by using the features’ variance, we were able to capture the variation in the toothbrush’s locations. We believe that including this variance improved the regression results beyond what is achieved through using the HMM results alone, because the audio-based HMM results could not distinguish certain location distinctions such as upper teeth vs lower teeth. In the case of the CSD architecture, incorporating the features’ variance reduced the MAE for the Coverage score from 1.65 to 1.53 and reduced the MAE for the Stroke score from 1.63 to 1.55. On the other hand, the MAE for the Duration score did increase from 1.32 to 1.38. Despite that small increase, a large performance improvement was observed overall by use of variance in this architecture. 5.3.3 Differences in results between architectures As can be seen in Table 3, the error ratio for the Total architecture was reduced down to 13.8% using the Proposed method, but as we look at architectures that estimated scores on a finer granularity, we see that the estimation accuracy degraded. For example, upon reaching the fine-scale IO x FB x CSD architecture, which estimates scores on a 2-point scale, the error ratio reached 29.1%. Such an architecture restricts the correct scores to the discrete values 0, 1, and 2, which increases the error ratio for estimates. In the FB architecture, the MAE for the front teeth score was 2.17 while the MAE for the back teeth score was 2.88. This is in contrast to the HMM recognition results, where accuracies for classes related to the back teeth were mostly higher than those for classes related to the front teeth. On the other hand, in the FB x CSD architecture, the average MAE for the three scores related to the front teeth was 0.95 while the average MAE for the three scores for the back teeth was 0.90, a reverse of the situation with FB. The results in Table 3 show that despite the fact that FB x CSD provided more detailed estimates than did FB, the error ratio does not change significantly. Based on these results, we believe that it probably was not possible to generate a good regression model in FB to estimate the score obtained by summing the scores for the three criteria. In FB x CSD, the Duration score averaged across the back and front teeth had an MAE of 0.74. On the other hand, for Stroke the averaged score had an MAE of 1.08 and for Coverage it was 1.04. Just as with the CSD architecture, the Duration score’s MAE is lower than those of the other criteria, since Duration can be computed directly from the lengths of each activity. As for the IO x FB architecture, the accuracies for scores related to the inner surface of back teeth were the worst. Among the results for the IO x FB x CSD, the MAE for the scores related to Stroke were as high as 0.95. On the other hand, the MAEs for Duration and Coverage were 0.51 and 0.73 respectively. When analyzing the results of audio recognition, we found that the recognition accuracy for BI-Fine was low, which most likely had a large influence on the aforementioned regression results. 7.
(8) Vol.2015-UBI-47 No.1 Vol.2015-ASD-2 No.1 2015/7/27. IPSJ SIG Technical Report. Table 2. Mean absolute error (MAE) of score estimates for each architecture (columns) for each method (rows).. Avg SHMM SHMM100 MHMM Proposed Proposed w/o var. Total 5.48 4.07 3.10 3.99 3.32 4.25. CSD 2.03 1.81 1.58 1.53 1.49 1.53. FB 3.16 2.78 2.61 2.56 2.52 2.74. FB x CSD 1.16 1.13 1.04 0.95 0.93 0.95. IO x FB 1.98 1.66 1.41 1.43 1.45 1.38. IO x FB x CSD 0.79 0.64 0.58 0.55 0.58 0.56. Average 2.43 2.02 1.72 1.84 1.72 1.90. Table 3 Error ratio (%) of score estimates for each architecture (columns) for each method (rows). Avg SHMM SHMM100 MHMM Proposed Proposed w/o var. Total 22.9 16.9 12.9 16.6 13.8 17.7. CSD 25.4 22.7 19.8 19.1 18.6 19.2. FB 26.3 23.1 21.7 21.3 21.0 22.8. FB x CSD 29.0 28.2 26.1 23.8 23.3 23.6. IO x FB 33.1 27.7 23.6 23.8 24.1 23.0. IO x FB x CSD 39.3 31.8 29.2 27.5 29.1 27.8. 5.3.4 Effectiveness of independent variables This section discusses the independent variables that were useful for estimating various scores. We determined the usefulness for these variables using the RReliefF algorithm described earlier. Table 4 shows that the variable for the total length of time spent brushing the teeth with a fine stroke was found to be useful for the Total architecture. Its usefulness was likely because it provides essential information related to both Stroke and Duration. For the CSD architecture, the variances of MFCC features across various brushing locations were useful for estimating Coverage scores. When estimating Stroke scores, the useful variables were the total times for fine strokes for various brushing locations. For Duration, the useful variables corresponded to total times brushing at the various locations. The results for the other architectures tended to be similar to those for CSD. However, in the case of the FB architecture, there were a number of variables judged by RReliefF to be useful that were only indirectly related to the score being calculated. For example, when estimating scores for the front teeth, variables such as the total time spent brushing teeth with a fine stroke, computed from HMM set RF results, were found to be useful. It appears that in many cases, if the total time spent brushing with a fine stroke was long, then the total time spent brushing the front teeth with a fine stroke was also long. However, we believe that the inclusion of such indirectly related independent variables had a negative effect on the FB architecture, contributing to its poor performance.. 6. Conclusion This paper presented a new method for evaluating tooth brushing performance using audio collected from a smartphone. In the experiment, our method achieved good performance in estimating scores for use in evaluating tooth brushing. In our future work, we plan to employ deep learning techniques to discover useful features tailored for recognizing tooth brushing audio.. [3] [4] [5] [6] [7] [8]. [9]. [10]. [11]. [12]. [13]. [14] [15] [16]. [17] [18]. References [1] [2]. Addy, M. and Hunter, M.: Can tooth brushing damage your health? Effects on oral and dental tissues, International dental journal, Vol. 53, No. S3, pp. 177–186 (2003). Chang, Y.-C., Lo, J.-L., Huang, C.-J., Hsu, N.-Y., Chu, H.-H., Wang, H.-Y., Chi, P.-Y. and Hsieh, Y.-L.: Playful toothbrush: ubicomp tech-. c 2015 Information Processing Society of Japan ⃝. [19]. Average 29.3 25.1 22.2 22.0 21.7 22.4. Table 4. Total. Coverage. Stroke. Duration. Useful independent variables (top-4) in Total and CSD architectures. Total duration of fine stroke Total duration of back teeth Variance of back inner teeth Variance of back inner teeth w/ fine Variance of back inner teeth Variance of back inner teeth w/ fine Total duration of fine stroke Total duration of front inner teeth w/ fine Total duration of back teeth Total duration of fine stroke Total duration of back outer teeth w/ fine Variance of back inner teeth w/ fine Total duration of fine stroke Total duration of back teeth Total duration of back outer teeth w/ fine Variance of front inner teeth w/ fine. nology for teaching tooth brushing to kindergarten children, Proceedings of the SIGCHI Conference on Human Factors in Computing Systems, ACM, pp. 363–372 (2008). Chen, J., Kam, A., Zhang, J., Liu, N. and Shue, L.: Bathroom activity monitoring based on sound, Pervasive 2005, pp. 47–61 (2005). Cowling, M.: Non-speech environmental sound recognition system for autonomous surveillance, PhD Thesis, Griffith University (2004). Fradkin, D. and Madigan, D.: Experiments with random projections for machine learning, KDD 2003, pp. 517–522 (2003). Ganss, C., Schlueter, N., Preiss, S. and Klimek, J.: Tooth brushing habits in uninstructed adults 窶杷 requency, technique, duration and force, Clinical oral investigations, Vol. 13, No. 2, pp. 203–208 (2009). Gauvain, J. and Lee, C.: Maximum a posteriori estimation for multivariate Gaussian mixture observations of Markov chains, IEEE Trans. on Speech and Audio Processing, Vol. 2, No. 2, pp. 291–298 (2002). Gerritsen, A. E., Allen, P. F., Witter, D. J., Bronkhorst, E. M. and Creugers, N.: Tooth loss and oral health-related quality of life: a systematic review and meta-analysis, Health Qual Life Outcomes, Vol. 8, No. 126, p. 552 (2010). Graetz, C., Bielfeldt, J., Wolff, L., Springer, C., Fawzy El-Sayed, K. M., S¨alzer, S., Badri-H¨oher, S. and D¨orfer, C. E.: Toothbrushing education via a smart software visualization system, Journal of periodontology, Vol. 84, No. 2, pp. 186–195 (2013). Inada, E., Saitoh, I., Yu, Y., Tomiyama, D., Murakami, D., Takemoto, Y., Morizono, K., Iwasaki, T., Iwase, Y. and Yamasaki, Y.: Quantitative evaluation of toothbrush and arm-joint motion during tooth brushing, Clinical oral investigations, pp. 1–12 (2014). Janusz, K., Nelson, B., Bartizek, R. D., Walters, P. A. and Biesbrock, A.: Impact of a novel power toothbrush with SmartGuide technology on brushing pressure and thoroughness, J Contemp Dent Pract, Vol. 9, No. 7, pp. 1–8 (2008). Kim, K.-S., Yoon, T.-H., Lee, J.-W. and Kim, D.-J.: Interactive toothbrushing education by a smart toothbrush system via 3D visualization, Computer methods and programs in biomedicine, Vol. 96, No. 2, pp. 125–132 (2009). Lee, Y.-J., Lee, P.-J., Kim, K.-S., Park, W., Kim, K.-D., Hwang, D. and Lee, J.-W.: Toothbrushing Region Detection Using Three-Axis Accelerometer and Magnetic Sensor, Biomedical Engineering, IEEE Transactions on, Vol. 59, No. 3, pp. 872–881 (2012). Leggetter, C. and Woodland, P.: Maximum likelihood linear regression for speaker adaptation of continuous density hidden Markov models, Computer Speech & Language, Vol. 9, No. 2, pp. 171–185 (1995). Lu, H., Pan, W., Lane, N., Choudhury, T. and Campbell, A.: SoundSense: scalable sound sensing for people-centric applications on mobile phones, MobiSys 2009, pp. 165–178 (2009). Rabiner, L.: A tutorial on hidden Markov models and selected applications in speech recognition, Proceedings of the IEEE, Vol. 77, No. 2, pp. 257–286 (1989). ˇ Robnik-Sikonja, M. and Kononenko, I.: An adaptation of Relief for attribute estimation in regression, ICML 1997, pp. 296–304 (1997). Rossi, M., Feese, S., Amft, O., Braune, N., Martis, S. and Troster, G.: AmbientSense: A real-time ambient sound recognition system for smartphones, IEEE International Conference on Pervasive Computing and Communications Workshops (PERCOM 2013 Workshops), pp. 230–235 (2013). Shevade, S., Keerthi, S., Bhattacharyya, C. and Murthy, K.: Improvements to the SMO algorithm for SVM regression, IEEE Trans. on Neural Networks, Vol. 11, No. 5, pp. 1188–1193 (2002).. 8.
(9)
図


関連したドキュメント
A Tabu search procedure is then used to select a subset of financial ratio variables which best predict bankruptcy from among a larger initial set of 20 variables, and use that
A Tabu search procedure is then used to select a subset of financial ratio variables which best predict bankruptcy from among a larger initial set of 20 variables, and use that
Using a projection approach, we obtain an asymptotic information bound for estimates of parameters in general regression models under choice-based and two-phase outcome-
T. In this paper we consider one-dimensional two-phase Stefan problems for a class of parabolic equations with nonlinear heat source terms and with nonlinear flux conditions on the
For performance comparison of PSO-based hybrid search algorithm, that is, PSO and noising-method-based local search, using proposed encoding/decoding technique with those reported
Possibly new results derived from these formulas are a limit from Koornwinder to Macdonald polynomials, an explicit formula for Koornwinder polynomials in two variables, and
We estimate the standard bivariate ordered probit BOP and zero-inflated bivariate ordered probit regression models for smoking and chewing tobacco and report estimation results
The aim of the present paper is to establish some new linear and nonlinear discrete inequalities in two independent variables.. We give some examples in difference equations and we
