研究報告
1. カオリン中における移動現象のナノ・ミクロ・マクロ解析,崔定海,市川康明,河村雄行,Int. J. Numer. Analy. Meth. Geomech., Vol.33, pp.687-707.
2. 気象影響を高精度に考慮した屋外音響伝搬解析手法の構築,比江島慎二,向井靖彦,渡邊恭,土木学会論文 集A,Vol. 65,No. 3,pp.708-717,2009 3. 貯水池側湾の対流循環に伴う下層密度流の流動過程,河内友一,山磨敏夫,山本有生,大久保賢治,土木学 会論文集B,Vol. 65,No. 1,pp.46-55,2009.3 4. 連結石枠型工の中詰め材の掃流限界評価,前野詩朗,藤原実咲,山村明,忰熊公子,水工学論文集,第 53 巻,pp.973-978,2009 5. 地中レーダを用いた砂質土地盤における不飽和浸透挙動の非破壊計測,竹下祐二,森上慎也,森田周三,黒 田清一郎,井上光弘,土木学会論文集C,Vol.65,No.4, pp.943-950, 2009. 6. 低炭素社会に向けた居住者を対象とした自動車CO2 排出量の削減方策の効果-地域構造・ガソリン価格・ 低燃費車に着目して-,谷口守,橋本成仁,氏原岳人,古川のり子,環境システム論文集,Vol.37,2009 7. ドライバーの街路空間イメージを利用した通過交通の抑制に関する研究,橋本成仁,谷口守,吉城秀治,都 市計画論文集,Vol. 44,No. 3,pp.67-72,2009 8. 岡山市内国道53号における自転車道整備効果の検証,阿部宏史,崎大樹,岩元浩二,冨田修一,土木計画 学研究・論文集,Vol.26,No.4,pp.647-654,2009 9. 農林漁業・食品工業・農林関連産業を細分化した産業連関表による地域経済分析,阿部宏史,新家誠憲,藤 田真司,花岡千草,地域学研究,第39 巻,第 2 号,pp.283-303,2010 10. バブル経済期前後における雇用増加率の地域間格差に関する産業連関分析,是友修二,阿部宏史,新家誠憲, 地域学研究,第39 巻,第 2 号,pp.283-303,2010 11. 農林漁業・食品工業部門の環境負荷発生構造に関する地域産業連関分析,宇都宮裕樹,阿部宏史,花岡千草, 地域学研究,第39 巻,第 4 号,2010 12. 高炉水砕スラグを用いたセメント硬化体の耐硫酸性に関する研究,藤井隆史,細谷多慶,松永久宏,綾野克 紀,コンクリート工学年次論文集,Vol. 31,No. 1,pp.847-852,2009.7
13. Nano-Micro-Macro-Analyses of Transport Phenomena in Kaolinite Clay, CHOI Jung Hae, ICHIKAWA Yasuaki and KAWAMURA Katsuyuki, Int. J. Numer. Analy. Meth. Geomech., Vol.33, pp.687-707 14. VOF-DEM-FEM Combined Model of the Reef Breakwater Collapse, MAENO Shiro, BIERAWSKI G.
Lechoslaw and MAGDA Waldemar, Coastal Engineering Journal, Vol. 51, No. 3, pp.223–242, 2009 15. A Simple Bayesian Method to Combine Lithofacies Data with Drawdown Measurements When
Calibrating a Groundwater Flow Model, Mitsuru Komatsu, Christophe C. Frippiat, Toshihiro Sakaki and Tissa H. Illangasekare, AGU Fall meeting, Poster No. H43F-1088, December 14-18, San Francisco, CA, 2009
16. Resistance of Concrete with Granulated Blast Furnace Slag Sand to Sulfuric Acid Attack, AYANO Toshiki, MATSUNAGA Hisahiro, FUJII Takashi and SAKATA Kenji, Proceedings of ConMat'09 4th International Conference on Construction Materials: Performance, innovations and Structural Implications, Vol. 2, pp.921-926, 2009.8
17. Household solid waste generation and characteristic in a Mekong Delta city, Vietnam, THANH Nguyen Phuc, MATSUI Yasuhiro and FUJIWARA Takeshi, Proceedings of the 20th Annual Conference of The Japan Society of Material Cycles and Waste Management (JSMCWM), pp 583-584, 2009.9
18. Satellite Observations of Decadal Scale CO2 Fluxes over Black Spruce Forests in Alaska Associated
with Climate Variability, DATE Takafumi, UEYAMA Masahito, HARAZONO Yoshinobu, OTA Yuji, IWATA Toru and YAMAMOTO Susumu, Journal of Agricultural Meteorology, 65, Vol. 1, pp.47-60, 2009.3
カオリン中における移動現象のナノ・ミクロ・マクロ解析
Nano-Micro-Macro-Analyses of Transport Phenomena in Kaolinite Clay崔 定海1),市川康明2),河村雄行3)
CHOI Jung Hae1), ICHIKAWA Yasuaki2) and KAWAMURA Katsuyuki3) ■ 概 要 ■
カオリンは普遍的な粘土であり,Si 四面体層と Al 八面体層が各 1 層重なった 1:1 構造を有するナノ レベルの板状結晶である.カオリン結晶の水和物の挙動を解明するために分子動力学(MD)計算によって 物性を求め,それをマルチスケール均質化解析(HA)に導入して,ナノ・ミクロ・マクロスケールを統合 したカオリン粘土の解析を実施した.なお,MD/HA 統合解析は既にベントナイト粘土の浸透,拡散, 圧密等の解析に適用して成功を収めている(Ichikawa, Y. et al. Engineering Geology, 54, 21-31, 1999 参照).
本研究ではMD/HA 統合解析をカオリン粘土の浸透,拡散の解析に適用し,ミクロレベルの相似則を求 めている. ■キーワード■ ケイ酸塩鉱物,石英,圧力溶解,pH,温度,溶解速度 ■ 所 属 ■ 1) 環境デザイン工学科 研究員 2) 環境デザイン工学科 教授 3) 東京工業大学大学院理工学研究科地球惑星科学専攻 教授 ■ 掲載先 ■
Int. J. Numer. Analy. Meth. Geomech., Vol.33, pp.687-707.
査読:あり,言語:英語
図-2 カオリン結晶のスタック
0.8 nm Aluminum octahedral sheet
Silica tetrahedral sheet
図-1 カオリン結晶の原子配置
External water
Silicate (Si-O) surface Gibbsite (Al-O) surface 0 1nm
1.00E-06 6.00E-06 1.10E-05 1.60E-05 6 4 1.5
Distance from gibbsite surface [nm] 5.00E-04 1.00E-03 1.50E-03 2.00E-03 2.50E-03 3.00E-03 3.50E-03 Diffusion coefficient Viscosity V isc o si ty [Pa s] D if fu si o n co e ff ic ien t [c m 2/s ] O OH Al Si Aluminum octahedral sheet
Silica tetrahedral sheet
0.8 nm
図-3 MD モデルと拡散係数・粘性係数の局所分布
Macroscale Problem with periodic micro-structure
X1 1 X1 2 Microscale Problem Ω1f Ω4: macro-domain = X0 2 εX12 = X0 1 εX11 x0 2 x0 1 x1=x0/4 Ω1s Ω1s Ω1f : fluid phase Ω1s : solid phase x1 1 x1 2 Ω4: micro-domain 図-4 マルチスケール均質化法
気象影響を高精度に考慮した屋外音響伝搬解析手法の構築
Numerical Analysis Method for High-Accuracy Prediction of Outdoor Sound Propagation under the Influence of Meteorological Conditions
比江島慎二1),向井靖彦2),渡邊恭3)
HIEJIMA Shinji1), MUKAI Yasuhiko2) and WATANABE Tadashi 3)
■ 概 要 ■ 風や気温などの気象条件の空間的な非一様性や非定常性の影響を受ける屋外音場のより高精度な予 測を実現するため,流れ場と音場の精密な連成項を考慮した空力音分離解法の基礎方程式にもとづく数 値解析手法を構築した.差分法に基づく有限空間解析において,屋外の半無限空間への音響伝搬を実現 するため,無反射境界条件を設定し,図-1のように外部境界での無反射を実現した.また,異なる気 温領域間の伝搬(図-2)や鉛直方向に非一様な風速分布を有する領域における伝搬(図-3)を精度 良く再現することに成功した.さらに,図-4のように,非一様な風速分布が存在する屋外において音 源の風上に音の伝わらない“シャドーゾーン”と呼ばれる領域が発生する現象を捉えることに成功した. 図-1 3 次元球面波 (a) 解析条件 (b) 音圧分布 図-2 気温差がある空間内の音響伝搬 -80.0 -60.0 -40.0 -20.0 0.0 20.0 40.0 60.0 80.0 0 20 40 60 80 wind speed x2 (m) (m/s) (a) 風速分布 (b) 音圧分布 図-3 有風時の音響伝搬 図-4 非一様風による音響伝搬のシャドーゾーン (上図:風上領域,下図:風下領域) ■キーワード■ 半無限空間,屋外騒音,気温,風,高精度予測 ■ 所 属 ■ 1) 環境デザイン工学科 准教授 2) 五洋建設(株) 3) トヨタテクニカルディベロップメント(株) ■ 掲載先 ■ 土木学会発行,土木学会論文集A,Vol. 65,No. 3,pp.708-717,2009 査読:あり,言語:日本語
貯水池側湾の対流循環に伴う下層密度流の流動過程
Field Observation for Convective Circulation due to Surface Cooling in the Sidearm of a Reservoir
河内友一1),山磨敏夫2),山本有生3),大久保賢治4)
KOCHI Yuichi1), YAMATOGI Tosio2), YAMAMOTO Yu 3) and OKUBO Kenji4) ■ 概 要 ■ ダム貯水池側湾底層に係留した水質・流速記録と機器設置・回収時に側湾奥から本川ダム壁近傍まで 測定した水質鉛直分布により以下の流動過程を議論した.貯水池下流端深部の低温貧酸素状態が回収時 には10mg/L まで回復するとともに水温が上昇し,その間,側湾底層の流速記録から冷却性対流循環に より側湾から本川へ向かう下層密度流の発生が確認された.貯水池内の下層密度流の縦断構造を斜面で 発生する下層プルームの相似解と比較・評価した.貧酸素・低温の貯水池底水が側湾から発生する下層 密度流として潜入した水に置換えられている実態が明らかにされた. 図-1 密度流発生時の底層流向 図-2 側湾底層の流速成分時系列 (a) 0.000 0.005 0.010 m/s2 S1 S2 S3 S4 S5 S6 S7 S8 S9 0.000 0.005 0.010 m/s2 αΔTg(10/31) αΔTg(11/9) S1 S2 S3 S4 S5 S6 S7 S8 S9 0.000 0.005 0.010 m/s2 (b) 0.0000 0.0001m/s20.0002 S1 S2S3 S4 S5 S6 S7 S8 S9 0.0000 0.0001m/s20.0002 0.0000 0.0001m/s20.0002 σΔCg(10/31) σΔCg(11/9) (c) -2 0 2 4 6 8 10 mg/L DO(11/9)-DO(10/31) -2 0 2 4 6 8 10 mg/L -2 0 2 4 6 8 10 mg/L S9 S5 S1 S2 S3S4 S6 S7 S8 図-3 二観測日の鉛直分布と両日間の変化量コンタ (a)水温浮力;(b)濁度浮力;(c)溶存酸素増分 ■キーワード■
field observation, reservoir, density current, dissolved oxygen, convective circulation ■ 所 属 ■ 1) 中国電力(株)エネルギア総合研究所 2) ナカシマプロペラ(株)開発本部 3) 大学院環境学研究科博士前期課程 4) 環境デザイン工学科 教授 ■ 掲載先 ■ 土木学会発行,土木学会論文集B,Vol. 65,No. 1,pp.46-55,2009.3 査読:あり,言語:日本語
連結石枠型工の中詰め材の掃流限界評価
Evaluation on Tractive Criteria of Filled Gravel in Frame-Shaped Connected Stone
前野詩朗1),藤原実咲2),山村 明3),忰熊公子4)
MAENO Shiro1), FUJIWARA Misaki2), YAMAMURA Akira3) and KASEGUMA Kimiko4) ■ 概 要 ■ 本研究は,多自然河床保護工として,写真-1の赤枠に示すような5 つの石礫で構成される連結石を 組み合わせて構築される連結石枠型工を提案した.本工法では,写真の青枠で示す部分に河川工事の際 に現地で発生する石礫を中詰め材として利用する.そこで,これまでの研究で明らかにされていない中 詰め材の設計掃流限界を実験的に検討した.図-2は図-1に示す位置の中詰め材の流出状況を示して いる.得られた主要な結論は以下のとおりである. 1) 連結石枠型工の中詰め材の流速原点位置は中詰め材平均高となる.2) 中詰め材の多少の流出を許容 する場合には,中詰め材の無次元限界掃流力を大きくすることができる.3) 連結石枠型工の中詰め材 の限界掃流力は,籠工のそれと同程度である.4) 中詰め材の限界掃流力は,連結石枠型工の枠により 規定される. 写真-1 連結石枠型工 flow x 図-1 流失状況計測位置(番号は洗掘深計測点) A 0.0 0.2 0.4 0.6 0.8 1.0
1 2 3 4 5 ave max min h/hf [cm] 通水前 45ℓ/s 50ℓ/s 55ℓ/s 60ℓ/s 65ℓ/s 70ℓ/s hs B 0.0 0.2 0.4 0.6 0.8 1.0
1 2 3 4 5 ave max min h/hf [cm] 通水前 45ℓ/s 50ℓ/s 55ℓ/s 60ℓ/s 65ℓ/s 70ℓ/s hs 図-2各地点での洗掘状況(図中の横軸は図-4 参照,ave は平均値,max,min はそれぞれ最大,最小洗掘箇所の値) ■キーワード■ 多自然水理構造物,自然石,連結石,中詰め材,掃流限界 ■ 所 属 ■ 1) 環境デザイン工学科 教授 2) 建設技術研究所(株)大阪本社防災室 3) 日建工学(株)総合技術研究所 ■ 掲載先 ■ 水工学論文集,第53 巻,pp.973-978 ,2009. 査読:あり,言語:日本語
地中レーダを用いた砂質土地盤における不飽和浸透挙動の非破壊計測
Non-Destructive Measurements of Unsaturated Seepage Flow by Using Ground-Penetrating Radar竹下祐二1),森上慎也2),森田周三3),黒田清一郎4),井上光弘5)
TAKESHITA Yuji1), MORIKAMI Shinya2), MORITA Syuzo3), KURODA Seiichiro4) and INOUE Mitsuhiro5) ■ 概 要 ■ 砂質土地盤における浅層領域での不飽和浸透挙動の計測方法として,地表設置型の地中レーダ(GPR) を用いた方法を提案し,原位置不飽和浸透試験を実施した結果に基づいて,その適用性および有用性に ついて述べた.自然乾燥状態にある均質な砂丘砂地盤において,一定量の散水を行って地盤内に断面2 次元不飽和浸透流を発生させた.その浸潤前線の非定常挙動をGPRプロファイル測定によって地表面か ら非破壊状態で計測を行い,地盤の2次元断面画像化(図−1,2)による不飽和浸透領域の定性的評価を 行った.また,GPRによって測定された反射電磁波の経時変化(図−3)より,反射波ピーク位置1〜3を 検出して,浸潤前線位置の非定常挙動の定量的な評価を行い,浸透流解析手法による数値シミュレーシ ョンおよび土中水分量計測データと比較した結果,図−4に示すように良好な一致が認められた. 図1 地盤の断面画像(散水開始前) 図2 地盤の断面画像(散水開始後 29 分) -5 0 5 10 15 20 25 30 -10000 0 10000 1 2 3
Two way travel time (ns)
Radar wave's amplitude
-5 0 5 10 15 20 25 30 1 2 3 T w o way tr avel time ( ns)
Radar wave's amplitude
-10000 0 10000 (a) 散水開始後 13 分 (b) 散水開始後 21 分 図-3 浸潤前線降下による反射電磁波の経時変化 0 20 40 60 80 100 0 10 20 30 40 50 60 70 80 Computed by seepage flow analysis Picked peak1 Picked peak2 Picked peak3 2cm-12cm 12cm-22cm 22cm-32cm 32cm-42cm
Heigh of wetted zone (cm)
Time (min)
Measured by GPR
Measured by soil moisture sensor 図-4 浸潤前線位置の経時変化の比較 ■キーワード■ 地中レーダー,不飽和浸透,非破壊試験,不飽和砂質土 ■ 所 属 ■ 1) 環境デザイン工学科 教授 2) (株)大林組東京本社 3) (株)竹中土木広島支店 4) (独)農研機構農村工学研究所 主任研究員 5) 鳥取大学乾燥地研究センター 教授 ■ 掲載先 ■ 土木学会発行,土木学会論文集C,Vol.65,No.4, pp.943-950, 2009. 査読:あり,言語:日本語
低炭素社会に向けた居住者を対象とした自動車
CO
2排出量の削減方策の効果
-地域構造・ガソリン価格・低燃費車に着目して-
How Can We Reduce Automobile CO2 Emissions as Inhabitants for Coming Low Carbon Society?:From the
Viewpoint of Regional Form, Gasoline Prices, and Fuel-Efficient Cars
谷口守1),橋本成仁2),氏原岳人3),古川のり子4)
TANIGUTI Mamoru1), HASHIMOTO Seiji2), UJIHARA Takehito3) and FURUKAWA Noriko4) ■ 概 要 ■ 本研究では都心から中山間部までの多様な地域から構成される広島都市圏を対象に,居住者の自動車 CO2排出量削減に向けた諸施策を複合的に実施した場合の地域特性別の効果を検討した.具体的には地 域構造転換・ガソリン価格の上昇・低燃費車の普及など多種の施策を組み合わせ,居住者に対するアン ケート調査に基づき,施策受容性や意識を踏まえたシナリオ分析を行った.この結果,最も効果の高い 施策の組み合わせでは,都市圏全域で2035 年に BAU 比 39.4%の削減まで可能であることが示された. なお,郊外部での削減は,中山間部や中心部に比べ相対的に容易でないことも明らかとなった. 表-3 施策の組み合わせによる地域別 CO2排出量削減率 図-5 中心部における CO2排出量の変化 (総量・一人当たり) 図-6 郊外部における CO2排出量の変化 (総量・一人当たり) 図-7 中山間部における CO2排出量の変化 (総量・一人当たり) ■キーワード■ 低炭素社会,自動車CO2排出量,シナリオ分析 ■ 所 属 ■ 1) 筑波大学大学院 教授 2) 環境デザイン工学科 准教授 3) 大学院環境学研究科博士前期課程 4) 大学院環境学研究科博士前期課程 ■ 掲載先 ■ 環境システム論文集,Vol.37,2009 査読:あり,言語:日本語 地域区分 対現状 (2005年)比 対BAU (2035年)比 中心部 44.77% 38.13% 郊外部 19.26% 40.52% 中山間部 70.22% 55.67% 総計 28.72% 39.38% 0 100 200 300 400 500 600 現状 (2005年) BAU (2035年) シナリオ 導入後 0.0 0.4 0.8 1.2 1.6 総C O 2排出 量 (t -C O 2/ 日 ) 一人当たりC O 2 排出 量( kg -CO 2/日 ) 削減後の CO2排出量 2)~4)地域構造施策 6)低燃費車普及 5)ガソリン価格の上昇 一人当たり 0 300 600 900 1200 1500 1800 現状 (2005年) BAU (2035年) シナリオ 導入後 0.0 0.4 0.8 1.2 1.6 総CO 2排出量 (t -C O 2/日 ) 削減後の CO2排出量 2)~4)地域 構造施策 6)低燃費車普及 5)ガソリン価格 の上昇 一人 当たり C O 2排出量( k g-CO 2 /日 ) 一人当たり 0 30 60 90 120 150 180 現状 (2005年) BAU (2035年) シナリオ 導入後 0.0 0.4 0.8 1.2 1.6 総 C O 2排出量 (t -CO 2/日 ) 一人当た りCO 2 排出量 (k g -C O 2/日 ) 削減後の CO2排出量 6)低燃費車普及 5)ガソリン価格の上昇 2)~4)地域 構造施策 一人当たり
ドライバーの街路空間イメージを利用した通過交通の抑制に関する研究
Study on Restraining the "Rat-run" Considering the Road Space Image of Driver橋本成仁1),谷口 守2),吉城秀治3)
HASHIMOTO Seiji1), TANIGUCHI Mamoru2) and YOSHIKI Syuji3) ■ 概 要 ■ 都市部を中心に幹線道路の渋滞回避のために住宅地内の道路へ流入する「抜け道」交通が各地で見ら れ,沿道住民の生活環境の悪化を招いている.この対策として,道路ネットワークの改良などの抜本的 な手法もあるが,抜け道として利用されている道路の改良により,ドライバーの意識を変更するという 方法も考えられる.本研究では,ドライバーの意識に着目し,抜け道利用されにくい街路空間とはどの ようなものであるのかということを検討した.岡山市内での意識調査から,ドライバーの認識に道路の 物理的空間要素のどの要素が大きく影響してくるかということも明らかになった.この結果は道路空間 の改良によってドライバーの抜け道利用をしても良いという意識をコントロールし得ることを示唆し ており,道路空間の整備による抜け道交通抑制の可能性を示したものであると考えられる. 9.6% 90.4% 87.1% 79.4% 12.9% 20.6% 73.2% 26.8% 66.0% 34.0% 64.6% 35.4% 61.9% 38.1% 48.8% 51.2% 53.9% 46.1% 40.0% 60.0% 38.7% 61.3% 38.7% 61.3% 24.8% 75.2% 21.9% 78.1% 19.3% 80.7% 13.2% 86.8% 裏通り 表通り 0% 50% 100% 0% 50% 100% 図-1 表通りと裏通りの判断割合 -0.751 -0.152 0.356 0.527 -0.671 0.612 0.568 -0.324 0.330 0.065 -0.062 0.094 -0.007 0.460 -0.560 -0.137 0.151 -0.049 0.047 0.181 -0.184 -1.0 -0.5 0.0 0.5 1.0 8.5m 11m 13.5m 16m 無し 白色点線 黄色実線 路側帯 歩道 通常 赤 無し ボラード 柵 低木植樹帯 無し 有り 低層住宅 中高層住宅 低密 高密 _ _ _ _ _ _ _ _ _ _ _ サンプル数 1643 相関比 .249 表通り 裏通り 裏通り -0.648 やや裏通り -0.467 やや表通り 0.447 表通り 0.581 軸の重心 道路幅員 中央線 歩道部分 路側・歩道 カラー 歩車分離 施設 街路樹 沿道 立地状況 沿道 立地密度 図-2 通りの判断に影響を及ぼす要因分析結果 ■キーワード■ 表通り,裏通り,通過交通,ドライバー意識 ■ 所 属 ■ 1) 環境デザイン工学科 准教授 2) 筑波大学大学院 教授 3) 大学院環境学研究科博士前期課程 ■ 掲載先 ■ (社)日本都市計画学会発行,都市計画論文集,Vol. 44,No. 3,pp.67-72,2009 査読:あり,言語:日本語
岡山市内国道53号における自転車道整備効果の検証
A Survey on the Effects of Bicycle Track Provision at the Route 53 in Okayama City阿部宏史1),崎大樹2),岩元浩二3),冨田修一4)
ABE Hirofumi1), SAKI Taiju2), IWAMOTO Koji3) and TOMITA Syuichi4) ■ 概 要 ■ 本研究では,2006 年 9 月に完成した岡山市内国道 53 号線の分離型自転車道を対象として,整備前後 の時点において,通行状況のビデオ撮影,及び通行環境の改善に関するアンケート調査を実施した.ま た,調査結果に基づいて,通行状況の変動と通行環境に対する評価意識の変化から,自転車道の整備効 果,並びに今後の改善課題を検討した.整備効果に関しては,自転車,歩行者ともに通行速度が向上し たこと,通行スペース,路面・段差状況等の通行環境の改善に関しては,評価意識に大きな改善が見ら れたことが明らかになった.一方,今後の整備課題としては,自転車道遵守率の改善,出入り車両,自 転車通行量等の交通処理に関する問題が残されていることが明らかになった. 写真-1 自転車道整備状況 写真-2 自転車道整備状況 図-1 自転車利用者の平均評価点と変動 (運動公園前~岡大入口) 図-2 自転車利用者の平均評価点と変動 (清心町~運動公園前) ■キーワード■ 自転車交通行動,歩行者,自転車交通計画 ■ 所 属 ■ 1) 環境デザイン工学科 教授 2) 大学院環境学研究科博士前期課程 3) (株)ウエスコ 4) (株)ウエスコ ■ 掲載先 ■ (社)土木学会,土木計画学研究・論文集,Vol.26,No.4,pp.647-654,2009. 査読:あり,言語:日本語 ビデオカメラ 設置場所 ビデオカメラ 設置場所 0.35 0.14 0.41 0.22 0.03 0.10 0.31 0.75 0.55 0.46 -2.0 -1.0 0.0 1.0 2.0 歩 行 者 通 行 量 自 転 車 通 行 量 通 行 ス ペ ー ス 段 差 ・ 路 面 状 況 見 通 し 出 入 り 車 両 夜 間 照 明 歩 行 者 の 接 近 自 転 車 の 接 近 全 体 的 満 足 度 満 足← や や 満 足← ど ち ら で も な い→ や や 不 満→ 不 満 平 均 評 価 点 -2.0 -1.0 0.0 1.0 2.0 平 均 評 価 点 の 変 動 平均評価点の変動 平均評価点(整備前) 平均評価点(整備後) 0.38 0.19 1.26 1.24 0.73 0.35 0.47 1.31 1.04 1.18 -2.0 -1.0 0.0 1.0 2.0 歩 行 者 通 行 量 自 転 車 通 行 量 通 行 ス ペ ー ス 段 差 ・ 路 面 状 況 見 通 し 出 入 り 車 両 夜 間 照 明 歩 行 者 の 接 近 自 転 車 の 接 近 全 体 的 満 足 度 満 足← や や 満 足← ど ち ら で も な い→ や や 不 満→ 不 満 平 均 評 価 点 -2.0 -1.0 0.0 1.0 2.0 平 均 評 価 点 の 変 動 平均評価点の変動 平均評価点(整備前) 平均評価点(整備後)
農林漁業・食品工業・農林関連産業を細分化した産業連関表による地域経済
分析
Regional Economic Analysis Using Input–Output Tables with Segmented Agriculture, Forestry, Fisheries, Food and Related Industries
阿部宏史1),新家誠憲2),藤田真司3),花岡千草4)
ABE Hirofumi1), SHINKE Tomonori2), FUJITA Shinji3) and HANAOKA Chigusa4) ■ 概 要 ■ 農林漁業は,戦後の経済発展による産業構造変化や食糧輸入拡大とともに農林漁業の生産額減少が顕 著となり,最近では,農林漁村地域の衰退,食糧自給率低下に伴う食の安全保障,輸入食品の安全性な どが問題となっている.本研究では,経済産業省が全国 9 地域別に作成している基本表レベルの域産業 連関表を用いて,1975~2000 年の 25 年間・6 時点を対象とする農林漁業・食品工業部門を細分化した 地域産業連関表を作成する.そして,地域産業連関モデルに基づく以下の分析手法を適用し,国内地域 における農林漁業と関連産業の特徴を明らかにするとともに,今後の地域経済の課題を考察した. 図-1 北海道のスカイライン図 図-2 関東のスカイライン図 図-3 農林漁業の域際収支 図-4 食品工業の域際収支 ■キーワード■ 地域産業連関分析,農林水産業,地域経済 ■ 所 属 ■ 1) 環境デザイン工学科 教授 2) 大学院環境学研究科博士前期課程 3) 大学院環境学研究科博士後期課程 4) 大学院自然科学研究科博士後期課程 ■ 掲載先 ■ 日本地域学会発行,地域学研究,第39 巻,第 2 号,pp.283-303,2010. 査読:あり,言語:日本語 自給率 輸入率 移入率 0% 20% 40% 60% 80% 100% 150% 200% 250% 300% 350% 400% 450% 50% 穀 類 い も 豆 類 野 菜 非 食 用 作 物 飼 料 有 機 質 肥 料 農 林 関 係 公 共 事 業 製 材 合 板 チッ プ そ の 他 の 食 料 品 そ の 他 の 飲 料 農 業 サー ビ ス 砂 糖 油 脂 調 味 料 類 そ の 他 の 食 用 作 物 畜 産 素 材 育 林 海面 漁 業 と 畜 畜 産 食 料 品 水 産 食 料 品 め ん パ ン 菓 子 類 精 穀 精 粉 自給率 輸入率 移入率 0% 20% 40% 60% 80% 100% 150% 200% 250% 300% 350% 400% 450% 50% 穀 類 野 菜 飼 料 有 機 質 肥 料 農 林 関 係 公 共 事 業 製 材 合 板 チッ プ そ の 他 の 食 料 品 そ の 他 の 飲 料 砂 糖 油 脂 調 味 料 類 農 産 保 存 食 料 品 果 実 畜 産 と 畜 畜 産 食 料 品 水 産 食 料 品 め ん パ ン ・ 菓 子 類 精 穀 精 粉 -2000 -1000 0 1000 2000 北海道 東北 関東 中部 近畿 中国 四国 九州 沖縄 移 出 超 過 額 十 億 円 1975年 1980年 1985年 1990年 1995年 2000年 -2000 -1000 0 1000 2000 北海道 東北 関東 中部 近畿 中国 四国 九州 沖縄 移 出 額 超 過 率 十 億 円 1975年 1980年 1985年 1990年 1995年 2000年
バブル経済期前後における雇用増加率の地域間格差に関する産業連関分析
Regional Input–Output Analysis of Employment Growth Disparities before and after the Bubble Economy in Japan是友修二1),阿部宏史2),新家誠憲3)
KORETOMO Shuji1), ABE Hirofumi2) and SHINKE Tomonori3)
■ 概 要 ■ 本研究では,わが国における雇用増加の中心的産業が製造業からサービス業に移行し,その過程で雇 用増加率の地域間格差が拡大したことを受けて,「産業構造の変化が雇用増加率の地域間格差に影響を 与えた」との仮説を検証するために,産業業種別の雇用増加率に対する各地域の寄与度の変化とその要 因を時系列で分析した.具体的には,地域産業連関モデルを用いて,バブル経済崩壊前後の 1980 年代 と 1990 年代の 2 期間における雇用誘発の変動要因分析を行い,製造業からサービス業への産業構造変 化が雇用増加率の寄与度に及ぼした影響を実証的に検討した. 図-1 産業業種別就業者数の推移 図-2 全国の雇用増加率と 9 地域別寄与度 図-3 全国雇用増加率に対する製造業の部門別寄与度 図-4 全国雇用増加率に対するサービス業の部門別寄与度 ■キーワード■ 地域産業連関分析,地域雇用分析,地域間格差 ■ 所 属 ■ 1) 大学院環境学研究科博士後期課程 2) 環境デザイン工学科 教授 3) 大学院自然科学研究科博士後期課程 ■ 掲載先 ■ 日本地域学会発行,地域学研究,第39 巻,第 2 号,pp.283-303,2010. 査読:あり,言語:日本語 0 200 400 600 800 1,000 1,200 1,400 1,600 1,800 1960年 1965年 1970年 1975年 1980年 1985年 1990年 1995年 2000年 就 業 者 数 万 人 農林漁業 鉱業 建設業 製造業 電気・ガス・熱供給・水道業 運輸・通信業 卸売・小売業・飲食店 金融・保険業 不動産業 サービス業 公務 分類不能の産業 36.6% 39.6% 14.7% 42.6% 30.1% 43.2% 71.7% 172.0% 164.6% 45.1% 1.4% 72.9% 25.7% 23.4% 44.4% 13.4% 6.0% 14.5% 55.9% 23.0% 3.9% 7.9% -18.6% -8.1% -4.1% 9.5% -21.9% 4.3% 24.3% -0.6% -8.9% -27.4% 9.2% -26.8% 12.2% 10.0% -50% 0% 50% 100% 150% 200% 製 造 業 全 体 食 料 品 ・ た ば こ 繊 維 工 業 衣 服 ・ そ の 他 の 繊 維 製 品 製 材 ・ 木 製 品 家 具 ・ 装 備 品 パ ル プ ・ 紙 ・ 紙 加 工 品 出 版 ・ 印 刷 化 学 製 品 石 油 ・ 石 炭 製 品 ゴ ム 製 品 皮 革 ・ 同 製 品 窯 業 ・ 土 石 製 品 鉄 鋼 製 品 非 鉄 金 属 製 品 金 属 製 品 一 般 機 械 電 気 機 械 輸 送 用 機 械 精 密 機 械 そ の 他 の 製 造 工 業 製 品 サ ー ビ ス 業 全 体 個 人 サ ー ビ ス 業 旅 館 ・ そ の 他 の 宿 泊 所 娯 楽 業 自 動 車 整 備 ・ 駐 車 業 機 械 ・ 家 具 等 修 理 業 物 品 賃 貸 業 情 報 サ ー ビ ス ・ 調 査 ・ 広 告 そ の 他 の 事 業 所 サ ー ビ ス 医 療 業 保 健 ・ 廃 棄 物 処 理 社 会 保 険 ・ 社 会 福 祉 教 育 学 術 研 究 機 関 宗 教 ・ 政 治 ・ 文 化 団 体 全 国 雇 用 増 加 率 ・ 地 域 別 増 加 率 寄 与 度 % 北海道 東北 関東 中部 近畿 中国 四国 九州 沖縄 全国雇用増加率 製造業 サービス業 0.5% 1.2% 0.2% 0.1% 0.1% 2.0% 6.5% 1.2% 0.2% -3.2% -2.0% -0.7% -1.7% -1.6% -3.3% -1.0% -0.7%-0.6% -0.9% 0.8% -0.7% 0.3% 0.0% 0.0% -0.2% 1.3% -0.1% -0.4% -2.0% -0.8%-0.3% -0.9% -0.4%-0.1%-0.4% -0.3%-1.1% -0.9%-0.3% 0.1% -5% 0% 5% 10% 食 料 品 ・ た ば こ 繊 維 工 業 衣 服 ・ そ の 他 の 繊 維 製 品 製 材 ・ 木 製 品 家 具 ・ 装 備 品 パ ル プ ・ 紙 ・ 紙 加 工 品 出 版 ・ 印 刷 化 学 製 品 石 油 ・ 石 炭 製 品 ゴ ム 製 品 皮 革 ・ 同 製 品 窯 業 ・ 土 石 製 品 鉄 鋼 製 品 非 鉄 金 属 製 品 金 属 製 品 一 般 機 械 電 気 機 械 輸 送 用 機 械 精 密 機 械 そ の 他 の 製 造 工 業 製 品 増 加 率 寄 与 度 % 1980年~1990年 1990年~2000年 3.6% 5.8% 13.6% 0.7% 1.3% -0.1% 0.1% 0.6% 2.1% 1.6% 0.7% 2.7% 7.0% 2.8% 1.8% 1.1% 0.2% 1.8% 0.3% 0.0% 6.0% 0.4% 0.6% 0.6% 7.8% 0.7% 3.8% 1.8% -5% 0% 5% 10% 15% 個 人 サ ー ビ ス 業 旅 館 ・ そ の 他 の 宿 泊 所 娯 楽 業 自 動 車 整 備 ・ 駐 車 業 機 械 ・ 家 具 等 修 理 業 物 品 賃 貸 業 情 報 サ ー ビ ス ・ 調 査 ・ 広 告 そ の 他 の 事 業 所 サ ー ビ ス 医 療 業 保 健 ・ 廃 棄 物 処 理 社 会 保 険 ・ 社 会 福 祉 教 育 学 術 研 究 機 関 宗 教 ・ 政 治 ・ 文 化 団 体 増 加 率 寄 与 度 % 1980年~1990年 1990年~2000年
農林漁業・食品工業部門の環境負荷発生構造に関する地域産業連関分析
Regional Input–Output Analysis of the Environmental Burden Induced by Agriculture, Forestry, Fisheries and Food Industries宇都宮裕樹1),阿部宏史2),花岡千草3)
UTSUNOMIYA Hiroki1), ABE Hirofumi2) and HANAOKA Chigusa3)
■ 概 要 ■ 本研究では,エコロジカル・フットプリント(EF)分析の視点を考慮しながら,国及び地域の経済構造 と環境負荷発生の関係を総合的かつ整合的に把握できる産業連関モデルを構築し,農林漁業・食品加工 部門を中心とする国内地域の最終需要や地域間交易が環境負荷発生に及ぼす影響を分析した.また,土 地面積と二酸化炭素排出量の 2 つの指標を用いた分析結果から,土地面積に基づくエコロジカル・フッ トプリント(EF)分析の課題を考察した. 図-1 産業連関分析における EF 概念の説明 図-2 自給仮定土地誘発面積の推移(全国) 図-3 自給仮定二酸化炭素誘発量の推移(全国) 図-4二酸化炭素量に基づく環境負荷収支の推移 ■キーワード■ 地域産業連関分析,地域雇用分析,地域間格差 ■ 所 属 ■ 1) 大学院環境学研究科博士前期課程 2) 環境デザイン工学科 教授 3) 大学院自然科学研究科博士後期課程 ■ 掲載先 ■ 日本地域学会発行,地域学研究,第39 巻,第 4 号, 2010.(印刷中) 査読:あり,言語:日本語 移出 輸出 移入 輸出 地域内消費 地域内での生産量 移出 輸出 移入 輸出 地域内消費 地域内での必要量 0 5 10 15 20 25 30 35 米 麦類 いも ・豆類 野菜 果実 砂糖 原料 作 物 花き ・ 花 木 類 その 他 の 農 作 物 畜産 農業 サ ー ビ ス 育林 素材 特用林産物 漁業 1990年 1995年 2000年 自 給 仮 定 土 地 誘 発 面 積( 万 ㏊) 0 20 40 60 80 100 120 140 160 180 米 麦類 いも ・ 豆 類 野菜 果実 砂糖 原料 作 物 花き ・ 花 木 類 その 他 の 農作物 畜産 農業 サ ー ビ ス 育林 素材 特用林 産 物 漁業 1990年 1995年 2000年 自 給 仮 定 二 酸 化 炭 素 誘 発 量( 万 t‐ c) -60 -40 -20 0 20 40 60 80 100 120 140 北海道 東北 関東 中部 近畿 中国 四国 九州 沖縄 1990年 1995年 2000年 二 酸 化 炭 素 量( 万 t‐ c)
高炉水砕スラグを用いたセメント硬化体の耐硫酸性に関する研究
Resistance to Sulfuric Acid of Cement Hydrated with Blast Furnace Water-cooled Slag藤井隆史1),細谷多慶2),松永久宏3),綾野克紀4)
FUJII Takashi1), HOSOTANI Kazuyoshi2), MATSUNAGA Hisahiro3) and AYANO Toshiki4) ■ 概 要 ■ 本研究は,結合材の一部に高炉スラグ微粉末を用い,細骨材の全量に高炉スラグ細骨材を用いること でモルタルおよびコンクリートの耐硫酸性が向上することを示したものである.高炉スラグ微粉末を結 合材の一部に用い,セメントの使用量を減らすことで,写真-1および写真-2に示されるように,セ メント硬化体周辺に二水石こうを主成分とする白色の膜が残りやすくなる.また,写真-3および写真 -4に示されるように,高炉スラグ細骨材のような非晶質な材料を用いることで,セメント硬化体周辺 に残る二水石こうを主成分とする白色の膜が密実なものになり,モルタルの耐硫酸性が向上することを 示した. OPC60 49.1 m m 38.4 m m 49.1 m m 38.4 m m 38.9 m m 38.9 m m 38.9 m m 38.9 m m OPC30 28.8 m m 28.8 m m 28.8 m m 28.8 m m 28.8 m m 28.8 m m 22.2 m m 22.2 m m 22.2 m m 22.2 m m BB30 40.6 m m 50.9 m m 40.6 m m 50.9 m m 30.8 m m 30.8 m m 30.8 m m 30.8 m m BB60 38.4 m m 53.6 m m 38.4 m m 53.6 m m 37.3 m m 49.1 m m 37.3 m m 49.1 m m Paste Mortar 写真-1 川砂を用いたモルタルの硫酸浸漬試験結果 OPC60 49 .1 m m 38 .4 m m OPC30 28.8 m m 28. 8m m 28.8 m m 28. 8m m BB30 40 .6 m m 50 .9 m m BB60 38 .4 m m 53 .6 m m 55.3 m m 45.2 m m 55.3 m m 45.2 m m 42.0 m m 52.0 m m 42.0 m m 52.0 m m 44.7 m m 55.4 m m 44.7 m m 55.4 m m 44 .8 m m 56 .2 m m 44 .8 m m 56 .2 m m Paste Mortar 写真-2 高炉スラグ細骨材を用いたモルタルの硫酸浸漬 試験結果 写真-3 川砂を用いたモルタルの表層部の断面 写真-4 高炉スラグ細骨材を用いたモルタルの表層部の 断面 ■キーワード■ 高炉スラグ細骨材,高炉スラグ微粉末,二水石こう,エトリンガイト,水酸化カルシウム ■ 所 属 ■ 1) 環境デザイン工学科 助教 2) ランデス(株)本部技術センター 3) JFEスチール(株)スチール研究所 4) 環境デザイン工学科 教授 ■ 掲載先 ■ (社)日本コンクリート工学協会発行,コンクリート工学年次論文集,Vol. 31,No. 1,pp.847-852,2009.7 査読:あり,言語:日本語
Nano-Micro-Macro-Analyses of Transport Phenomena in Kaolinite Clay
CHOI Jung Hae1), ICHIKAWA Yasuaki2) and KAWAMURA Katsuyuki3)
■Summary■
Kaolinite is a common clay mineral. It is a nano-material with a platelet crystalline structure of an Si tetrahedral layer and an Al octahedral layer. In order to analyze the behavior of kaolinite and water, its microscopic structure and material properties must be specified correctly. A Molecular Dynamics (MD) simulation is used for determining the microscale properties of hydrated kaolinite, and these properties are introduced into a multiscale Homogenization Analysis (HA). We previously developed such an MD/HA technique to investigate seepage, diffusion, sorption and consolidation in bentonite clay (cf. Ichikawa, Y. et al. Engineering Geology, 54, 21-31, 1999). We here apply the method to kaolinite clay, to investigate the permeability, diffusion and related similitude law. Obtained results are supported by existing experimental data.
■Key word■
Silicate minerals, quartz, pressure solution, pH, temperature, dissolution rate
■Affiliation■
1) Researcher, Dept. of Environmental and Civil Engineering 2) Professor, Dept. of Environmental and Civil Engineering
3) Professor, Dept. of Earth and Planetary Science, Tokyo Institute of Technology
■Printing■
Int. J. Numer. Analy. Meth. Geomech., Vol.33, pp.687-707.
Refreeing: Full paper, Language: English
Figure 2: A stack of kaolinite crystals
0.8 nm Aluminum octahedral sheet
Silica tetrahedral sheet
Figure 1: Atomic arrangement of a kaolinite crystal
External water
Silicate (Si-O) surface Gibbsite (Al-O) surface 0 1nm
1.00E-06 6.00E-06 1.10E-05 1.60E-05 6 4 1.5
Distance from gibbsite surface [nm] 5.00E-04 1.00E-03 1.50E-03 2.00E-03 2.50E-03 3.00E-03 3.50E-03 Diffusion coefficient Viscosity V isc o si ty [Pa s] D if fu si o n co e ff ic ien t [c m 2/s ] O OH Al Si Aluminum octahedral sheet
Silica tetrahedral sheet
0.8 nm
Figure 3: MD model and distributions of diffusivity and viscosity
Macroscale Problem with periodic micro-structure
X1 1 X1 2 Microscale Problem Ω1f Ω4: macro-domain = X0 2 εX12 = X0 1 εX11 x0 2 x0 1 x1=x0/4 Ω1s Ω1s Ω1f : fluid phase Ω1s : solid phase x1 1 x1 2 Ω4: micro-domain
Figure 4: Multiscale homogenization analysis (HA)
VOF-DEM-FEM Combined Model of the Reef Breakwater Collapse
MAENO Shiro1), BIERAWSKI G. Lechoslaw2) and MAGDA Waldemar2)
■Summary■
A combined model was built of three main modules based on the Volume of Fluid (VOF) method, Discrete Element Method (DEM), and Finite Element Method (FEM). It was proposed to utilize this model to simulate the deformation of the rubble mound and the sandy bed due to surface wave action. The model included the full interaction between wave motion with free surface and replaceable separate particles of the rubble mound. Momentary arrangement of the fluid, particles and resulting permeability was tracked within a domain of time and two-dimensional space by maintaining cyclic data transfer between the three method modules. A new technique of porosity adjustment was presented. The model results were compared to small-scale laboratory test results. Based on the comparison, the VOF-DEM-FEM model appeared to be a promising tool to handle the destruction process of the rubble coastal structures built on a permeable bottom.
-0.05 -0.025 0.0 0.025 -0.025 0.0 0.0 -0.025 -0.025 0.0
(A) Under the wave trough t=9.50 s
0.075 0.05 0.025 0.025 0.025 0.0 0.05 0.025 0.05 0.025 -0.025 0.0
(B) Under the wave crest t=10.20 s Fig. 1 Pressure field at the submerged breakwater A combined model was built of three main modules
(A) Under the wave trough t=9.50 s
(B) Under the wave crest t=10.20 s Fig. 2 Velocity field at the submerged breakwater
■Key word■
VOF-DEM-FEM combined model, reef breakwater, porosity coefficient adjustment
■Affiliation■
1) Professor, Dept. of Environmental and Civil Engineering
2) Faculty of Civil and Environmental Engineering , Gdansk University of Technology
■Printing■
Coastal Engineering Journal, Vol. 51, No. 3, pp.223–242, 2009
A Simple Bayesian Method to Combine Lithofacies Data with Drawdown
Measurements When Calibrating a Groundwater Flow Model
Mitsuru Komatsu1), Christophe C. Frippiat2), Toshihiro Sakaki3) and Tissa H. Illangasekare3)
■Summary■
In this study, we developed a simple Bayesian method to estimate heterogeneous distributions of soil hydraulic conductivity using both lithofacies data and observations associated with flow.
The method was applied to back-estimate the spatial distribution of hydraulic conductivity of a laboratory-scale heterogeneous 3-D synthetic aquifer created in an intermediate scale test tank. The aquifer consisted of five lithofacies, corresponding to five test sands, arranged in a random pattern. Different quantities of synthetic lithofacies data under the form of fictitious borehole logs was generated from the known distribution of the five sands in the synthetic aquifer. Drawdown data were generated in three pumping tests and used to identify five K values. The pumping tests were also simulated numerically in order to provide a series of error-free synthetic hydraulic data sets. The results generally showed that the use of more lithofacies data in the construction of the lithofacies realizations led to an improvement in groundwater flow model prediction accuracy, with a convergence of the estimated K field towards the true K distribution.
Photo 1 Schematic view of the synthetic aquifer configuration and selected properties of the sands.
Figure 2Sample results of a posteriori probability distribution of ln K values of each lithofacies
■Key word■
hydraulic conductivity, heterogeneous distributions, lithofacies data, observation data, bayesian method
■Affiliation■
1) Associate professor, Dept. of Environmental and Civil Engineering .
2) Department of Civil and Environmental Engineering, Université catholique de Louvain , Louvain-la-Neuve, Belgium.
3) Environmental Science and Engineering, Colorado School of Mines, Golden, CO, USA.
■Printing■
AGU Fall meeting, Poster No. H43F-1088, December 14-18, San Francisco, CA, 2009.
Resistance of Concrete with Granulated Blast Furnace Slag Sand to Sulfuric Acid
Attack
AYANO Toshiki1), MATSUNAGA Hisahiro2), FUJII Takashi3) and SAKATA Kenji4)
■Summary■
This paper presents that granulated blast furnace slag sand can improve the resistance of concrete to sulfuric acid attack. When a part of cement is replaced with ground granulated blast furnace slag, and granulated blast furnace slag sand is used for sand, resistance of concrete to sulfuric acid attack can be improved more. Because, a coating of gypsum is formed on the mortar or concrete. A coating of gypsum is strong enough to prevent the corrosion by sulfuric acid attack.
80.0 90.0 100.0 110.0 120.0 0 14 28 42 56 R e la ti ve wi g h t - %
Soaking time - days
BB60
OPC30
BB30
OPC60
Fig 1 Resistance of cement paste to sulfuric acid
(a) (e) (d) (c) Gypsum(stiff) Ettringite Cement hydrate H2SO4 (b) Gypsum (stiff) H2SO4 Cement hydrate (a) Cement hydrate H2SO4 (d) Gypsum(stiff) Ettringite Cement hydrate Gypsum(paste) H2SO4 Fe-layer (e) Ettringite Ettringite Cement hydrate Gypsum(stiff) Gypsum(paste) (f) Cement hydrate Gypsum(paste) H2SO4 Lapse of time Wei ght c hange (c) (a) (d) (c) (e)
Photo 1Corrosion of cement paste by sulfuric acid attack
300μm 300μm 50μm 300μm 300μm 300μm300μm 50μm 50μm Before After
Photo 2 Surface of river sand soaked in calcium hydroxide solution
300μm 300μm 50μm 300μm 300μm 300μm300μm 50μm 50μm Before After
Photo 3 Surface of granulated blast furnace slag sand soaked in calcium hydroxide solution
Air-cooled BFS stone 105.1mm 95.5mm Air-cooled BFS stone Air-cooled BFS stone 105.1mm 95.5mm 105.1mm 95.5mm Limestone 105.3mm 96.6mm Limestone Limestone 105.3mm 96.6mm 105.3mm 96.6mm Sandstone 104.4mm 96.3mm Sandstone Sandstone 104.4mm 96.3mm 104.4mm 96.3mm
Photo 4Cross section and surface of concrete with each gravel after immersing in sulfuric acid solution
■Key word■
ground granulated blast furnace slag, granulated blast furnace slag sand, gypsum, ettringite, gypsum
■Affiliation■
1) Professor, Dept. of Environmental and Civil Engineering 2) Steel Research Laboratory, JFE Steel Corporation
3) Assistant Professor, Dept. of Environmental and Civil Engineering 4) Professor, Emeritus of Okayama University
■Printing■
Proceedings of ConMat'09 4th International Conference on Construction Materials: Performance, innovations and Structural Implications, Vol. 2, pp.921-926, 2009.8
Household solid waste generation and characteristic in a Mekong Delta city,
Vietnam
THANH Nguyen Phuc1), MATSUI Yasuhiro2) and FUJIWARA Takeshi3)
■Summary■
This study was undertaken to evaluate the quantity and composition of household solid waste to identify opportunities for waste recycling in Can Tho city, the capital city of the Mekong Delta region in southern Vietnam. A one-month survey of 100 households was conducted during February–March 2009. Household solid waste (HSW) was collected from each household and classified into 10 physical categories and 83 subcategories. The average household solid waste generation rate was 283.10 g per capita per day. The compostable and recyclable shares respectively accounted for 80% and 11%. The authors also analyzed the relations between some socioeconomic factors and household solid waste generation rates by physical categories and subcategories. The household solid waste generation rate per capita per day was positively correlated with the population density and urbanization level, although it was negatively correlated with the household size. The greenhouse gas baseline emission was also calculated as 291.87 g (CO2 eq.) per capita per day from biodegradable components. The
recycling potential of HSW and the household habits of recyclable waste discharge were also evaluated. More than 80% of respondents answered that they kept recyclable materials for sale, excluding glass bottle (62%) and plastic packaging and bags (39%). The results and the methodology of this waste composition survey are expected to be useful for decision-makers, authorities, and planners of municipalities to develop 3R promotion programs.
■Key word■
Household solid waste, Waste composition analysis, Waste generation rate, Recyclable waste, Correlation analysis
■Affiliation■
1) PhD. Candidate of Graduate School of Environmental Science 2) Associate Professor, Solid Waste Management Research Center 3) Professor, Solid Waste Management Research Center
■Printing■
Proceedings of the 20th Annual Conference of The Japan Society of Material Cycles and Waste Management (JSMCWM), pp 583-584, 2009.9
Refreeing: Nothing, Language: English
Table 1 HSW generation rate by physical categories Waste generation rate Categories % Average SD Plastic 6.37 18.04 11.35 Paper 4.73 13.39 17.18 Food waste 84.18 238.31 106.78 Rubber and 0.11 0.31 1.05 Grass and Wood 1.91 5.40 10.65
Textile 0.29 0.83 2.40
Metal 0.76 2.15 2.40
Glass 1.03 2.92 4.60
Ceramic 0.10 0.29 1.11
Miscellaneous 0.52 1.47 11.40
Satellite Observations of Decadal Scale CO
2Fluxes over Black Spruce Forests in
Alaska Associated with Climate Variability
DATE Takafumi1), UEYAMA Masahito2), HARAZONO Yoshinobu2), OTA Yuji1), IWATA Toru3) and
YAMAMOTO Susumu4)
■Summary■
We improved the satellite-based empirical model (Kitamoto et al., 2007) by adding additional effective parameters on vapor pressure deficit (VPD) and photosynthesis, and estimated the CO2 budget within black
spruce forests in Alaska. In the stand scale validation, our modified model successfully reproduced observed gross primary productivity (GPP), ecosystem respiration (RE), and net ecosystem exchange (NEE) by the eddy covariance measurement. The 10-day average of model output was highly correlated with observed GPP (r2=0.9), RE (r2=0.9), and NEE (r2=0.7).
We used the modified model to estimate regional GPP, RE, and NEE of black spruce forests over Alaska from 1982 and 2003 by using normalized difference vegetation index (NDVI) and climate data. Estimated regional averages of GPP, RE, and NEE were 2,172, 2,008, and –164 g CO2 m-2 y-1 during the past 22 years. Our model
analysis showed that GPP was mainly affected by spring air temperature, whereas RE was affected by summer air temperature, indicating that the sink strength of the black spruce forests was controlled by the seasonality in air temperature between spring and summer. Path analysis enforced the notation that spring warming increased the CO2 sink, but summer warming decreased the sink.
Calculated data Observed data of 10-day averaged Observed data 0 5 10 15 20 -15 -10 -5 0 5 1 2 3 4 5 6 7 8 9 10 11 12 0 5 10 15 20 25 Month, 2003 GP P ( g C O2 m -2 d -1 ) R E ( g CO2 m -2 d -1 ) NE E ( g C O2 m -2 d -1 ) (a) (b) (c) A B A B B’ B’ Calculated data Observed data of 10-day averaged Observed data 0 5 10 15 20 -15 -10 -5 0 5 1 2 3 4 5 6 7 8 9 1010 1111 1212 0 5 10 15 20 25 Month, 2003 GP P ( g C O2 m -2 d -1 ) R E ( g CO2 m -2 d -1 ) NE E ( g C O2 m -2 d -1 ) (a) (b) (c) A B A B B’ B’
Fig. 1 Seasonal variations of GPP, RE and NEE of the black spruce forest comparing between calculated (open circle) and observed (closed circle) at the tower site in 2003.
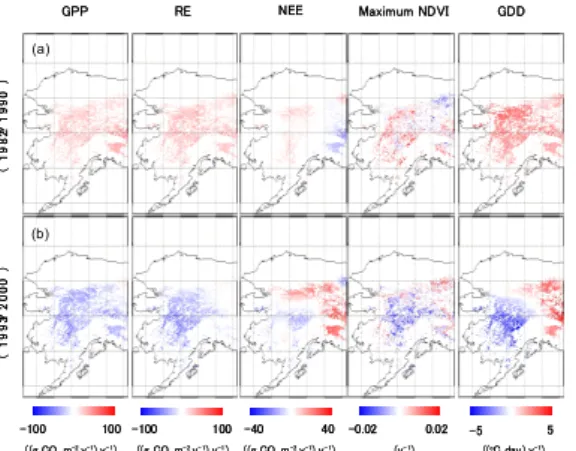
GPP RE NEE Maximum NDVI GDD
-100 100 -100 100 -40 40 -0.02 0.02 -5 ((g CO2 m-2 y-1) y-1) ((oC day) y-1) 5 ( 19 8 2 ? 1 990 ) ( 1 9 9 3 ? 2 000 ) (a) (b) (y-1) ((g CO2 m-2 y-1) y-1) ((g CO2 m-2 y-1) y-1)
GPP RE NEE Maximum NDVI GDD
-100 100 -100 100 -40 40 -0.02 0.02 -5 ((g CO2 m-2 y-1) y-1) ((oC day) y-1) 5 ( 19 8 2 ? 1 990 ) ( 1 9 9 3 ? 2 000 ) (a) (b) (y-1) ((g CO2 m-2 y-1) y-1) ((g CO2 m-2 y-1) y-1)
Fig 2 Spatial distributions of slope of linear trend of GPP, RE, and NEE of the black spruce forests and those of inputs of maximum NDVI and GDD.
■Key word■
Alaska, AVHRR, black spruce forests, CO2 fluxes, high latitude warming
■Affiliation■
1) Graduate School of Environmental Science, Okayama University 2) International Arctic Research Center, University of Alaska, Fairbanks 3) Associate professor, Dept. of Environmental and Civil Engineering 4) Professor, Dept. of Environmental and Civil Engineering
■Printing■
Journal of Agricultural Meteorology, 65, Vol. 1, pp.47-60, 2009.3