Nagoya City University Academic Repository
学 位 の 種 類 博士 (理学)
報 告 番 号 乙第1870号
学 位 記 番 号 論 第 10 号
氏 名 WAHYU ENDRA KUSUMA
授 与 年 月 日 平成 28 年 12 月 8 日
学位論文の題名
Molecular phylogeny and historical biogeography of the Indonesian freshwater fish Rasbora lateristriata species complex (Actinopterygii: Cyprinidae)
論文審査担当者 主査: 熊澤 慶伯
名古屋市立大学 博士学位論文
Molecular phylogeny and historical biogeography of
the Indonesian freshwater fish Rasbora lateristriata
species complex (Actinopterygii: Cyprinidae)
2016 年
Wahyu Endra Kusuma
Abstract
Indonesia is one of megadiverse countries that hold a huge number of world’s biodiversity. Indonesia is a home for more than 1200 species of freshwater fish. Owing to human activities, this biodiversity is under serious threats. Due to their inability to disperse through non-freshwater environments, freshwater fish are highly vulnerable to pollution and environmental changes. Basic scientific information on, e.g., taxonomy, phylogeny, ecology, and genetic diversity should be urgently collected before they disappear.
Small freshwater fishes in genus Rasbora (87 valid species) are distributed in a large geographical area, ranging from western India to Lesser Sunda Islands of Indonesia, as far as Lombok and Sumbawa Islands. Among them, 66 species occur in Indonesia. Rasbora
lateristriata was described from Java Island but its taxonomy, phylogeny, and distributional
boundary have not been fully studied. This species occur in both western (Java and Bali Islands) and eastern (Lombok and Sumbawa Islands) sides of Wallace’s Line, a geographical barrier between Indomalaya Ecozone in the west with fauna of the Asian origin and
Australasia Ecozone in the east with those of the Australian origin. When and how this
species crossed Wallace’s Line is one of the biggest enigmas in the historical biogeography of this region. Rasbora baliensis was described as a species endemic to Balinese lakes but its taxonomic status has been controversial in relation to R. lateristriata.
I collected rasbora samples from 47 freshwater localities of Java and five neighboring Islands, which included 236 individuals assignable to R. lateristriata or R. baliensis. I
extracted DNA from several individuals representing each locality, amplified a part of 4 genes (mitochondrial COI and Cytb genes and nuclear RAG1 and opsin genes), and sequenced them. These genes were also sequenced for a representative individual of other Rasbora species that I collected. Molecular phylogenetic analyses were conducted with these DNA sequences and those obtained from public databases for additional species. I also conducted
morphological analyses with many meristic and morphometric characters, including ones that were used to describe R. baliensis by Brittan (1954).
Molecular analyses using four genes, as well as morphological analyses featuring the body color pattern consistently supported that the currently recognized R. lateristriata forms a species complex including at least four major lineages that possibly represent different
species. In one of the major lineages, Balinese individuals clustered tightly with those from East Javanese, Lombok and Sumbawa localities, calling for taxonomic revision on R.
baliensis. The other three major lineages occur in distinct regions of central, west-central, and
western Java and they can be clearly discriminated by the combination of melanophore pigment patterns in the basicaudal blotch and the supra anal pigment.
Molecular phylogeny of this study suggested west-to-east divergences of the R.
lateristriata species complex. R. lateristriata likely had an origin in Sumatra or western parts
of Java and then migrated to the east before it crossed Wallace’s Line, colonizing Lombok and Sumbawa Islands. Based on the relaxed-clock Bayesian estimation of divergence times using the nuclear gene sequences, the divergences of this species complex in Java Island probably occurred from the late Miocene to Plio-Pleistocene. The dispersal over Wallace’s Line occurred very recently (less than five hundred thousand years ago) either naturally or by human introduction.
In conclusion, the present study revealed some hidden biodiversity on Rasbora fish in Java, provided new molecular and morphological evidence to revise the taxonomy of R.
lateristriata and R. baliensis, and proposed a new hypothesis on the origin and migrational
pathway of the R. lateristriata species complex. As their natural habitats are rapidly
deteriorated by human activities, many freshwater fish species other than the rasboras await molecular and morphological investigations. As demonstrated in this study, multidisciplinary approaches by field sampling, morphological investigations, molecular experiments, and computational analyses will be effective to tackle complex evolutionary issues and provide basic scientific knowledge necessary to design conservation plans on Indonesian fauna.
Glossary of specialized terms
Bayesian method: a method using Bayesian principle for estimating posterior probabilities of phylogenetic trees based on observed molecular data under a particular model of sequence change and its optimized parameters. Markov chain Monte Carlo (MCMC) process is usually employed to heuristically search for better trees in multi-dimensional space of trees and parameters. MrBayes is a program for phylogenetic inference which performs the Bayesian analysis
Biodiversity (Biological diversity): variability among living organisms, including plants, animals and microbes. The biodiversity includes species diversity, genetic diversity within species, and ecosystem diversity
Bootstrap: a procedure to assess the precision in estimating the phylogenetic tree by resampling a random subset of the original data matrix (DNA sequences)
Clade (monophyletic group): a group of organisms (taxa) that include a common ancestor and all descendants of that ancestor
Conspecific: an organism belonging to the same species
Cryptic species: two or more species with very similar morphological appearance (and thus classified into a single species conventionally) but are genetically distinct in the species level
Haplotype (haploid genotype): a group of genes within a chromosome of an organism which is inherited from a single parent. Mitochondrial DNA genotype is sometimes called a haplotype because mtDNA inherits maternally only from a mother to her children Historical biogeography: a study of species distributions in a geographical region through the
geological time, elucidated by the phylogenetic study and distribution information Lineage sorting: the random process of fixation of gene lineages along a species lineage Maximum likelihood: the maximum likelihood method in phylogenetic analyses infers the
maximum likelihood tree that has the highest probability of realizing observed molecular data under a particular model of sequence change and its parameters. One of the popular softwares to perform phylogenetic inference based on the maximum likelihood criterion is GARLI (Genetic Algorithm for Rapid Likelihood Inference) MEGA (Molecular Evolutionary Genetic Analysis): a software package for conducting
various tasks in molecular evolutionary studies, e.g., sequence alignment, inferring phylogenetic trees, estimating rates of molecular evolution, calculating genetic distances and testing evolutionary hypotheses
Meristic: countable traits that can be used for identifying or describing a species, e.g., number of fins, number of scales or number of gills
Morphometric: measurable or quantitative traits, e.g., size, distance or proportion in morphological characters
Node: a connecting point in the phylogenetic tree, which represents a common ancestor of descendants
Outgroup: an outgroup in phylogenetic analyses is a group of taxa (genes or organisms) that can be used as a reference to determine the root position of ingroup taxa and infer the evolutionary direction of character changes (i.e., ancestral vs. derived characters)
Phylogeny (phylogenetic tree): is a diagrammatic hypothesis about the evolutionary relationships of a group of organisms or genes
Phylogeography: a study concerned with the principles and processes governing the geographic distributions of genealogical lineages, especially those within and among closely related species
Polymerase Chain Reaction (PCR): a technique in molecular biology to amplify a segment of DNA into multiple copies
Quaternary glaciation: a cooling event in Quaternary period when the earth experienced extreme cooling and the ice sheet was expanded globally. The Quaternary glacial maxima appeared periodically from 2.58 million years ago to 11,000 years ago
Species complex: a group of closely related species with very similar morphological appearance, so that the species delimitation between them is obscure
Sympatric: a distributional state of multiple organisms occurring within a locality or an area Taxon (taxa in plural): a taxonomic group or unit, a group of one or more populations of an
organism or organisms seen by taxonomists to form a unit Topology: a branching pattern of a phylogenetic tree
Type locality: a location where the designated type specimen was originally collected
Type specimen: is particular organismal individuals to which the scientific name of a species was permanently attached according to the description based on these specimens. Holotype is a main specimen which is designated in the original description of a species by the original author. Paratype refers to several additional specimens designated together with the holotype. Usually, a taxonomist describes new species by observing several specimens. One specimen is assigned to the holotype and the rest is designated as the paratype
Wallace’s Line: is a hypothetical faunal boundary which separates Asian and Australasian faunas with different origins. Wallace’s Line runs through the Lombok Strait between Bali and Lombok Islands and through the Makassar Strait between Borneo and Sulawesi Islands in Indonesia
Table of Contents
Chapter 1: Introduction ... 1
1.1 Indonesia: a megadiverse country ... 1
1.2 Threats to Indonesian biodiversity ... 4
1.3 Modern approaches for studying the biodiversity ... 6
1.4 Indonesian freshwater fishes: rasboras ... 8
Chapter 2: Material and Methods ... 13
2.1 Specimen collection ... 13
2.2 DNA amplification and sequencing ... 17
2.3 Phylogenetic analyses ... 19
2.3.1 Analysis of mitogenomic sequences ... 19
2.3.2 Interspecies phylogenetic analyses ... 19
2.3.3 Analyses within the R. lateristriata species complex ... 24
2.4 Genetic divergence estimation ... 24
2.5 Divergence time estimation ... 24
2.6 Historical biogeography reconstruction and haplotype network analysis ... 26
2.7 Morphological analyses ... 26
Chapter 3: Results ... 29
3.1 Collection of specimens ... 29
3.2 Phylogenetic positions of R. lateristriata and R. aprotaenia revealed using mitogenome sequences ... 29
3.3 Phylogenetic position of the R. lateristriata species complex using multilocus gene sequences ... 33
3.4 Phylogenetic relationships within the R. lateristriata species complex ... 38
3.5 Molecular divergences between clades ... 44
3.6 Estimation of divergence times ... 44
3.7 Reconstruction of historical biogeography ... 48
3.8 Reconstruction of haplotype network ... 49
3.9 Analysis of morphological characters ... 51
Chapter 4: Discussion ... 57
4.1 Phylogenetic position of the R. lateristriata species complex ... 57
4.2 Taxonomic status of R. baliensis ... 58
4.3 Cryptic species ... 60
4.4 Evolution of body color patterns ... 61
4.5 Historical biogeography ... 64
Chapter 5: Conclusions and Future Prospects ... 71
Acknowledgments ... 74
References ... 76
List of scientific publications ... 88
Chapter 1: Introduction
1.1 Indonesia: a megadiverse country
Biological diversity or “biodiversity” was defined by United Nations of Environment Programme as the variability among living organisms from all sources including terrestrial, marine and other aquatic ecosystems and the ecological complexes of which they are part, which includes the species diversity, genetic diversity, and ecosystem diversity (UNEP, 1992). Understanding the biodiversity is certainly related to the need of knowing fundamental issues, e.g., how many living organisms (species) currently inhabit our planet. There is no certain number on how many species are on earth and the comprehensive view on the global biodiversity is far from complete. Several researchers proposed an approximate number of global biodiversity ranging from 3 to 100 million species (Hamilton et al., 2010; May, 2010). More recently, Mora et al. (2011) suggested a more precise number (8.7 million eukaryotic species) from which only 1.2 million have been successfully described as valid species. In other words, >85% of the earth’s species are unknown.
Fig. 1. Seventeen megadiverse countries based on the diversity and number of endemism of higher plants and vertebrates as proposed by Mittermeier et al. (1997). Indonesia was placed in the second position after Brazil (see Table 1). The image was obtained from Mittermeier et
More than 70% of the above-mentioned earth’s biodiversity concentrate on 17 countries known as “Megadiverse Countries” (Mittermeier, 1988) (Fig. 1). A megadiverse country can therefore be regarded as a country that holds a large portion of earth’s species. To be
classified as a megadiverse country, a country must hold two important criteria. First, a country must have more than 5000 plant species that are considered to be endemic. Second, a country must have marine ecosystem within its border (Mittermeier et al., 1997). Indonesia unquestionably is extremely rich in biodiversity. Indonesia is also known as an archipelagic island country. This country is a home to ~ 37000 higher plant species (~18500 of them are endemic species) and more than 7000 vertebrates species (~2100 species are endemic), thus being as one of the megadiverse countries (Table 1).
The next question is, what makes Indonesia possess huge biodiversity? Indonesia is an archipelagic country located in an intriguing geographical location. This country includes multiple ecozones: Indomalaya Ecozone in the west with fauna of the Asian origin and Australasia Ecozone in the east with those of the Australian origin (Wallace, 1860; Metcalfe et al., 2001). Wallacea (Sulawesi, Lombok, Sumbawa, Flores and other islands) is situated in the middle between Sundaland (the Malay Peninsula, Sumatra, Borneo, Java and Bali) and Near Oceania including Australia and New Guinea (Monk et al., 1997; Hall, 2009; Hall et al., 2011). Sundaland is characterized by shallow depth (less than 200 m) in most of the area with Wallace’s Line as an eastern boundary (Woodruff, 2003; Hall and Morley, 2004; Hall, 2008). These geographical regions have long been associated with complex geological,
biogeographical, climatic and environmental histories. The unique and complex features of this geographic region contribute to the high species richness and endemism of its biota (Woodruff, 2003, 2010; Lohman et al., 2011; de Bruyn et al., 2014).
1.2 Threats to Indonesian biodiversity
Although Indonesia holds a significant proportion of world’s biodiversity, its
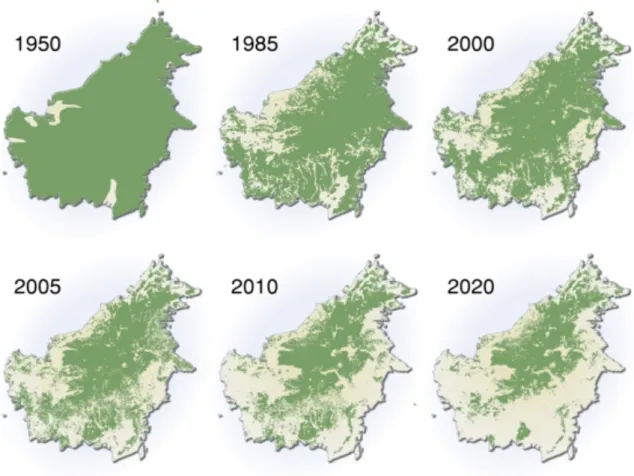
biodiversity is currently under serious threats owing to human activities and/or environmental change in an unprecedented speed. High economic growth in Indonesia is often associated with the high rate of biodiversity loss. Increasing numbers of human populations and their economic activities lead to the loss of biodiversity in all the three categories of its definition (species, gene and ecosystem) through, e.g., habitat degradation by exploitation, pollution and climatic change, overfishing (overhunting), and introduction of alien and invasive species (Groom, 2005). For example, a century ago 90% of Borneo Island was covered with tropical rainforests (Fig. 2). Since 1997, one million ha of Indonesian rainforests have been destroyed every year (World Bank, 2001).
Fig. 2. A map showing the speed of deforestation in Borneo Island. The image is available under permission from GRID-Arendal (http://www.grida.no/graphicslib/detail/extent-of-deforestation-in-borneo-1950-2005-and-projection-towards-2020_119c).
Recent data by International Union for Conservation of Nature (Baillie et al., 2004) showed high numbers of threatened species in Indonesia. In mammals, there are 146 threatened species and 88 species of them are endemic. In birds, among 119 threatened species, 69 are endemic. In amphibians and turtles, the numbers of threatened species and endemic threatened species are 33/23 and 24/4, respectively. In addition, Indonesian
government, through the Government Regulation of the Republic Indonesia No. 7/1999 (PP No.7/1999), identified 294 species that should be prioritized for conservation. Therefore, it is not surprising that Indonesia is categorized as one of the biodiversity hotspots with high abundance of endemic species and considerable loss of habitats (Myers et al., 2000). If there are no effective conservation actions, the biodiversity crisis in this country will be
unrecoverable in future.
Among vertebrate groups (e.g., mammals, birds, amphibians, turtles and marine fishes), freshwater fishes are considered to be the most endangered. Rates of biodiversity loss or extinction in freshwater fish are greater than those in other animal groups and this makes conservation actions in freshwater fish become a priority (Burkhead, 2012; Reid at al., 2013). There are at least five major threats to global freshwater biodiversity: overexploitation, water pollution, flow modification, degradation of habitat, and invasion of exotic species (Dudgeon et al., 2006). What causes freshwater fish to have higher rates to extinction? Freshwater fish is a water-dependent organism with the limitation of dispersal constrained only within and among drainages. Habitat isolation and dispersal limitation for a long period may lead to a speciation event. In one hand, this situation is responsible for the high biodiversity and endemism of freshwater fish. On the other hand, freshwater fish become highly vulnerable to pollution and environmental change (Cambray and Bianco, 1998; Olden at al., 2010). A population of freshwater fish may be wiped-out when its environment is disrupted by pollution because of the inability to disperse through non-freshwater environments.
Basic scientific information on, e.g., taxonomy, phylogeny, ecology, and genetic
diversity is important for designing conservation management for freshwater fish. In addition, historical biogeography illustrates the evolutionary history of a species on how past
environmental and/or geological events influenced its contemporary distribution.
Understanding how a species evolved and survived in the past in response to environmental changes is also informative to predict its future sustainability (Avise, 2000; Olden et al., 2010). As another example, population genetic studies play an important role in developing effective conservation plans. Populations with low genetic diversity will be under a high risk of extinction (Frankham, 2003, 2005).
Unfortunately, very few above-mentioned studies have been conducted in Indonesia so far. As Indonesian biodiversity is decreasing in an enormous speed, many species are waiting for the basic scientific research and subsequent conservation actions to ensure their
sustainability. Otherwise, they may become extinct before we are aware of their existence. Especially, basic scientific research on Indonesian freshwater fish must be conducted as soon as possible.
1.3 Modern approaches for studying the biodiversity
The basic but very important aspect for describing the biodiversity is how to accurately recognize taxonomic status of a species. Most of the taxonomic information have been obtained based on morphological characters. In fishes, a species can be distinguished from its congeners (closely related organisms within the same genus) using either measurable
(morphometric) or countable (meristic) characters or combination of them. However, in some cases, morphology-based approaches fail to distinguish individuals that have very similar morphological appearance but actually belong to separate species (cryptic species). For example, a morphologically similar Cuban freshwater fish Caribbean gambusia (Gambusia
molecular analysis (Lara et al., 2010). In addition, the morphology-based approaches are time-consuming in general and may be susceptible to misleading conclusions due to
homoplasious or adaptive character changes in morphology. A recent trend is therefore to use molecular approaches together with morphological ones in investigating taxonomic and/or phylogenetic status of a species (Hebert et al., 2003; Hebert and Gregory, 2005; Ward et al., 2005).
DNA is a heritable material and a blueprint for making all organisms. The DNA sequence varies between individuals in a species, as well as between species. Based on an assumption that the degree of difference in DNA sequence between taxa (molecular
divergence) reflects their relatedness, we can estimate how close their relationship is. If two taxa have very similar DNA sequences, it implicates that they are closely related with each other and their direct common ancestor diverged very recently. In contrast, more distantly related organisms in phylogeny will show higher molecular divergences as a consequence of more base substitutions on each lineage after speciation. Phylogenetic relationships among species can be inferred through a phylogenetic analysis using molecules (DNA or protein) and/or their morphological traits (Nei and Kumar, 2000; Avise, 2004). A result of the phylogenetic analyses is a tree-like pattern called a phylogeny or a phylogenetic tree, i.e., a diagrammatic hypothesis that depicts evolutionary relationships among organisms under study.
Molecular phylogenetic trees can be constructed by several methods involving computational analyses: e.g., neighbor joining method (Saitou and Nei, 1987), maximum parsimony method (Edwards and Cavalli-Sforza, 1963), maximum likelihood method (Felsenstein, 1981) and Bayesian method (Rannala and Yang, 1996). In recent years with highly developed computing environments, maximum likelihood and Bayesian methods have been preferred because their conclusions are based on explicit principles for choosing the best tree under certain models and parameters (reviewed in Yang and Rannala, 2012). The
maximum likelihood method is a method for inferring a tree that maximizes the probability of realizing the observed molecular data under a specific model of base substitution and its optimized parameters while Bayesian method finds topological relationships with the highest posterior probability based on the observed data, model and parameters (Felsenstein, 1981; Rannala and Yang, 1996; Nei and Kumar, 2000; Yang and Rannala, 2012).
The DNA barcoding was proposed by Herbert et al. (2003) for species identification by rapid, accurate and automated procedures using a short and standardized gene region as a molecular tag. A mitochondrial DNA region encoding cytochrome c oxidase subunit I (COI, ~ 655 bp) was selected as the barcode tag for animals due to its relatively high evolutionary rate and absence of insertion-deletion patterns. For delimiting a species, the “Barcode Gap” was proposed based on an idea that intraspecific variations in the COI sequences should have smaller molecular divergences than interspecific variations. A recent study showed that the species delimitation in many animal groups can be done with a threshold of 2% molecular divergence in the DNA barcoding region and that individual species thus recognized can be given a unique barcode index number (BIN, Ratnasingham and Hebert, 2013). Although the concept of the DNA barcoding raised some controversies in the scientific community (e.g., Ebach and Holdrege, 2005; Hickerson et al., 2006), this approach has demonstrated its effectiveness in many animal and plant groups, especially in freshwater fishes (Hubert et al., 2008; Lara et al., 2010; Collins et al., 2012: Rosso et al., 2012; Young et al., 2013).
1.4 Indonesian freshwater fishes: rasboras
How many freshwater fish species are distributed in Indonesia? A survey conducted by Kottelat et al. (1993) in western parts of Indonesia and Sulawesi discovered 964 species. Further survey conducted in 1996 reported 79 additional species (Kottelat and Whitten, 1996). Mittermeier et al. (1997) mentioned 1400 freshwater fish species is distributed in Indonesia. More recent data provided by FishBase (Froese and Pauly, 2015), which also cover eastern
regions of Indonesia including Papua, recorded 1228 freshwater fishes. Brazil (> 3000 species) and Colombia (> 1500 species) are the only countries that exhibit higher freshwater fish diversity than Indonesia (Mittermeier et al., 1997). One of the most species-rich
freshwater fish groups in Indonesia is family Cyprinidae.
In Cyprinidae, genus Rasbora is one of the most species-rich genera, with 87 valid species so far recognized (Eschmeyer, 2015). Rasbora is distributed in a large geographical area, ranging from western India to Lesser Sunda Islands of Indonesia, as far as Lombok and Sumbawa Islands (Brittan, 1954, 1972, 1998; Kottelat et al., 1993; Froese and Pauly, 2015). Currently, sixty-six species of rasboras are naturally distributed in Indonesia and many of them are endemic species (Froese and Pauly, 2015). Recent studies conducted by
Lumbantobing (2010, 2014) described eight new species from Sumatra Island. In addition, several new species are now ready to be described and most of them are endemic species (Lumbantobing, D.N., personal communication).
Rasbora is a schooling fish that swims together in the same direction for behavioral
reasons. This species occurs strictly in freshwater habitats (i.e., primary freshwater fish) and can be easily found in large and small rivers, ponds, ditches, lakes, paddy field, and swamps. It rarely occurs in low oxygen waters and mountainous rivers with a swift current (Brittan, 1954, 1972, 1998). They breed only by sexual reproduction in which females lay semi-adhesive eggs on the underside of water plants and males quickly release the sperm for fertilization (Brittan, 1998). Rasbora is characterized by small to medium sizes (5-20 cm in the standard length) with a body elongated and compressed laterally, a symphyseal knob on the tip of lower jaw without barbels, and a dark lateral stripe that extends from the opercle to the caudal fin base.
One of broadly distributed species in the genus Rasbora is R. lateristriata. This species is supposed to be distributed from Borneo, Sumatra, Java, Bali, across Wallace’s Line, to Lombok and Sumbawa Islands of Indonesia based on some literatures (Kottelat et al., 1993;
Froese and Pauly, 2015) but its exact distributional range is unclear. R. lateristriata was first described as Leuciscus lateristriatus by Bleeker (1854) using several specimens from Java and Sumatra, including materials from Bogor, West Java, collected by Kuhl and van Hasselt (van Hasselt, 1823). Bleeker (1860) revised L. lateristriatus to Rasbora lateristriata.
However, some researchers (e.g., Brittan, 1954 and Alfred, 1963) later suggested that the Sumatran specimens do not match the original description of the species. They assigned only specimens from Java to R. lateristriata.
Rasbora baliensis was described by Brittan (1954) from a small crater lake, Lake
Bratan in Bali Island as the closest relative of R. lateristriata. R. baliensis is supposedly a species endemic to Bali (Brittan, 1954, 1972; Kottelat et al., 1993; Whitten et al., 1996). However, R. baliensis was described based on small numbers of specimens and relatively indistinct segregating characters (Brittan, 1954). Some researchers (Kottelat and Vidthayanon, 1993; Whitten et al., 1996) suspected that R. baliensis from Bali might be indistinguishable from R. lateristriata from eastern parts of Java, pointing out that the taxonomic status of R.
baliensis needs to be re-evaluated. Although molecular phylogeny involving many Rasbora
species has been studied (Mayden et al., 2007; Rüber et al., 2007; Britz et al., 2009; Fang et al., 2009; Tang et al., 2010), R. lateristriata and R. baliensis were not included in these studies. Thus, taxonomic and phylogenetic status on these species is still uncertain.
The evolutionary relationships and contemporary distributions of Indonesian freshwater fauna have been likely associated with the recurrent sea level changes in the Quaternary glaciation that occurred 2.6 to 0.01 million years ago (Mya). By the recurrent sea level changes in the Quaternary glaciation, the sea level repeatedly fell up to 120 m and rose up to 20 m from the present level. The Sunda shelf became dried and exposed throughout marine regression, forming a land bridge connecting Sumatra, Borneo, Java and Bali Islands (and some other intervening islands) with Indo-China and created a massive landmass called Sundaland. On the contrary, during the period of marine transgression, these islands became
disconnected and isolated (Rainboth, 1996; Voris, 2000; Woodruff, 2010) (Fig. 3). In the period of lower sea levels, the freshwater fauna may have expanded their geographical distribution by traversing the paleo-drainage systems. On the other hand, during periods of higher sea levels, when the time is sufficient enough to prevent the genetic admixture, it may have promoted intraspecific diversification and/or allopatric speciation (Yap, 2002; de Bruyn and Mather, 2007; Lohman et al., 2011; de Bruyn et al., 2013).
Wallace’s Line runs through the Lombok Strait between Bali and Lombok Islands and through the Makassar Strait between Borneo and Sulawesi Islands (Fig. 3). Lombok and Makassar Straits are considered to be deep enough not to allow migration of terrestrial animals across them even during the Quaternary glaciation (Moss and Wilson, 1998; Hall, 2009, 2013; de Bruyn et al., 2014). Thus, most freshwater fish fauna of the Asian origin are not distributed in the east of Wallace’s Line, with some exceptions including the cyprinid
Rasbora and anabantid Anabas (Briggs, 1987; Berra, 2001). When and how these fishes
migrated across Wallace’s Line remain to be an enigma.
In this study, I conducted several approaches including molecular phylogenetic analyses using mitochondrial and nuclear gene sequences, coupled with some morphological
investigations, to elucidate phylogenetic relationships of R. lateristriata and its allies collected from various localities in Java and neighboring islands. I also used these data to resolve taxonomic uncertainties of R. lateristriata and R. baliensis. Finally, I discuss the historical biogeography, especially on when and how the rasboras diversified and finally crossed the hypothetical barrier, Wallace’s Line.
Chapter 2: Material and Methods
2.1 Specimen collection
I conducted field sampling to collect Rasbora individuals in many freshwater localities from Sumatra, Borneo, Java, Bali, Lombok and Sumbawa Islands of Indonesia. Fish samples were collected using various non-destructive fishing gears, i.e., fyke net, cast net, hand net and backpack electrofishing (Fig. 4). Geographic coordinates of each sampling site were recorded using a handheld GPS unit. Whenever possible, live specimens were photographed from the left lateral side immediately after the kill (Fig. 5). The collected specimens were tentatively identified based on morphological characters in the field before subsequently reconfirmed in the laboratory. A small portion of the right pectoral fin was excised from fresh individuals in the field and preserved in TNESU8 buffer for molecular studies (Asahida et al., 1996). Whole body specimens were later preserved in 99% ethanol and deposited to the Specimen Depository, Faculty of Fisheries and Marine Science, University of Brawijaya with voucher numbers listed in Table 2. I obtained research permission from Indonesian Institute of Sciences (LIPI) to bring the fin clip samples and the whole body specimens to Japan.
The taxonomic history of R. lateristriata is somewhat convoluted. In Buitenzorg (currently known as Bogor) of West Java in 1820-1823, two Netherland scientists Heinrich Kuhl and Johan Coenraad van Hasselt collected several specimens of freshwater fish and named one of them as Barbus leuciscus Cuv. lateristriatus (van Hasselt, 1823). However, due to inadequate descriptions and lack of references, this name failed to become a formal
scientific name and was unavailable at that time (nomen nudum) (Roberts, 1993). Afterward, Bleeker (1854) examined several materials from Java and Sumatra, including materials collected by Kuhl and van Hasselt (van Hasselt, 1823), gave adequate descriptions, and named these specimens Leuciscus lateristriatus. Later, Bleeker (1860) in his subsequent
Fig. 4. Different types of fishing gears used in this study: (A) fyke net, (B) cast net, (C) hand net, and (D) backpack electrofishing.
work revised the name of L. lateristriatus and replaced it by Rasbora lateristriata. Some researchers (e.g., Brittan, 1954; Alfred, 1963) noticed that only specimens from Java can be assigned to the pertinent species (R. lateristriata). Given that the holotype and paratype specimens of R. lateristriata were unavailable for an unknown reason, Alfred (1963) assigned specimens collected from Batavia (currently known as Jakarta), Ciampea, Bandung and Garut of West Java as the lectotype. I therefore conducted field sampling in several sites of West Java and finally collected this species in a small river in Sukabumi near Bogor, West Java.
For R. baliensis, the sampling was conducted in the type locality of this species, in Lake Bratan, an enclosed-crater lake about 1231 m above sea level in the Buyan-Bratan caldera complex, Bali Island (Brittan, 1954). I also conducted field sampling in three additional sites. One of the sites, Lake Batur, was distantly located from other localities. In total, R.
Fig. 5. Left lateral images of R. lateristriata-like specimens collected from eleven localities. The museum voucher number for each specimen is (A) UB.1.143.1 (Sukabumi, 75.0 mm SL), (B) UB.1.142.1 (Tegal, 57.1 mm SL), (C) UB.1.119.2 (Sleman, 61.3 mm SL), (D) UB.1.141.4 (Salatiga, 46.1 mm SL), (E) UB.1.127.9 (Jepara, 45.2 mm SL), (F) UB.1.117.8 (Pasuruan, 66.1 mm SL) (G) UB.1.125.3 (Lumajang, 57.5 mm SL), (H) UB.1.115.20 (Banyuwangi, 57.6 mm SL), (I) UB.1.111.13 (Bratan, 73.6 mm SL), (J) UB.1.118.7 (Lombok, 54.8 mm SL) and (K) UB.1.139.4 (Serange, 59.9 mm SL).
Lombok and Sumbawa Islands. R. aprotaenia was collected similarly and I tried to collect this species in its type locality. Brittan (1954) described R. aprotaenia using seven individuals collected from a type locality that was mentioned to be in ‘Tjilowaeng River’ or ‘Ciliwung River’, West Java. I therefore conducted field sampling in this river and finally collected R.
aprotaenia in Katulampa Dam of Ciliwung River (Table 2).
I noticed from morphological appearance, R. lateristriata-like fish from Java and Bali Islands were very similar to each other. Thus, I regarded them as the R. lateristriata species complex as discussed later in more details.
2.2 DNA amplification and sequencing
Genomic DNA was extracted from the fin samples following a procedure described by Asahida et al. (1996). For protein digestion, 20 µl of Protaeinase K (20mg/ml) was added to a 1.5 ml tube containing the preserved tissue of right pectoral fin in TNESU8 buffer. The mixture was then incubated at 37°C for 15-20 hours (or at room temperature for several days). After incubation, the mixture was extracted with an equal volume of phenol-chloroform (1:1). After the extraction, cold ethanol was added in the mixture for DNA precipitation. Finally, precipitated DNA was dissolved in TEbuffer. DNA samples were then stored in a freezer at -30°C until use.
Two mitochondrial genes coding for cytochrome oxidase subunit I (COI, 655 bp) and cytochrome b (Cytb, 1091 bp), as well as two nuclear genes coding for recombination activating gene I (RAG1, 1557 bp) and opsin (a protein part of rhodopsin) (866 bp) in a total 4169 bp were amplified by polymerase chain reaction (PCR) using sets of primers listed in Table 3. These four genes have been frequently used for elucidating both interspecific and intraspecific phylogenetic analyses in fishes, especially by Tang et al. (2010) who conducted phylogenetic analysis using many species from Rasbora.
The PCR was performed in a 10 µl reaction mixture with a SpeedSTAR HS DNA polymerase (Takara) according to the manufacture’s protocol. The PCR was done by 30 cycles of 98°C for 5 s, 55°C for 15 s and 72°C for 20 s. PCR products were treated with an ExoSAP-IT (Affymetrix) and directly sequenced in both directions using a Big Dye terminator v3.1 cycle sequence kit (Life Technologies) on the ABI 3500 DNA sequencer. Obtained sequences for both directions were edited and assembled with Sequencher 4.8 (Gene Codes). Because there were very few indels in the determined sequences, sequences were manually aligned by eye using MacClade 4.08 (Sinauer Associates). Possible heterozygotic sites in the RAG1 and opsin genes were treated following IUPAC ambiguity codes.
Region Name Sequence (5' to 3') Source
COI FishF1 TCAACCAACCACAAAGACATTGGCAC Ward et al. (2005)
FishR1 TAGACTTCTGGGTGGCCAAAGAATCA Ward et al. (2005)
Cytb LA-cyp ATGGCAAGCCTACGAAAAAC Tang et al. (2010)
HA-cyp TCGGATTACAAGACCGATGCTT Tang et al. (2010)
RAG1 RAG1F1 CTGAGCTGCAGTCAGTACCATAAGATGT Lopez et al. (2004)
RAG1R1 CTGAGTCCTTGTGAGCTTCCATRAAYTT Lopez et al. (2004)
Ras_RAG1F1 GCATCAGGCTCCACTTAC this study
Ras_RAG1R1 ATAGCGCTCGAGATTTTCC this study
Opsin Rh 28F TACGTGCCTATGTCCAAYGC Chen et al. (2008)
Rh 1039R TGCTTGTTCATGCAGATGTAGA Chen et al. (2003)
Table 3. Sets of primers for PCR amplification and/or sequencing
In order to determine complete mitochondrial genome sequences, two individuals for R.
lateristriata (voucher number: UB.1.116.20) and R. aprotaenia (UB.1.120.3) were randomly selected. Mitochondrial genome (mitogenome) sequences of both species were completely sequenced using the long PCR amplification and subsequent amplification, sequencing and assembly of shorter (650-950 bp) DNA regions, starting from the long PCR product as a template (Miya and Nishida, 1999; Inoue et al., 2001). The PCR and sequencing were
conducted as described above. Obtained sequences for both directions were edited and assembled with Sequencher 4.8 (Gene Codes). Gene characterization and annotation in determined mitogenome sequences were done using DOGMA (Wyman et al., 2004) followed by manual inspection.
2.3 Phylogenetic analyses
2.3.1 Analysis of mitogenomic sequences
Mitogenomic sequences for species other than R. lateristriata and R. aprotaenia were downloaded from DDBJ/EMBL/GenBank. Eight mitochondrial genome sequences from genus Rasbora have been deposited including Rasbora borapetensis (accession number AB924546), Rasbora cephalotaenia (AP011430), Rasbora daniconius (AP011285), Rasbora
steineri (JX843769), Rasbora trilineata (KM200714), Rasboroides vaterifloris (AP011432), Trigonostigma heteromorpha (AP011421), Trigonostigma espei (AP011449). Danio rerio
(AC024175) and Acheilognathus typus (AB239602) were selected as outgroup taxa.
Getmitogenome (Jonniaux, 2014) was used to retrieve the sequences from the database. This software was also used to determine the boundaries between 37 genes (13 proteins, 22 tRNAs and two rRNAs) by aligning gene sequences of the above-mentioned taxa with the currently available alignment for other taxa (unpublished data). Maximum likelihood analysis was conducted by using 3757 amino acid sites of 13 mitochondrial protein genes to determine the phylogenetic position of R. lateristriata and R. aprotaenia among other Rasbora species. Garli v2.0 (Zwickl, 2014) was used to conduct the analyses under the mtREV+IG4 model. The nodal support was assessed by 500 non-parametric bootstrap resamplings.
2.3.2 Interspecies phylogenetic analyses
Phylogenetic analyses to determine the phylogenetic position of the R. lateristriata species complex among other Rasbora species were conducted using one randomly selected
individual representing each locality or each species. DNA sequences for many rasboras that were not sampled during my fieldwork, including two outgroup taxa of Chromobotia
macracanthus and Catostomus commersonii were downloaded from DDBJ/EMBL/GenBank.
These sequences were mainly reported by Tang et al. (2010). The list of species and their voucher numbers are shown in Table 4. DNA sequences from mitochondrial COI and Cytb, as well as nuclear RAG1 and opsin or their combination, were used to construct phylogenetic trees using Bayesian and maximum likelihood (ML) methods. The dataset to infer the phylogenetic position of the R. lateristriata species complex using only one representative individual per location is named dataset 1. I conducted phylogenetic analyses using five different combinations of genes in dataset 1, i.e., concatenated four genes and individual genes of COI, Cytb, RAG1 and opsin. The best partition schemes and its evolutionary models for first, second and third codon positions of genes in each dataset were estimated using PartitionFinder (Lanfear et al., 2012).
I conducted Bayesian analyses using MrBayes v3.12 (Ronquist and Huelsenbeck, 2003). Due to the limitation of evolutionary models available in this software, I used the most complex evolutionary model of GTR+I+G with 4 gamma categories for all partitions. Starting from randomly generated trees, the Markov chain Monte Carlo (MCMC) process was initially set at 2,000,000 generations and continued until the Average Standard Deviation of Split Frequency became less than 0.01. Two independent runs with four simultaneous MCMC chains at temperature 0.20 were conducted by default. The first 25% generations were discarded as “burnin” after the likelihood score reached the stationarity. Trees were sampled every 100 generations and a 50% majority consensus tree with Bayesian posterior (Bayes-P) probabilities at nodes was constructed based on trees from the remaining generations. ML analyses were conducted using GARLI v2.0 (Zwickl, 2014) using the estimated partition schemes and models. Five independent runs were conducted using the default search setting (5,000,000 generations) from a randomly generated initial tree. The statistical support at each node was assessed by 1000 non-parametric bootstrap resamplings.
2.3.3 Analyses within the R. lateristriata species complex
Phylogenetic reconstructions for elucidating relationships within the R. lateristriata species complex were done using maximum likelihood and Bayesian methods. Methods for conducting phylogenetic analyses were the same as explained in the section 2.3.2. I conducted phylogenetic analyses using dataset 2 that included randomly selected 2 to 4 individuals per locality (mostly 4 individuals). Three different combinations of genes were used in the
analyses: concatenation of four genes (COI+Cytb+RAG1+opsin), concatenated mitochondrial genes (COI+Cytb) and concatenated nuclear genes (RAG1+opsin). Accession numbers of gene sequences used in the dataset 2 are shown in Table 5.
2.4 Genetic divergence estimation
Using COI gene sequences of all available individuals of each locality (ranging from 2 to 13 individuals), molecular divergence was estimated. A standardized threshold of 2% sequence divergence as suggested by Ward (2009) and Ratnasingham and Hebert (2013) was used as a reference for the species delimitation. Kimura’s 2-parameter (K2P) model
implemented in MEGA v6.06 (Tamura et al., 2013) was used to calculate the pairwise divergences.
2.5 Divergence time estimation
Divergence times among major lineages within the R. lateristriata species complex were estimated using the relaxed-clock Bayesian method implemented in BEAST v1.8.2 (Drummond et al., 2012). The XML input file was generated using BEAUti v1.8.2
(Drummond et al., 2012). The dataset using RAG1 and opsin gene sequences was created by randomly selecting one haplotype representing each major lineage. I applied the Uncorrelated Lognormal Clock model (Drummond et al., 2006) with no a priori correlation of evolutionary rates between a lineage’s rate and that of its ancestor and the Yule tree prior assuming a
constant speciation rate per lineage. jModelTest v2.1.5 (Darriba et al., 2012) was used to select the best substitution model of each partition. SYM+I+G and GTR+I+G were selected for RAG1 and opsin genes, respectively. A gamma-distributed substitution rate with 4 categories was selected with the base frequency estimated from the data. A user-specified starting tree was set as the ML tree topology resulting from the four genes analysis. Two independent MCMC processes for two hundred million generations were performed and trees were sampled every 1000 generations. Tracer v1.6.0 (Rambaut et al., 2015) was used to confirm more than 200 effective sample sizes for parameters and the convergence of two independent runs after the first 10% samples were removed as ‘burnin’. LogCombiner v1.8.2 was used to combine sampled trees. A single ultrametric tree with a median posterior
divergence time estimate and 95% highest posterior density intervals (95% HPD) was created using TreeAnnotator v1.8.2.
Seven calibration points were used as priors for the divergence time estimation. The calibration points were based on Betancur-R et al. (2013) that used 18 genes (17 nuclear and 1 mitochondrial genes) to estimate divergence times between major lineages of bony fishes, including cypriniform fishes. I referred to estimated divergence times from this work at 7 nodes which are within or close to Cyprinidae. Because time estimates by Betancur-R et al. (2013) were point estimates without confidence intervals, I used these values as means of the prior time distribution at the corresponding nodes and arbitrarily set 20% of the means as standard deviations of the normal distributions. I also conducted the dating analyses using the first and second codon positions of concatenated mitochondrial gene sequences (COI and Cytb). Parameters for performing this analysis in BEAST were set to be the same as in nuclear gene sequence analysis.
2.6 Historical biogeography reconstruction and haplotype network analysis
Historical biogeography inference of the R. lateristriata species complex was done using RASP v3.2 (Yu et al., 2015) under the Lagrange (Dispersal-Extinction-Cladogenesis, DEC) model (Ree et al., 2005; Ree and Smith, 2008). A condensed time-calibrated
phylogenetic tree produced by BEAST v1.8.2 (Drummond et al., 2012) for divergence time estimation was used after removing most outgroup taxa as an input tree to reconstruct ancestral geographic distributions of the R. lateristriata species complex. To assign current distributions of the R. lateristriata species complex in Java Island, I divided Java into three regions: West, Central and East Java. The assignment of Java Island into three different regions is in accordance with the paleogeographical history of this island from Late Miocene to Early Pliocene (Hall, 2009, 2013).
To elucidate relationships among COI haplotype sequences of the R. lateristriata species complex, an unrooted haplotype network was reconstructed using NETWORK v5.0.0.0 (http://www.fluxusengineering.com). I applied a median-joining algorithm (Bandelt et al., 1999) with the default settings.
2.7 Morphological analyses
Morphological analyses were conducted using all collected specimens of the R.
lateristriata species complex. I also examined museum specimens labeled as R. lateristriata
and deposited at the Museum Zoologicum Bogoriense (MZB), Cibinong, Indonesia. Methods for measuring morphometric characters and counting meristic characters basically followed those of Brittan (1954) and Lumbantobing (2014). Briefly, standard length (SL) was
measured from the anterior tip of the mouth to the end of the hypural plate. Dorsal-hypural distance (DHD) was measured as a distance from the origin of the dorsal fin to the end of hypural plate. Head length (HL) is a distance taken from the anterior tip of the mouth to the posterior edge of the opercle. A lateral line scale is a series of pored scales along the lateral
Fig. 6. Morphological characters analyzed in this study. (A) A left lateral and (B) a dorsal view of R. lateristriata from Sukabumi. Morphometric and meristic characters are derived from Brittan (1954) and Lumbantobing (2014). The terminology of the body color pattern follows Brittan (1954) with some additional features from Lumbantobing (2010, 2014). The abbreviation of each character is: BCB = Basicaudal Blotch; BR = Basal Reticulation; DHD = Dorsal Hypural Distance; ED = Eye Diameter; HD = Head Depth; HL = Head Length; IOW = Inter-Orbital Width; MDP = Midhumeral Diffuse Patch; MLS = Midlateral Stripe; MOS = Midopercular Stripe; POP = Postopercular Pigmentation; PR = Peripheral Reticulation; SAP = Supra Anal Pigment; SL = Standard Length and TL: Total Length.
line starting just behind the upper end of the gill opening to the base of the caudal fin. Finally, the pre-dorsal scale is a series of scales along the midline starting from the origin of the dorsal fin forward to the skull.
I followed Brittan (1954) for the terminology of the body color pattern and
Lumbantobing (2010, 2014) for some additional pigmentation features, including peripheral reticulation (PR), basal reticulation (BR), basicaudal blotch (BCB), midhumeral diffuse patch (MDP), midopercular stripe (MOS) and postopercular pigmentation (POP). Supra anal
BCB is the melanophores spot observable at the base of the hypural plate. MDP is
characterized by melanophore pigmentation starting from the gill opening to the dorsal fin origin in the midlateral region. In total, I observed 38 meristic or morphometric characters featuring the body color pattern in this study. More details on the morphological examination used in this study are shown in Fig. 6.
Chapter 3: Results
3.1 Collection of specimens
I collected Rasbora samples from 47 freshwater localities (Fig. 7). Two hundred thirty six individuals were identified as R. lateristriata or R. baliensis and the others were identified as one of R. aprotaenia, R. argyrotaenia, R. aurotaenia, R. einthovenii, R. elegans, R. myersi,
R. tornieri, and T. gracile. Among the 236 R. lateristriata or R. baliensis individuals, 127, 72,
13 and 24 individuals were collected from Javanese, Balinese, Lombok and Sumbawa localities, respectively (Table 2 and Fig. 8). Among them, 24 individuals (10%) were young with SL less than 35 mm. R. lateristriata-like samples were not collected from Sumatran and Bornean localities where I conducted field samplings (Fig. 7). The number of collected individuals varied from locality to locality, ranging from 2 to 55 individuals (Table 2).
A single Rasbora species usually occurred at each locality, with several exceptions (Fig. 7). R. tornieri and R. myersi were co-distributed in Jambi while R. aurotaenia and R. myersi occurred in Palembang of Sumatra. In Borneo, R. tornieri, R. myersi and R. argyrotaenia sympatrically occurred in a location of Banjarmasin. In addition, R. elegans and R.
argyrotaenia co-existed in Samarinda and R. einthovenii and R. argyrotaenia occurred in
Kutai Kartanegara. All but one Javanese localities had a single Rasbora species. Only Tegal of Central Java had both R. lateristriata and R. argyrotaenia together. Because rasboras were scarce at Lake Buyan, Penet River, Bomo River, Lake Ranu Klakah, Rowoganjar River and Bogares River, only less than 10 individuals were caught at these localities (Table 2).
3.2 Phylogenetic positions of R. lateristriata and R. aprotaenia revealed using mitogenome sequences
The lengths of mitochondrial genomes for R. lateristriata and R. aprotaenia which I sequenced were 16,539 bp (DDBJ/EMBL/GenBank accession No. LC021505) and 16,541 bp
Fig. 7. Sampling localities for rasboras. All 47 sampling locations for Rasbora, ranging from Sumatra, Borneo, Java, Bali, to Lombok and Sumbawa Islands in the eastern side of
Wallace’s Line are shown with one or more symbols that correspond to identified Rasbora species. Species identification is based primarily on morphological features complemented by molecular information. Locations with sympatric distribution of multiple Rasbora species are highlighted with a red circle. The map is produced based on a satellite image from Google Earth v7.1.5.1557.
Fig. 8. Seventeen sampling localities for the R. lateristriata species complex. Locality of R.
aprotaenia for mitochondrial genome study is highlighted with a white circle, collected from
its type locality. Locality names and numbers correspond to those in Table 2. The map is produced based on a satellite image from Google Earth v7.1.5.1557.
Spacer (+) or Start Stop
Overlap (-) Codon Codon1
tRNA-Phe F 1 69 69 0 F 12S rRNA 70 1022 953 0 F tRNA-Val V 1023 1093 71 0 F 16S rRNA 1094 2774 1681 0 F tRNA-Leu (UUR) L 2775 2848 74 0 F ND1 2850 3824 975 1 F ATG TAA tRNA-Ile I 3829 3900 72 4 F tRNA-Gln Q 3899 3969 71 -2 R tRNA-Met M 3971 4039 69 1 F ND2 4040 5084 1045 0 F ATG T -tRNA-Trp W 5085 5157 73 0 F tRNA-Ala A 5161 5228 68 3 R tRNA-Asn N 5231 5303 73 2 R L-strand Origin 5304 5340 37 0 tRNA-Cys C 5338 5405 68 -3 R tRNA-Tyr Y 5407 5476 70 1 R CO1 5478 7028 1551 1 F GTG TAA tRNA-Ser (UCN) S 7029 7099 71 0 R tRNA-Asp D 7101 7170 70 1 F CO2 7176 7866 691 5 F ATG T -tRNA-Lys K 7867 7941 75 0 F
ATPase 8 7944 8108 165 2 F ATG TAA
ATPase 6 8102 8781 680 -7 F ATG TA -CO3 8782 9566 785 0 F ATG TA -tRNA-Gly G 9567 9637 71 0 F ND3 9638 9986 349 0 F ATG T -tRNA-Arg R 9987 10056 70 0 F ND4L 10057 10353 297 0 F ATG TAA ND4 10347 11728 1382 -7 F ATG TA -tRNA-His H 11729 11797 69 0 F tRNA-Ser (AGY) S 11805 11865 61 7 F tRNA-Leu (CUN) L 11868 11940 73 2 F ND5 11941 13770 1830 0 F ATG TAA ND6 13767 14288 522 -4 R ATG TAA tRNA-Glu E 14289 14357 69 0 R Cytb 14367 15507 1141 0 F ATG T -tRNA-Thr T 15508 15578 71 0 F tRNA-Pro P 15588 15657 70 9 R Control region 15685 16539 855 0 CSB-2 16309 16325 17 CSB-3 16350 16368 19
1Hyphens indicate an incomplete stop and imply subsequent addition of A residues to the 3’ end of the mRNA by polyadenilation Strand
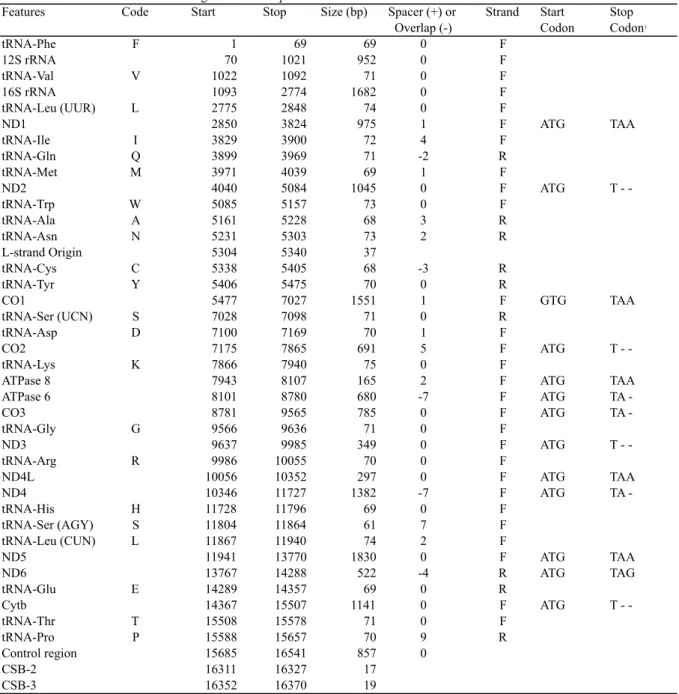
Table 6. Features of the mitochondrial genome of R. lateristriata
Features Code Start Stop Size (bp)
(LC021504), respectively. Features of the mitochondrial genome of R. lateristriata and R.
aprotaenia are shown in Tables 6 and 7, respectively. Both mitogenomes encode 37 genes for
13 proteins, 22 tRNAs, and 2 rRNAs with a major noncoding region in the typical vertebrate gene arrangement (Anderson et al. 1981). All protein genes start with an ATG initiation codon, except for COI gene which uses GTG as a start codon. Seven protein genes have a stop codon in the mitogenome sequences, whereas the remaining six protein genes appear to
Spacer (+) or Start Stop
Overlap (-) Codon Codon1
tRNA-Phe F 1 69 69 0 F 12S rRNA 70 1021 952 0 F tRNA-Val V 1022 1092 71 0 F 16S rRNA 1093 2774 1682 0 F tRNA-Leu (UUR) L 2775 2848 74 0 F ND1 2850 3824 975 1 F ATG TAA tRNA-Ile I 3829 3900 72 4 F tRNA-Gln Q 3899 3969 71 -2 R tRNA-Met M 3971 4039 69 1 F ND2 4040 5084 1045 0 F ATG T -tRNA-Trp W 5085 5157 73 0 F tRNA-Ala A 5161 5228 68 3 R tRNA-Asn N 5231 5303 73 2 R L-strand Origin 5304 5340 37 tRNA-Cys C 5338 5405 68 -3 R tRNA-Tyr Y 5406 5475 70 0 R CO1 5477 7027 1551 1 F GTG TAA tRNA-Ser (UCN) S 7028 7098 71 0 R tRNA-Asp D 7100 7169 70 1 F CO2 7175 7865 691 5 F ATG T -tRNA-Lys K 7866 7940 75 0 F
ATPase 8 7943 8107 165 2 F ATG TAA
ATPase 6 8101 8780 680 -7 F ATG TA -CO3 8781 9565 785 0 F ATG TA -tRNA-Gly G 9566 9636 71 0 F ND3 9637 9985 349 0 F ATG T -tRNA-Arg R 9986 10055 70 0 F ND4L 10056 10352 297 0 F ATG TAA ND4 10346 11727 1382 -7 F ATG TA -tRNA-His H 11728 11796 69 0 F tRNA-Ser (AGY) S 11804 11864 61 7 F tRNA-Leu (CUN) L 11867 11940 74 2 F ND5 11941 13770 1830 0 F ATG TAA ND6 13767 14288 522 -4 R ATG TAG tRNA-Glu E 14289 14357 69 0 R Cytb 14367 15507 1141 0 F ATG T -tRNA-Thr T 15508 15578 71 0 F tRNA-Pro P 15588 15657 70 9 R Control region 15685 16541 857 0 CSB-2 16311 16327 17 CSB-3 16352 16370 19
1Hyphens indicate an incomplete stop and imply subsequent addition of A residues to the 3’ end of the mRNA by polyadenilation Strand
Table 7. Features of the mitochondrial genome of R. aprotaenia
Features Code Start Stop Size (bp)
have a mechanism in which their stop codons are posttranscriptionally created by polyadenylation. All tRNA genes can be folded into the standard cloverleaf secondary structures for mitochondrial tRNAs (Kumazawa and Nishida 1993). Phylogenetic analyses (Fig. 9) showed, with a 100% bootstrap support, that R. lateristriata is more closely related to
R. aprotaenia than to any other Rasbora species examined, pointing to their phylogenetic
Fig. 9. Maximum likelihood tree constructed using 3757 amino acid sites of 13 mitochondrial protein genes. R. lateristriata and R. aprotaenia are shown to be closely related to each other pointing to their phylogenetic affinity. Bootstrap probabilities by 500 replications are shown for each node when they are 50% or larger.
3.3 Phylogenetic position of the R. lateristriata species complex using multilocus gene sequences
COI, Cytb, RAG1 and opsin gene sequences determined from a representative individual of each locality for the R. lateristriata species complex and 8 other Rasbora
species were aligned with those downloaded from the database as the dataset 1 to conduct ML and Bayesian analyses. The four gene sequences had different sizes, ranging from 655 bp (COI) to 1557 bp (RAG1). As expected, mitochondrial genes had more variable and
informative sites per determined base than nuclear genes but the latter genes still provided a number of variable and informative sites (Table 8).
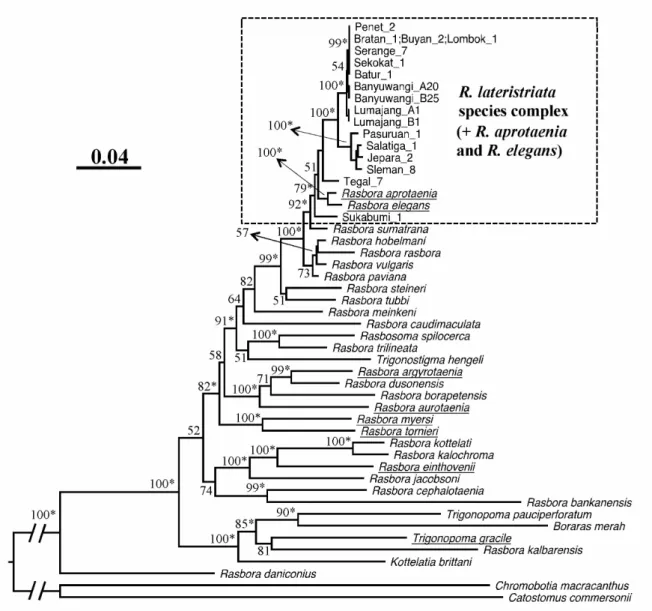
Figure 10 shows an ML tree constructed using four concatenated gene sequences of the dataset 1. Phylogenetic relationships between various Rasbora species were largely in
Fig. 10. A maximum likelihood tree among Rasbora species constructed using COI, Cytb, RAG1 and opsin gene sequences. Values at nodes show bootstrap probabilities (>50 % only) and an asterisk shows that the corresponding node received a Bayes-P probability of 1.00. Refer to Table 4 for used taxa and individuals with accession numbers. Individuals of the R.
lateristriata species complex are shown with their locality name and the number of
individuals from that locality (e.g., Bratan_1). The Rasbora lateristriata species complex boxed with dotted lines is defined in text. As explain in more details in section 4.1, I propose to regard the R. lateristriata species complex+R. aprotaenia+R. elegans as the R.
lateristriata-group. In underlined taxa other than the R. lateristriata species complex, the
corresponding specimen was collected, identified and sequenced by me.
agreement with Tang et al. (2010) who used neither of R. lateristriata nor R. baliensis in the molecular analyses. This ML tree indicates that individuals of the R. lateristriata species complex together with those of R. aprotaenia and R. elegans make a monophyletic group with relatively high support values (79% bootstrap and 1.00 Bayes-P probabilities). I will later
Fig. 11. A maximum likelihood tree among Rasbora species constructed using COI gene sequences. For other details, see the legend of Fig. 10.
name this clade the R. lateristriata-group (see Chapter 4). This clade has a sister-group relationship with R. sumatrana with strong bootstrap (92%) and Bayes-P (1.00) probabilities. In contrast, R. argyrotaenia, another commonly occurring species in Java Island, turned out to be distantly related to the R. lateristriata species complex (Fig. 10).
Fig. 12. A maximum likelihood tree among Rasbora species constructed using Cytb gene sequences. For other details, see the legend of Fig. 10.
I also conducted ML and Bayesian analyses based on each of the COI, Cytb, RAG1 and opsin gene sequences (Figs. 11-14). The monophyly of the R. lateristriata species
complex+R. aprotaenia+R. elegans and its sister-group relationship to R. sumatrana were commonly seen for two ML trees based on COI and Cytb genes (Figs. 11-12). Although ML trees based on RAG1 and opsin genes did not necessarily support these conclusions, these trees lacked high resolution in general without strong bootstrap and Bayes-P supports at nodes (Figs. 13-14). Thus, I judged that no strongly competing phylogenetic information with
Fig. 13. A maximum likelihood tree among Rasbora species constructed using RAG1 gene sequences. For other details, see the legend of Fig. 10.
3.4 Phylogenetic relationships within the R. lateristriata species complex
In order to elucidate phylogenetic relationships within the R. lateristriata species complex, I conducted phylogenetic analyses using the dataset 2 including more (usually 4) numbers of individuals from each locality but less numbers of outgroup taxa than in the dataset 1. Figure 15 shows an ML tree constructed using four gene sequences. Four major clades were identified all with strong bootstrap (99 or 100%) and Bayes-P (1.00)
Fig. 14. A maximum likelihood tree among Rasbora species constructed using opsin gene sequences. For other details, see the legend of Fig. 10.
The first clade (Clade 1) is composed of individuals from eastern parts of Java, Bali, Lombok and Sumbawa. The second clade (Clade 2) consists of individuals from central parts of Java (Pasuruan, Sleman, Salatiga and Jepara) while the third clade (Clade 3) consists of individuals from a single Javanese locality (Tegal). Individuals from a West Javanese locality
Fig. 15. A maximum likelihood tree of the R. lateristriata species complex with multiple individuals from each locality. The tree was constructed with nucleotide sequences of 4 genes (COI, Cytb, RAG1 and opsin). Values at nodes show bootstrap probabilities (> 50% only) and an asterisk shows that the corresponding node received a Bayes-P probability of 1.00. Refer to Table 5 for used taxa and individuals with accession numbers. Individuals of the R.
lateristriata species complex are shown with their locality name and the number of
individuals from that locality (e.g., Bratan_1). Taxa from Balinese localities are highlighted with an underline. Different colors match the locality information in Fig. 8.
are more closely related to each other than they are to Clade 3 or Clade 4. The clustering of Clade 1 and Clade 2 accompanied strong support values (100% bootstrap and 1.00 Bayes-P probabilities). On the other hand, relationships among Clade 1+2, Clade 3, Clade 4 and the R.
aprotaenia-R. elegans clade were supported with low or only moderately high bootstrap
Within Clade 1, four subclades were recognized (Fig. 15). Subclade 1A consists of individuals from Bali, Lombok and Sumbawa Islands, and subclades 1B and 1C are
composed of individuals from Banyuwangi and Lumajang, respectively. Monophyly of these subclades was supported with moderate to high bootstrap probabilities (82-93%). However, three individuals from Lumajang (Lumajang_A2, Lumajang_A4 and Lumajang_B2) did not cluster with the other Lumajang individuals. They basally diverged from all other Clade 1 individuals and formed subclade 1D. Within Clade 2, four subclades were recognized. Subclades 2A, 2B, 2C, and 2D are composed of individuals from Pasuruan, Sleman, Salatiga and Jepara, respectively. One individual from Pasuruan (Pasuruan_7) appeared within subclade 2B, rendering Pasuruan individuals to be non-monophyletic. Otherwise, all the subclades 1B, 1C, 2A, 2C and 2D comprise individuals from a distinct small geographical area. In other words, lineage sorting has likely operated to make haplotypes in these areas distinct from each other. In contrast, individuals in subclade 1A are not clustered based on their geographical origin, such as Bali, Lombok and Sumbawa Islands. Thus, the lineage sorting has not operated enough to segregate haplotypes in these islands although Lombok and Sumbawa Islands are located in the eastern side of Wallace’s Line.
With respect to phylogenetic relationships between the subclades, subclades 1A and 1B are more closely related to each other than they are to subclade 1C (Fig. 15). However, this relationship does not accompany high bootstrap and Bayes-P probabilities. Within Clade 2, subclades 2C and 2D make a monophyletic group, to which subclade 2B clusters. The monophyly of subclades 2B-2D in relation to subclade 2A is supported with high bootstrap (94%) and Bayes-P (1.00) probabilities.
I also conducted phylogenetic analyses based on each of the four genes of the dataset 2 and concatenated mitochondrial and nuclear genes. Figures 16 and 17 show ML trees
constructed using mitochondrial (COI+Cytb) and nuclear genes (RAG1+opsin), respectively. These two ML trees and the ML tree based on 4 genes (Fig. 15) commonly supported
Fig. 16. A maximum likelihood tree of the Rasbora lateristriata species complex constructed using concatenated COI and Cytb gene sequences. For other details, see the legend of Fig. 15.
a sister-group relationship of the R. lateristriata species complex+R. aprotaenia+R. elegans to R. sumatrana and the clustering of R. aprotaenia and R. elegans. The monophyly of individuals in each of Sukabumi, Jepara and Sleman was also commonly seen. Whereas the ML trees based on the four genes and two mitochondrial genes were similar to each other in many topological relationships (e.g., recognition of Clades 1-4 and basal divergence of Clade 4 followed by the divergence of the R. aprotaenia+R. elegans clade and Clade 3), the ML tree based on two nuclear genes largely lacked the resolution on these relationships, as seen by generally low bootstrap and Bayes-P probabilities especially in relationships within Clades 1 and 2 (Fig. 17). However, there was one noticeable difference in the placement
Fig. 17. A maximum likelihood tree of the Rasbora lateristriata species complex constructed using concatenated RAG1 and opsin gene sequences. For other details, see the legend of Fig. 15.
of Sleman individuals. In the 4-gene and mitochondrial ML trees, they are closely related to individuals from other Central Javanese localities (i.e., Pasuruan, Salatiga and Jepara) in Clade 2. On the other hand, they cluster with Sukabumi individuals outside Clade 2 in the nuclear ML tree. However, this new relationship is not supported with strong bootstrap and Bayes-P probabilities and I judged that there is no strongly competing phylogenetic
3.5 Molecular divergences between clades
I then estimated molecular divergences between Clades 1-4 using the COI barcoding region sequences. For this purpose, the COI gene was sequenced from all available
individuals from each locality. I first confirmed that 4 major clades recognized in Fig. 15 also appeared in an ML tree based on all the available COI gene sequences (Fig. 18). The average pairwise K2P distances were then calculated between these clades to show that all of them exceed 2% (an empirical distance at the boundary of closely related species) (Ward, 2009; Ratnasingham and Hebert, 2013), supporting that Clades 1-4 represent different species (Table 9). On the other hand, the average pairwise K2P distances between subclades of Clade 1 and Clade 2 were much less than 2%, suggesting that these subclades represent intraspecific lineages (data not shown). Voucher numbers for all individuals and accession numbers of determined sequences are shown in Table 10.
3.6 Estimation of divergence times
To the best of my knowledge, prior to this study, only a few attempts have been made for divergence time estimation of lineages within the genus Rasbora. Studies conducted by Rüber et al. (2007) and Britz et al. (2009) estimated divergence times within Cyprinidae and used several species of rasboras in their analysis. However, both studies only used a single calibration point with the oldest known fossil of the Cyprinidae. More recently, Betancur-R et
N Clade 1 Clade 2 Clade 3 Clade 4
Clade 1 82 0.007 0.007 0.007
Clade 2 41 0.035 0.007 0.008
Clade 3 2 0.031 0.038 0.006
Clade 4 9 0.035 0.050 0.026
Table 9. Pairwise divergences between major clades of the R. lateristriata species complex
Distances were calculated using Kimura's 2-parameter distances for COI gene sequences (655 bp). Values above diagonal indicate standard deviation.