Myanmar's cross-border trade with China :
beyond informal trade
著者
Kubo Koji
権利
Copyrights 日本貿易振興機構(ジェトロ)アジア
経済研究所 / Institute of Developing
Economies, Japan External Trade Organization
(IDE-JETRO) http://www.ide.go.jp
journal or
publication title
IDE Discussion Paper
volume
625
year
2016-12
INSTITUTE OF DEVELOPING ECONOMIES
IDE Discussion Papers are preliminary materials circulated to stimulate discussions and critical comments
Keywords: Myanmar, cross-border trade, informal trade, transaction costs of trade JEL classification: O17, O53, F19
* Development Studies Center, IDE ([email protected])
IDE DISCUSSION PAPER No. 625
Myanmar’s Cross-border Trade with
China: Beyond Informal Trade
Koji KUBO*
December 2016
Abstract
Myanmar’s trade with China is heavily concentrated in cross-border trade through the Yunnan province of China. In this qualitative analysis, we examine factors that yield such a concentration from the viewpoint that trade would be concentrated in the channel where transaction costs are relatively low compared with those in other channels. It is almost certain that weak law enforcement at the border gives rise to informal cross-border trade, which allows traders to save the time and costs for compliance with formal procedures. Apart from informality, unique institutional arrangements have been emerging spontaneously in the border area that can reduce transaction costs in a way compatible with formal trade, thus augmenting cross-border trade. Based on observations of thriving trade at Myanmar’s border with China, we draw implications for the country’s general trade facilitation measures.
The Institute of Developing Economies (IDE) is a semigovernmental, nonpartisan, nonprofit research institute, founded in 1958. The Institute merged with the Japan External Trade Organization (JETRO) on July 1, 1998.
The Institute conducts basic and comprehensive studies on economic and related affairs in all developing countries and regions, including Asia, the Middle East, Africa, Latin America, Oceania, and Eastern Europe.
The views expressed in this publication are those of the author(s). Publication does not imply endorsement by the Institute of Developing Economies of any of the views expressed within.
INSTITUTE OF DEVELOPING ECONOMIES (IDE), JETRO 3-2-2, WAKABA,MIHAMA-KU,CHIBA-SHI
CHIBA 261-8545, JAPAN
©2016 by Institute of Developing Economies, JETRO
No part of this publication may be reproduced without the prior permission of the IDE-JETRO.
1
Myanmar’s Cross-border Trade with China: Beyond Informal Trade
1. Introduction
Myanmar’s trade with China is heavily concentrated in cross-border trade through the Yunnan province of China. According to Taguchi and Oizumi (2014), Yunnan province’s bilateral trade with Myanmar, which is approximately equivalent to the cross-border trade between the two countries, by far exceeds the normal level predicted by a gravity model of trade. From the viewpoint that trade would be concentrated in the channel where transaction costs are relatively low compared with those in other channels, we shed light on factors that yield such a concentration in this location.
The main trading node in Myanmar’s cross-border trade with China is Muse town, which is adjacent to China’s border town Ruili in Yunnan province. This trading node is on the Yangon–Mandalay–Muse/Ruili–Kunming corridor, and the segment between Mandalay and Kunming is labeled as Asian Highway No. 14.1 The segment between Mandalay and Muse spans 450 kilometers, and it goes through mountainous terrain with steep climbs and tight curves. Due to its poor road conditions, the transportation cost for Myanmar’s cross-border trade is not low (Ksoll and Quarmby 2014).
In the present paper, we focus on institutional factors of cross-border trade that may reduce transaction costs, making up for these high logistics costs. Weak law enforcement in the border area is likely to be a force giving rise to informal cross-border trade that allows traders to save the transaction costs for compliance with trade-related regulations. Apart from informality, we investigate institutional arrangements in the border area that may also reduce transaction costs. By identifying the institutional arrangements that are conducive for reducing transaction costs in cross-border trade, we aim to draw implications for Myanmar’s general trade promotion schemes.
This paper is organized as follows. Section 2 offers a brief review of the literature on Myanmar’s trade and cross-border trade. Section 3 examines trade statistics to draw characteristics of cross-border trade out of the entire volume of bilateral trade between
1
There is a sharp contrast between Asian Highway No. 14 (AH14) connecting Myanmar with China and Asian Highway No. 1 (AH1) connecting Myanmar with Thailand. In recent years, AH1 has attracted development aid from the international society for road Quality Improvement within the Myanmar section. In contrast, the Myanmar section of AH14 has been developed and maintained by a build–operate–transfer scheme of the Myanmar government with a Myanmar local contractor.
2
Myanmar and China. Section 4 overviews the regulatory environment of cross-border trade as well as formal initiatives for trade facilitation at the border. With a case study of Myanmar’s border trade of mango exports, Section 5 discusses institutional arrangements other than the formal initiatives that boost cross-border trade. Furthermore, we draw implications of thriving cross-border trade for a general trade promotion strategy. Section 6 summarizes the analyses and concludes the paper.
2. Literature review
Myanmar shares a land border with China’s land-locked Yunnan province. Thus, Yunnan’s provincial trade statistics for exports to and imports from Myanmar can be interpreted as representing cross-border trade between the two countries (Mya Than 2005; Kudo 2013).
Several empirical studies have quantitatively analyzed Myanmar’s cross-border trade with China.2 Using data on bilateral international trade flows for Yunnan province for the period from 1988 to 1999, Poncet’s (2006) gravity model of trade by finds that trade between Yunnan and Myanmar has progressively declined from an above-standard level to a normal level. In contrast, using updated data for the 2000–2012 periods, Taguchi and Oizumi (2014) show that Yunnan’s exports to and imports from Myanmar by far exceed the normal level predicted by the gravity model. In fact, Myanmar accounted for 53.3 percent of Yunnan’s exports and 33.9 percent of its imports in 2012.
Cross-border trade is often associated with informal trade. Lesser and Moise-Leeman (2009) illustrate that weak law enforcement at borders encourages firms engaged in cross-border trade to evade import and export duties and regulatory requirements.3 In
2
Myanmar’s cross-border trade with China is often discussed in the context of the economic integration of the Greater Mekong Sub-region (GMS). Apart from the papers cited in this paragraph, the empirical analysis by Edmonds and Fujimura (2008) using gravity trade model finds that the development of cross-border road infrastructure has had a positive impact on bilateral trade in the region.
3
In the context of Africa, there is a growing body of literature that sheds light on the significance of smuggling across land borders. These include Golub and Mbaye (2009) and Nkendah (2103) among others. Menon (1998) discusses the impacts of import tariff on smuggling in the context of the cross-border trade between Lao PDR and Thailand.
3
fact, Kubo (2012) shows that when cross-border trade accounts for a high proportion in Myanmar’s imports from China, there are considerable discrepancies between the trade values reported by authorities of the two countries; Myanmar’s statistics largely underestimate the country’s imports from China. This implies that informal trade has been an impetus for imports through cross-border trade. Nonetheless, the discrepancies in trade statistics represent only part of the conducted informal trade; Lesser and Moise-Leeman (2009) point out that trade flows exist that are not captured by the authorities of either exporting or importing countries.
More generally, modal choice of trade by businesses depends on transaction costs, and informality is just one factor that could reduce the transaction costs imposed by statutory regulations (Pohit and Taneja 2003). Furthermore, several factors other than informality can serve to reduce transaction costs of trade. Focusing on ethnicity and human networks, existing studies show that cross-border trade thrives where a common ethnicity or historical trading network spreads across the border, reducing the transaction costs of trade (Aker et al. 2014; Walther 2015).
In the present study, we explore institutional factors in cross-border trade that reduce these transaction costs of trade.
3. Insight from trade statistics
3.1 Classification of international trade
Myanmar’s authorities classify trade along two dimensions: by sector (government or private) and type of administration (normal or border). Border trade refers to overland trade with the four countries adjacent to Myanmar, namely Bangladesh, China, India, and Thailand.
The regulation that distinguishes normal trade from border trade holds that settlements of normal trade must be conducted through authorized dealer banks using currencies designated by the central bank,4 whereas this requirement is waived for border trade.5 Border trade settlements can be made using cash in either the local or trading partner’s currency. Furthermore, traders are allowed to make border trade settlements using off-shore bank accounts, typically an account in a bank on the
4
These are US dollars, Euros and Singapore dollars.
5
Therefore, technically, there can be normal trade in which shipments go through a land border but the settlement is through an authorized dealer bank using a designated hard currency.
4
opposite side of the border. Other procedural requirements are, however, the same for border and normal trade. Myanmar’s border trade is not a concessional scheme for promotion of economic activities by micro- and small-size traders in peripheral border areas, such as an exemption of import duties for micro-size traders residing in the border area.
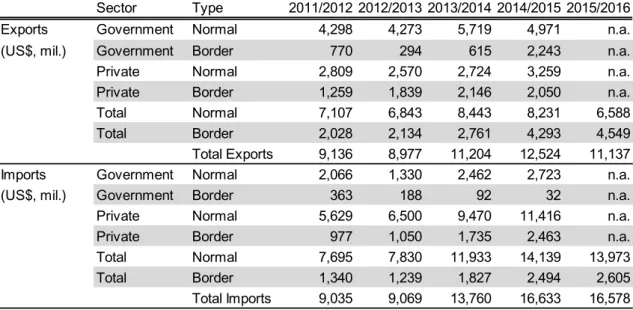
The summary of the trade flows by sector and administration type given in Table 1 confirms that the proportion of border trade out of the country’s total exports jumped from 22.2 percent in 2011 to 40.8 percent in 2015. This is largely due to natural gas exports to China via pipeline, which started in October 2013.6 This trade alone amounted to US$ 1.8 billion in 2015, or 16.4 percent of the country’s total exports. Natural gas has been the country’s top export, being exported by pipeline to Thailand and China. While natural gas exports to Thailand have been labeled as normal trade, exports to China have been classified as border trade, probably due to the latter’s settlement currency being the Chinese yuan. Also, natural gas exports are registered solely as the government export.
Table 1: Myanmar’s international trade by sector and type of administration,
FY2011–FY20157
Regarding the private sector, nearly two-fifths of Myanmar’s exports were border trade in 2014. The private sector’s border trade totaled 16.4 percent of the entire country’s aggregated exports and 14.8 percent of its imports. Border trade is a major trade channel for the economy, especially the private sector.
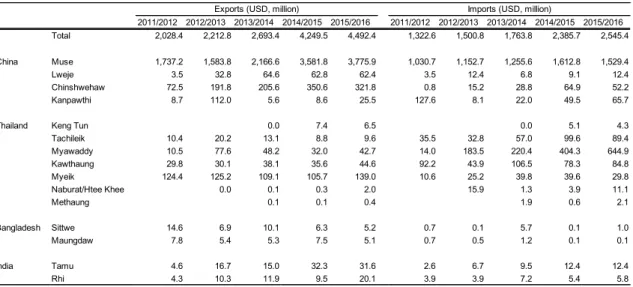
Table 2 summarizes the trends in border trade disaggregated by trade post, showing that China is by far the largest partner in border trade, followed by Thailand. In 2015, China accounted for 93.2 percent of Myanmar’s border trade exports and 65.1 percent of imports, respectively. The corresponding figures for Thailand were 5.4 percent and 33.5 percent. Border trade with Bangladesh and India was marginal.8
Table 2: Myanmar’s border trade by trade post, FY2011–FY2015
6
Note that the above-standard level of Yunnan’s trade measured by Taguchi and Oizumi (2014) is not due to natural gas since their estimation is for the period up to 2012.
7
Fiscal year runs from April 1 to March 31 of the next year.
8
Singh (2007) shows that the stagnant cross-border trade between India and Myanmar is due to political insecurity in India’s border area.
5
Two border posts stand out in terms of trade values: Muse, on the border with China, and Myawaddy, on the border with Thailand. The export value of the Muse border post has included natural gas since October 2013. Nonetheless, exports from Muse, with the exception of natural gas, amounted to around US$ 2 billion, which is 10 times more than exports from the second largest border post. Furthermore, border trade in Muse is bi-directional while that of Myawaddy mostly comprises Myanmar’s imports.
3.2 Position of cross-border trade in China’s trade with Myanmar
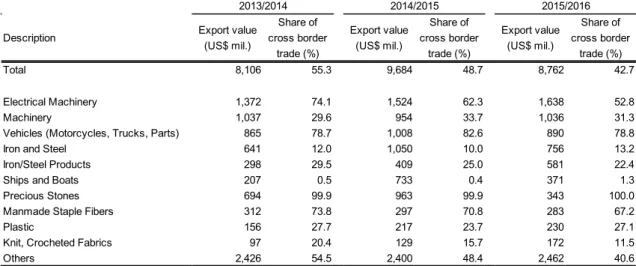
Using Chinese trade statistics, we investigate the characteristics of cross-border trade in China’s trade with Myanmar. China publishes breakdowns of trade statistics by customs offices. Regarding trade with Myanmar, the trade recorded by the Kunming customs office in Yunnan province can be regarded as the sum of cross-border trade with Myanmar (Mya Than 2005; Kudo 2013). Table 3 summarizes the top 10 export and import items (by two-digit HS code9) of China’s trade with Myanmar along with the share of cross-border trade for each item.
Table 3. Share of cross-border trade for China’s top 10 export/ import items traded with Myanmar, FY2013–FY2015
Generally, the pattern of trade between China and Myanmar is one wherein China exports industrial products and Myanmar exports primary products.10 China’s major manufactured exports include electrical machinery (for example, cellular phones), industrial machinery, motorcycles and intermediate materials. Myanmar’s exports are concentrated in a small number of commodities such as precious stones (jade), natural gas and wood. China’s exports of precious stones are considered to be returned goods.
Cross-border trade accounted for roughly a half of China’s trade with Myanmar. As for China’s exports, the share of cross-border trade out of China’s total exports reached 55.3 percent in 2013, declining to 48.7 percent in 2014 and 42.7 percent in 2015. As for China’s imports, cross-border trade amounted to 66.4 percent of total imports in 2013, 24.6 percent in 2014 and 55.2 percent in 2015. The decline in cross-border imports in 2014 is due to an exceptional rise in imports of precious stones (jade) recorded by the
9
Harmonized Commodity Description Coding System.
10
Coxhead (2007) finds the similar trade patterns for Southeast Asian countries in general and argues possible adverse effects on the growth paths for these countries.
6
Shenzhen and Chongqing customs offices, which totaled US$ 9.9 billion. If this amount was excluded from the total imports, the share of cross-border trade would rise to 73.6 percent in 2014.
Looking at shares of cross-border trade disaggregated by product, some notable tendencies emerge. Regarding China’s exports, the share of cross-border trade tends to be high for consumer goods such as electrical machinery (cellular phones) and vehicles (motorcycles), but low for industrial goods and intermediate goods including machinery, iron, steel and plastic. This is partially due to the nature of these products; heavy and bulky products not suitable for long-haul land transport would be exported by sea instead. A good example of this is ships and boats. At the same time, it might be the case that Myanmar’s consumer-goods importers prefer cross-border trade to circumvent import procedures. We will discuss this hypothesis later.
Regarding China’s imports, other than natural gas, which is exported by the pipeline, the proportion of cross-border trade is high for agricultural products including grains and rubber. However, this is not the full picture of cross-border trade. Some of Myanmar’s recorded exports do not appear in Chinese statistics at all, which we discuss in the next subsection.
3.3 Discrepancies in border trade statistics
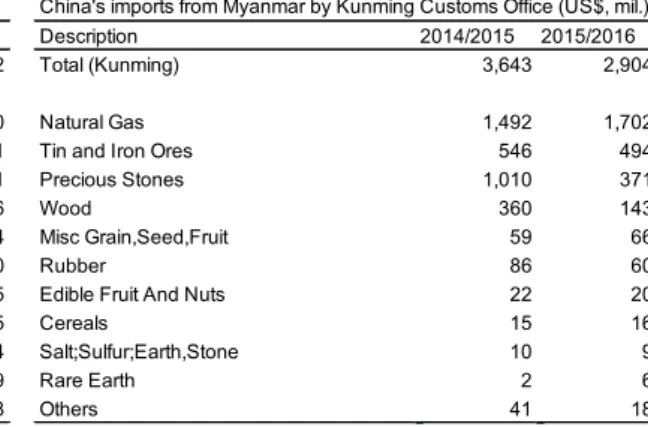
Table 4 compares statistics of border trade compiled by China Customs and Myanmar Customs. Each panel lists the top 10 items exported or imported in cross-border. Imports from Myanmar are often under-reported in Chinese statistics. Similarly, Myanmar statistics often under-report imports from China. Product classifications are not always compatible between these two statistics. However, there are several distinctive discrepancies, which are discussed next.
Table 4. Comparison of cross-border trade statistics, FY2014–FY2015
First, regarding Myanmar’s cross-border exports to China, agricultural and food products such as sugar, maize, beans, sesame seeds and melons do not appear individually in Chinese import statistics. These totaled US$ 1.3 billion in 2015, which by far exceeds the sum of corresponding China’s recorded agricultural imports (grain, edible fruits, cereals, etc.) which reached US$ 0.1 billion. These imply smuggling from Myanmar to China.
Second, there are notable discrepancies between Myanmar’s imports of electrical machinery and apparatus and China’s exports of electrical machinery. Myanmar’s
7
reported electrical machinery imports in 2015 were merely 18.2 percent of China’s reported exports. This gap implies Myanmar’s smuggling imports.
These figures are consistent with the conjecture that a considerable degree of smuggling has been occurring in Muse and that informality is one driving force of cross-border trade.
4. Institutional aspects of cross-border trade
4.1 Regulatory environment of cross-border trade
We will now review the regulatory environment surrounding cross-border trade at the Myanmar–China border. First of all, Myanmar’s cross-border trade regime is not a simplified trade regime for low-value consignments that do not exceed a certain threshold. Except for exemptions from trade settlement procedures, the processes are in principle the same for border trade and normal trade.
From the viewpoint that weak law enforcement at borders spurs firms to engage in cross-border trade, the time and costs for Myanmar’s importers to comply with trade regulations are considerable. First, import licenses from the Ministry of Commerce are required for each import contract.11 Second, imports are also subject to import duties, and the tariff rate for most consumer electrical machineries, including cellular phones and televisions, is 10 percent. Third, the advance corporate income tax is levied on imports (2 percent of import value) at the time of customs clearance while this tax payment is offset from corporate income tax liabilities of that importer. These procedures are all the same for border and normal trade. Thus, through informal trade at the border, importers can evade these trade costs.
For Myanmar’s exports, especially agricultural exports, China’s import controls have been influential. For example, China banned imports of rice from Myanmar on the basis of sanitary and phytosanitary (SPS) measures before granting an import quota of 100,000 tons for 2015. Thus, Myanmar’s exports of rice and broken rice until 2014 were informal trade, although Myanmar’s annual export amounted to around 700,000 tons in 2012 and 2013 (World Bank 2014). As China has implemented protective policies for
11
Previously, all tariff items except those on the negative list had required import licenses. Since August 2015, as a method of trade liberalization, import licenses have been imposed on only 4,405 tariff items on the positive list.
8
grains,12 wide gaps exist between Chinese domestic wholesale prices and border prices, which incentivize smuggling. The same story applies to sugar, a product for which Myanmar’s border-trade exports to China surged in 2015.13
The cases of Myanmar’s rice and sugar exports clearly illustrate that there has been no coordination on border controls between Myanmar Customs and China Customs. Rice and sugar exports were recorded as formal trade on the Myanmar side, whereas these were unrecorded, smuggling imports on China’s side. Analogously, some of China’s exports, in particular of electrical machinery, were recorded only partially on the Myanmar side. The absence of coordination between the two countries’ authorities at the border gives rise to informal trade, eventually fostering cross-border trade.
Furthermore, China’s stringent SPS measures for fresh fruits and vegetables are loosely applied at the land border with Myanmar. Imports from Myanmar by land border are exempt from the otherwise-required phytosanitary certificates from the exporting country’s authorities. This also reduces the trade costs for Myanmar exporters of the pertinent products.
4.2 Formal initiative for trade facilitation at the border
Apart from informality, formal initiatives exist for promotion of cross-border trade in Muse led by the Myanmar government. One is the above-mentioned exemption of the trade settlement requirement, which more than compensates for the absence of efficient international banking services in border areas.
Another is the one-stop service (OSS) trade zone near Muse, which is located 15 kilometers away from the border gate with China. The Muse trade zone houses six trade-related government offices including the Ministry of Commerce for export/import license applications, the Customs Department for customs clearance, and the Inland Revenue Department for payments of advance corporate income tax. The OSS trade zone is aimed to reduce the time needed for traders to comply with formal trade procedures.14
Furthermore, the government of Myanmar has designated the area between the Muse
12
See Gale (2015).
13
When the author interviewed Myanmar merchants in Muse in May 2016, many of them stated that sugar was the most profitable item for export, and that it would pay to import sugar from a third country and re-export it to China via border trade.
14
However, the Muse OSS trade zone is solely operated by the government of Myanmar, and it is not a single-window system of border control by authorities of two countries sharing the border.
9
trade zone and the border gate as a bonded area wherein import duties on retained goods are deferred and export goods can be stored after customs clearance out of Myanmar. Import duties are exempted for imported goods consumed within the bonded area. While evasion of import duties by individuals is tolerated, there are several inspection points and mobile inspection teams on the route between the Muse trade zone and cities for prevention of large-scale smuggling. Such inspections, however, often cause delays in transportation of imported goods from Muse to urban areas.
5. Case study: Myanmar’s mango exports to Yunnan
5.1 Supply chain of mangoes
To shed light on non-tangible institutional arrangements that may further reduce transaction costs for cross-border trade, we illustrate the flow of business using a case study of Myanmar’s mango exports to Yunnan. Mangoes are one of Myanmar’s agricultural products whose top export market is China. In addition, Myanmar was the top supplier of import mangoes in the Chinese market for the 2008–2013 periods.
Myanmar’s mango producers are linked to Chinese importers via the wholesale market in Muse. The major production areas of mangoes exported to China are Mandalay Division and southern Shan State, which are connected to the Muse border area by the Mandalay–Muse corridor. In Muse, an association of Myanmar merchants runs the wholesale market, where Chinese importers’ agents pay a daily visit across the border to participate in auctions during the harvest season (April to June). Approximately 40 Myanmar merchants receive above 100 Chinese buyers daily. Myanmar merchants serve as commission agents for suppliers, negotiating prices with Chinese buyers and receiving 3 to 5 percent of the sale value from the supplier as a commission fee. The wholesale market is located adjacent to the Muse trade zone, and the sold mangoes are sent to customs clearance immediately and delivered to the Chinese territory on the same day.
The border trade with China has provided producers in these areas with access to the export market. Before the border trade surged in the later 2000s, mangoes used to be sold wholly on the domestic market. Producers were mostly small farmers who were linked to markets by intermediaries (collectors and packers) who were also small and medium enterprises. They did not have access to other foreign markets in the 2000s. We could argue that the border trade, especially the wholesale market in Muse, lowered the hurdles to accessing the export market.
10
The Muse wholesale market serves several significant functions in Myanmar’s mango exports. First, it reduces the search costs for finding buyers/sellers. Those producers and marketing agents sending mangoes to the wholesale market are micro- and small-scale enterprises for whom finding buyers independently is not always easy. Owing to the existence of the wholesale market, they can export mangoes to China as easily as selling them on the domestic market. This is also true for the buyers from China.
Second, trading in the wholesale market near the border alleviates uncertainty regarding delivery time. For Chinese buyers, as the goods are already in the border area, they can easily be delivered to the Chinese territory. Given the underdeveloped transportation infrastructure in Myanmar, this is an advantage. For Myanmar producers, compared with arrangements required for shipping by ocean vessel, the logistics are much easier for land transport.
Third, centralized trading in the wholesale market would typically reduce fluctuations in price than would occur with decentralized trading. In addition, the agglomeration of businesses in the wholesale market has yielded growth in related businesses such as services for logistic operators and remittance services, which also reduce transaction costs.
Furthermore, the development of wholesale market is not peculiar to mangoes; there are equivalent wholesale markets for other fruits, including watermelon and musk melon, and grains, including rice. Since first emerging under private-sector initiatives in Muse, they have been proliferating.
5.2 China’s demand for Myanmar’s agricultural products
The growth of mango exports from Myanmar to China also owes much to China’s growing demand for agricultural products. In the face of China’s rapid economic growth and rising opportunity costs for labor in its agricultural sector, China’s agricultural imports are expected to continue to rise. The large price gap of agricultural products across the border is a significant pull factor of Myanmar’s exports.
Geographical proximity and seasonal differences also work favorably for Myanmar’s exports of tropical fruits, such as mangoes, that have short shelf lives. Geographical proximity is particularly important for perishable food items. Major mango production areas are within one day’s travel time by land from the border gate with China. This grants a competitive edge to Myanmar mangoes.
However, Myanmar’s mango exports face a risk of possible changes to China’s controls on cross-border trade. Currently, cross-border trade in Muse is a loophole in
11
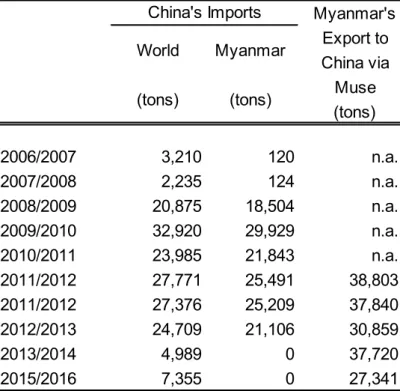
China’s stringent SPS measures. Table 5 contrasts China’s import data on mangoes with Myanmar’s export data. In Chinese statistics, Myanmar had been the top supplier until 2013, but imports from Myanmar disappeared in 2014 and 2015. Nonetheless, in Myanmar’s export data, exports maintained the momentum in 2014 and 2015. These data indicate that the cross-border mango trade is a gray area. Once China’s SPS measures are applied properly to border-trade imports from Myanmar, transaction costs of trade would rise for Myanmar’s exports.
Table 5. China’s mango imports versus Myanmar’s mango exports
5.3 Implications for trade facilitation
One notable feature of cross-border trade in Muse is that a large number of small firms are exporting to China, which makes a stark contrast with the country’s normal trade by sea, where a small number of large firms occupy the market. From the viewpoint of trade promotion, such participation in exports by a large number of small firms is worthy of further exploration. On the assumption that informal and small firms have low profitability compared to large firms,15 what factors serve to lower the transaction costs of trade, thus letting smaller firms participate in export businesses?
Certainly, one factor that reduces transaction costs is informality of cross-border trade. While mango exports go through formal trade-related procedures on the Myanmar side, they are not subject to the Chinese SPS measures. Accordingly, reducing the costs of compliance with importing countries’ SPS measures would facilitate access to the export market for small farmers and intermediaries of agricultural products. This involves the authorities undertaking trade negotiations with existing and potential importing countries on the one hand, and offering technical assistance to familiarize farmers and intermediaries with the regulations of importing countries.
We also focus on the function of Muse’s wholesale market, which reduces the search cost of finding buyers. When the search cost of finding importers is a fixed cost, it adversely impacts smaller businesses than for larger businesses since the former’s transaction size is small relative to the cost. In this context, commission agents in the Muse wholesale market transform fixed search costs into a cost proportional to the sales value. In any case, the search cost is one major transaction cost for exporters in Myanmar. In this regard, a possible policy option for trade promotion is to invite foreign
15
The survey article on the informal economy by La Porta and Shleifer (2014) shows that the self-employed and small firms have lower profitability compared with formal firms.
12
buyers to set up procurement offices in the country, which could function as a venue for small firms to meet foreign buyers, as in the Muse wholesale market. Myanmar authorities prohibited foreign investment in the area of international trade; the 2012 Foreign Investment Law of Myanmar prohibited foreign firms from registering as a trading company. The advantages and drawbacks of such discrimination against foreign firms should be reconsidered.
6. Concluding remark
Regarding the heavy concentration of Myanmar’s bilateral trade with China in the channel of cross-border trade in Muse, we qualitatively examined factors that account for such a concentration from the viewpoint that trade would be concentrated in the channel where transaction costs are relatively low. According to China’s trade statistics, 42.7 percent of China’s exports and 55.2 percent of imports in 2015 are considered to occur through the cross-border trade.
It is found that informal trade is an impetus for the concentration of trade at the border. Weak law enforcement at the border and an absence of cooperation between the two countries’ authorities incited firms to informal trade to save the transaction costs of compliance with trade–related procedures. Myanmar’s agricultural exports unrecorded in corresponding Chinese statistics suggest a considerable degree of smuggling, and so do China’s electrical machinery exports.
Apart from the informality of cross-border trade, we focused on the function of Muse’s wholesale markets, where daily agricultural-product auctions attract Chinese buyers across the border. By reducing the search costs of finding buyers, Muse’s wholesale markets have made the export market accessible to many small businesses, including farmers and intermediaries. As a policy implication emerging from this analysis of thriving cross-border trade, in relation to the reduction in search costs for small businesses to find foreign buyers, inviting foreign buyers to set up a procurement office in the country can be an option for trade promotion.
13
References
Aker, Jenny C., Michael W. Klein, Stephen A. O’Connell, and Muzhe Yang (2014). Borders, ethnicity and trade. Journal of Development Economics 107, pp. 1– 16.
Coxhead, Ian (2007). A new resource curse?: impacts of China’s boom on comparative advantage and resource dependence in Southeast Asia. World Development 35(7), pp. 1099–1119.
Edmonds, Christopher and Manabu Fujimura (2008) Impact of cross-border road infrastructure on trade and investment in the Greater Mekong Subregion. Integration and Trade 28(12), pp. 267–296.
Gale, Fred (2015). China’s evolving agricultural policy. Unpublished presentation material. US Department of Agriculture.
http://www.iica.int/sites/default/files/events/presentations/2015-10/chinaocos_evolving_ agricultural_policy_fred-gale-english.pdf
Golub, Stephen S., and Ahmadou Aly Mbaye (2009). National trade policies and smuggling in Africa: the case of the Gambia and Senegal. World Development 37(3), pp. 595–606.
Ksoll, Christian and John Quarmby (2014) Private sector views on road transport along the Yangon – Mandalay – Muse/Ruili – Kunming corridor. Greater Mekong Subregion Business Forum.
http://www.gms-cbta.org/uploads/resources/15/attachment/Private_Sector_Views_on_R oad_Transport_in_Myanmar.pdf
Kubo, Koji (2012). Trade policies and trade misreporting in Myanmar. ASEAN Economic Bulletin 29(2), pp. 146–159.
Kudo, Toshihiro (2013). Myanmar’s border Trade with China: roads, gates, and peace. In: Ishida, M. (ed.) Border Economies in the Greater Mekong Sub–region., pp. 279–295, Palgrave Macmillan, Hampshire and New York.
14
La Porta, Rafael, and Andrei Shleifer (2014). Informality and Development. Journal of Economic Perspectives 28(3), pp. 109–126.
Lesser, Caroline, and Evdokia Moise-Leeman (2009). Informal cross-border trade and trade facilitation in sub–Saharan Africa. OECD Trade Policy Working Paper 86. Organisation for Economic Co–operation and Development, Paris.
Menon, Jayant (1998). Lao PDR in the ASEAN free trade area: trade, revenue and investment implications. Pacific Economic Papers 276, Canberra, Australian National University.
Mya Than (2005). Myanmar’s cross-border economic relations and cooperation with the People’s Republic of China and Thailand in the Greater Mekong Subregion. Journal of GMS Development Studies 2(1), pp. 37–54.
Nkendha, Robert (2013). Estimating the informal cross-border trade of agricultural and horticultural commodities between Cameroon and its CEMAC neighbours. Food Policy 41, pp. 133–144.
Pohit, Sanjib, and Nisha Taneja (2003). India’s informal trade with Bangladesh: a qualitative assessment. World Economy 26(8), pp. 1187–1214.
Poncet, Sandra (2006). Economic integration of Yunnan with the Greater Mekong Subregion. Asian Economic Journal 20(3), pp. 303–317.
Singh, Thiyam Bharat (2007). India’s border trade with its neighbouring countries with special reference to Myanmar. Margin: The Journal of Applied Economic Research 1(4), pp. 359–382.
Taguchi, Hiroyuki and Keiichiro Oizumi (2014). Trade integration of Yunnan and Guangxi with the Greater Mekong Sub–region re–visited. China Economic Policy Review 3(1), pp.1–14.
Walther, Olivier J. (2015). Business, brokers and borders: the structure of West African trade networks. Journal of Development Studies 51(5), pp. 603–620.
15
World Bank (2014). Myanmar: capitalizing on rice export opportunities. Economic and sector work report No. 85804, World Bank, Bangkok.
16
Table 1: Myanmar’s international trade by sector and type of administration, FY2011–FY2015
Source: Myanmar Ministry of Commerce website
Sector Type 2011/2012 2012/2013 2013/2014 2014/2015 2015/2016
Exports Government Normal 4,298 4,273 5,719 4,971 n.a.
(US$, mil.) Government Border 770 294 615 2,243 n.a.
Private Normal 2,809 2,570 2,724 3,259 n.a.
Private Border 1,259 1,839 2,146 2,050 n.a.
Total Normal 7,107 6,843 8,443 8,231 6,588
Total Border 2,028 2,134 2,761 4,293 4,549
Total Exports 9,136 8,977 11,204 12,524 11,137
Imports Government Normal 2,066 1,330 2,462 2,723 n.a.
(US$, mil.) Government Border 363 188 92 32 n.a.
Private Normal 5,629 6,500 9,470 11,416 n.a.
Private Border 977 1,050 1,735 2,463 n.a.
Total Normal 7,695 7,830 11,933 14,139 13,973
Total Border 1,340 1,239 1,827 2,494 2,605
17
Table 2: Myanmar’s border trade by trade post, FY2011–FY2015
Source: Myanmar Ministry of Commerce website
2011/2012 2012/2013 2013/2014 2014/2015 2015/2016 2011/2012 2012/2013 2013/2014 2014/2015 2015/2016 Total 2,028.4 2,212.8 2,693.4 4,249.5 4,492.4 1,322.6 1,500.8 1,763.8 2,385.7 2,545.4 China Muse 1,737.2 1,583.8 2,166.6 3,581.8 3,775.9 1,030.7 1,152.7 1,255.6 1,612.8 1,529.4 Lweje 3.5 32.8 64.6 62.8 62.4 3.5 12.4 6.8 9.1 12.4 Chinshwehaw 72.5 191.8 205.6 350.6 321.8 0.8 15.2 28.8 64.9 52.2 Kanpawthi 8.7 112.0 5.6 8.6 25.5 127.6 8.1 22.0 49.5 65.7 Thailand Keng Tun 0.0 7.4 6.5 0.0 5.1 4.3 Tachileik 10.4 20.2 13.1 8.8 9.6 35.5 32.8 57.0 99.6 89.4 Myawaddy 10.5 77.6 48.2 32.0 42.7 14.0 183.5 220.4 404.3 644.9 Kawthaung 29.8 30.1 38.1 35.6 44.6 92.2 43.9 106.5 78.3 84.8 Myeik 124.4 125.2 109.1 105.7 139.0 10.6 25.2 39.8 39.6 29.8 Naburat/Htee Khee 0.0 0.1 0.3 2.0 15.9 1.3 3.9 11.1 Methaung 0.1 0.1 0.4 1.9 0.6 2.1 Bangladesh Sittwe 14.6 6.9 10.1 6.3 5.2 0.7 0.1 5.7 0.1 1.0 h Maungdaw 7.8 5.4 5.3 7.5 5.1 0.7 0.5 1.2 0.1 0.1 India Tamu 4.6 16.7 15.0 32.3 31.6 2.6 6.7 9.5 12.4 12.4 Rhi 4.3 10.3 11.9 9.5 20.1 3.9 3.9 7.2 5.4 5.8
18
Table 3. Share of cross-border trade for China’s top 10 export/import items traded with Myanmar, FY2013–FY2015
(A) China’s exports to Myanmar
(B) China’s imports from Myanmar
Source: China Customs
Description Export value(US$ mil.)
Share of cross border trade (%) Export value (US$ mil.) Share of cross border trade (%) Export value (US$ mil.) Share of cross border trade (%) Total 8,106 55.3 9,684 48.7 8,762 42.7 Electrical Machinery 1,372 74.1 1,524 62.3 1,638 52.8 Machinery 1,037 29.6 954 33.7 1,036 31.3 Vehicles (Motorcycles, Trucks, Parts) 865 78.7 1,008 82.6 890 78.8 Iron and Steel 641 12.0 1,050 10.0 756 13.2 Iron/Steel Products 298 29.5 409 25.0 581 22.4 Ships and Boats 207 0.5 733 0.4 371 1.3 Precious Stones 694 99.9 963 99.9 343 100.0 Manmade Staple Fibers 312 73.8 297 70.8 283 67.2
Plastic 156 27.7 217 23.7 230 27.1
Knit, Crocheted Fabrics 97 20.4 129 15.7 172 11.5 Others 2,426 54.5 2,400 48.4 2,462 40.6
2013/2014 2014/2015 2015/2016
Description Export value(US$ mil.)
Share of cross border trade (%) Export value (US$ mil.) Share of cross border trade (%) Export value (US$ mil.) Share of cross border trade (%) Total 3,635 66.4 14,834 24.6 5,262 55.2 Precious Stones 1,615 44.6 11,561 8.7 2,310 16.1 Natural Gas 386 100.0 1,492 100.0 1,702 100.0 Tin and Iron Ores 450 97.9 550 99.2 495 99.6
Wood 759 82.8 434 83.0 169 84.8
Iron and Steel 16 0.0 369 0.0 166 0.0 Misc Grain, Seed, Fruit 61 91.5 63 93.7 69 95.3
Rubber 113 87.6 94 91.3 64 93.6
Copper Cathodes 32 0.0 48 0.0 58 0.0
Woven Apparel 37 0.0 33 0.0 34 0.0
Fish and Seafood 54 5.8 48 12.0 29 15.0
Others 112 69.6 143 59.6 164 39.2
19
Table 4. Comparison of cross-border trade statistics, FY2014–FY2015 (A) Myanmar’s exports by cross-border trade
(B) Myanmar’s imports by cross-border trade
Sources: Myanmar Customs; China Customs
Myanmar's exports to China by Muse Customs Office (US$, mil.) China's imports from Myanmar by Kunming Customs Office (US$, mil.) Description 2014/2015 2015/2016 Description 2014/2015 2015/2016
Total (Muse) 4,033 4,242 Total (Kunming) 3,643 2,904
Natural Gas 1,471 1,830 Natural Gas 1,492 1,702
Rice 419 341 Tin and Iron Ores 546 494
Sugar n.a. 331 Precious Stones 1,010 371
Jade 728 306 Wood 360 143
Maize 391 304 Misc Grain,Seed,Fruit 59 66
Beans 186 160 Rubber 86 60
Sesamum Seeds 154 105 Edible Fruit And Nuts 22 20
Marine Products 90 85 Cereals 15 16
Melon 94 84 Salt;Sulfur;Earth,Stone 10 9
Broken Rice 79 79 Rare Earth 2 6
Others 421 618 Others 41 18
Myanmar's imports from China by Muse Customs Office (US$, mil.) China's exports to Myanmar by Kunming Customs Office (US$, mil.) Description 2014/2015 2015/2016 Description 2014/2015 2015/2016
Total (Muse) 1,835 1,709 Total (Kunming) 4,719 3,740
Transport Equipment 689 562 Electrical Machinery 950 865
Base Metals and Manufactures 225 235 Vehicles (Motor Cycles, Trucks, Parts) 832 701 Electrical Machinery and Apparatus 141 157 Precious Stones 962 343
Fertilizer 160 153 Machinery 321 324
Machinery and Mechanical Appaliance 152 136 Manmade Staple Fibers 210 190
Plastic and Articles Thereof 47 57 Mineral Fuel 239 148
Chemical Elements and Compounds 19 24 Iron/Steel Products 102 130
Cement 19 22 Edible Fruit and Nuts 85 113
Rubber Manufactures n.a. 15 Iron and Steel 105 100
Scientific Instruments n.a. 14 Aluminum 46 87
20
Table 5. China’s mango imports versus Myanmar’s mango exports
Sources: China Customs; Myanmar Fruit, Flower and Vegetable Producer and Exporter Association. World (tons) Myanmar (tons) 2006/2007 3,210 120 n.a. 2007/2008 2,235 124 n.a. 2008/2009 20,875 18,504 n.a. 2009/2010 32,920 29,929 n.a. 2010/2011 23,985 21,843 n.a. 2011/2012 27,771 25,491 38,803 2011/2012 27,376 25,209 37,840 2012/2013 24,709 21,106 30,859 2013/2014 4,989 0 37,720 2015/2016 7,355 0 27,341
China's Imports Myanmar's Export to China via Muse (tons)