ORIGINAL
Clinical application of dynamic
18F-fluorodeoxyglucose
positron-emission tomography / computed tomography
in the differential diagnoses of musculoskeletal lesions
Takayoshi Shinya1, 2, 3, Yoichi Otomi1, Toshihiko Nishisho4, Bettina Beuthien-Baumann2, Saho Irahara1, Michiko Kubo1, Hideki Otsuka5, Yoshimi Bando6, Koichi Sairyo4, and Masafumi Harada1
1Department of Radiology, Tokushima University Hospital. 2-50-1, Kuramoto-cho, Tokushima City, Tokushima, 770-8503, Japan, 2Division of Radiology, German Cancer Research Centre (DKFZ), Im Neuenheimer Feld 280, 69120, Heidelberg, Germany, 3Department of Diagnostic and Therapeutic Radiology, Kawasaki Medical School General Medical Center, 2-6-2 Nakasange, Kita-ku, Okayama City, Okayama, 700-8505, Japan, 4Department of Orthopedics, Institute of Biomedical Sciences, Tokushima University Graduate School, 3-18-15 Kuramoto-cho, Tokushima-city, 770-8503, Tokushima, Japan, 5Department of Medical Imaging/Nuclear Medicine, Institute of Biomedical Sciences, Tokushima University Graduate School. 2-50-1, Kuramoto-cho, Tokushima City, Tokushima, 770-8503, Japan, 6Division of Pathology, Tokushima University Hospital. 2-50-1, Kuramoto-cho, Tokushima City, Tokushima, 770-8503, Japan
Abstract : We aimed to assess the differential diagnostic efficacy of dynamic F-18 fluorodeoxyglucose (FDG) pos-itron emission tomography / computed tomography (PET / CT) and to evaluate the appropriate scan timings for diagnosis of musculoskeletal lesions (MSLs). Dynamic scans (5–15 [phase 1], 15–25 [phase 2], and 25–35 [phase 3] min after F-18 FDG injection) and dual-time-point scans (1 and 2 h after injection) were acquired for 23 MSLs [4 benign MSLs (BMSLs). 10 primary malignant musculoskeletal tumors (PMMSTs), and 9 metastatic musculoskel-etal tumors (MMSTs)]. We compared the maximum standardized uptake values (SUVmax) and corresponding retention indices for dynamic (RI-SUVdyn) and dual-time-point (RI-SUVdual) scans and evaluated diagnostic efficacy using receiver operating characteristic (ROC) curve analyses. The SUVmax gradually decreased or was almost identical with minimal fluctuation in 3 BMSLs and 1 PMMST. SUVmax increased over time after phase 2 in 18 malignant MSLs (MMSLs). There were significant differences in SUVmax (for all time phases) and RI-SUV dual between BMSLs and MMSLs and between PMMSTs and MMSTs. In the ROC analyses, the areas under the curve for SUV in phases 2 and 3 were highest for differentiating BMSLs from MMSLs and PMMSTs from MMSTs, respectively. Dynamic F-18 FDG PET / CT is valuable for diagnosis of musculoskeletal lesions. J. Med. Invest. 68 : 96-104, February, 2021
Keywords : bone and soft tissue tumors, dynamic scan, musculoskeletal lesion, positron emission tomography computed tomography, sarcoma
INTRODUCTION
Bone and soft tissue tumors have several physiological, bio-chemical, and genetic characteristics. In clinical practice, or-thopedic surgeons and radiologists encounter musculoskeletal lesions (MSLs) of unknown origin. It is important to differen-tiate the benign and malignant lesions to justify performing a biopsy and initiating optimal treatment. However, differentiat-ing between the lesions can be difficult without typical imagdifferentiat-ing findings, leading to a diagnostic dilemma with respect to benign MSLs (BMSLs), primary malignant musculoskeletal tumors (PMMSTs), and metastatic musculoskeletal tumors (MMSTs). In patients with typical imaging findings or with a metastatic primary site, MSLs can be diagnosed using conventional mor-phologic imaging and metabolic imaging modalities, such as plain radiography, computed tomography (CT), and magnetic resonance imaging (MRI). Functional imaging techniques, including Tl-201 scintigraphy, Tc-99m (V) dimercaptosuccinic acid (DMSA) scintigraphy, and positron emission tomography (PET), are used to obtain complementary information in specific clinical situations (1-6). However, the morphological appearance
and metabolism of these tumors overlap, and a reliable imaging method is not available to date.
Recently, several studies have reported absolute PET quantifi-cation of physiological parameters using tracer kinetic modeling (7-12). Dynamic PET imaging is expected to aid in understand-ing the pathophysiological mechanisms of diseases and extract-ing physiological or biochemical parameters via tracer kinetics. Despite its value, dynamic PET imaging with kinetic model analysis is primarily confined to research centers and not used in busy clinical settings, mainly because it is technically de-manding (13). Technical developments in 18F-fluorodeoxyglucose (FDG) PET / CT using dynamic scans have enabled the estima-tion of perfusion-dependent FDG uptake and metabolic activ-ity in various tumors (14-18). Recent studies have shown that dynamic PET / CT in list-mode, without kinetic model analysis, can be a simple tool for predicting pathological and clinicopath-ological tumor characteristics (14, 15, 19, 20). However, to our knowledge, no studies have reported the diagnostic performance of dynamic 18F-FDG PET / CT in list-mode for differentiation be-tween BMSLs and malignant musculoskeletal lesions (MMSLs), and between PMMSTs and MMSTs.
The present study aimed to assess the efficacy of early dy-namic PET / CT scanning with list-mode and dual-time-point (DTP) PET / CT scanning to differentiate between malignant and benign lesions in patients with newly diagnosed MSLs. We also compared the diagnostic capacity of dynamic PET / CT and DTP PET / CT for MMSLs and identified the most appropriate imaging phase for differentiating between the MSLs.
The Journal of Medical Investigation Vol. 68 2021
Received for publication October 5, 2020 ; accepted November 20, 2020.
Address correspondence and reprint requests to Takayoshi Shinya, Department of Diagnostic and Therapeutic Radiology, Kawasaki Medical School General Medical Center, 2-6-2 Nakasange, Kita-ku, Okayama City, Okayama, 700-8505, Japan and Fax : +81-86-232-8343.
PATIENTS AND METHODS
All procedures performed in this study that involved human participants were in accordance with the ethical standards of the institutional research committee and with the 1964 Helsinki Declaration and its later amendments or comparable ethical standards. This study was approved by the Ethics Committee of Tokushima University Hospital (Approval number 2606). Informed consent was obtained from all participants included in the study.
Study population
We included patients with MSLs of unknown origin, for whom the diagnosis was finally determined by pathological examina-tions. Additional inclusion criteria were as follows : no therapy for MSLs before PET / CT and no history of malignancy within the last 3 years.
18F-FDG PET/CT procedures
Before intravenous injection of 18F-FDG (8.0 × 10⁻⁵ Ci / kg of body weight), all patients fasted for > 5 h and achieved a blood glucose level of < 150 mg / dL. PET / CT was conducted using a single PET / CT system (Discovery PET / CT 710 ; GE Health-care, Chicago, IL, USA) enabled with list-mode data acquisition function and four-dimensional data acquisition (i.e., dynamic scanning). The protocol included 3 acquisitions : (1) dynamic PET acquisition (limited to the single-bed position), (2) low-dose CT scan centered on the largest MSL of interest and initiated 5 min after 18F-FDG injection, and (3) DTP static PET / CT scan of the torso (lasting approximately 12–16 min). All participants underwent dynamic and DTP PET / CT examinations with their upper limbs down.
During the first acquisition, low-dose CT was performed to determine PET attenuation correction, anatomical information, and image fusion. During the second acquisition, dynamic 18 F-FDG PET / CT was performed as list-mode continuous scanning, beginning 5 min after FDG bolus injection and continuing for 30 min, with every measured value stored as raw data with the exact time stamp. The dynamic series were acquired with the field of view over the lesions of interest (limited to a single-bed position, with longitudinal coverage of 15.042 cm). Patients were asked to lie motionless during dynamic scanning. We subse-quently reconstructed the data as 3 frames at 600-s intervals. The list-mode files were reconstructed on the PET / CT scanner using three-dimensional, attenuation-weighted, ordered-subset, expectation maximization, with 2 iterations and 16 subsets (VUE Point FX ; GE Healthcare), a 4-mm post-reconstruc-tion Gaussian filter, attenuapost-reconstruc-tion image segmentapost-reconstruc-tion, and a 192 × 192-pixel matrix. The patient then waited in a waiting room before returning to the scanner for the subsequent proce-dure, conducted 60 min after tracer injection.
The DTP PET / CT scanning region for the 1-h early scan en-compassed the body from the skull vertex to the knee, and for the 2-h delayed scan, it encompassed the field of view over the MSL of interest. Before conducting DTP PET / CT, a second low-dose CT scan was immediately performed for attenuation correction over the shooting range. The early and delayed PET scans were acquired at 8- and 4-bed positions and for 120 and 180 s, respec-tively. For each scan, we used the same image reconstruction method used for dynamic FDG PET.
PET/CT image analysis
The dynamic and DTP PET / CT images were reviewed by 2 nuclear medicine physicians (with > 15 years of experience) blinded to all clinical, pathological, and other imaging findings. In case of disagreement, they reached a consensus via discussion.
Any obvious foci within the MSL that showed increased FDG uptake relative to the surrounding tissue, which could not be explained by the physiological uptake of the tracer in these sites, were considered positive.
Using the PET / CT images, we carefully placed the volume of interest (VOI) on the MSL to exclude FDG accumulation in the normal tissue and large vessels, and circular VOIs were drawn to encompass each lesion contour on transaxial images. These VOIs were placed after consensus was reached between the 2 nuclear medicine physicians.
For the semiquantitative analysis of FDG uptake, we adopted the standardized uptake value (SUV), which was calculated, as follows :
SUV = concentration of radioactivity (Ci / kg) × [lean body mass (kg) / injected radioactivity (Ci)]
To minimize partial-volume effects, SUVmax within VOIs was used. SUVmax was measured for each dynamic phase (SUV1, 5–15 min ; SUV2, 15–25 min ; and SUV3, 25–35 min), the 1-h early phase (SUV4), and the 2-h delayed phase (SUV5). Furthermore, we calculated the retention index (RI)-SUVmax from the SUVmax as follows :
Retention index of the dynamic phase SUVmax (RI-SUV-dyn [%]) = (SUV3 – SUV1) × 100 / SUV1
Retention index of DTP SUV (RI-SUVdual [%]) = (SUV5 [delayed scan] – SUV4 [early scan]) × 100 / SUV4 (early scan).
In addition, we calculated the mean SUV (SUVmean) for each subject.
The maximal diameter of each tumor lesion was measured on axial low-dose CT images.
Statistical analysis
To analyze differences in SUVmax among different phases, RI-SUVdyn, and RI-SUVdual, we employed the Mann–Whitney U-test for comparisons between BMSLs and MMSLs and the Kruskal–Wallis test followed by the Steel–Dwass test for com-parisons among BMSLs, PMMSTs, and MMSTs.
If the Mann–Whitney U-test and Kruskal–Wallis test fol-lowed by the Steel–Dwass test revealed a significant difference in each index among the groups, we performed additional receiv-er opreceiv-erating charactreceiv-eristic (ROC) curve analyses for SUVmax and RI-SUVmax to evaluate the predictive performance of these indices in differentiating between MSL types. Discriminatory ability was assessed using the area under the ROC curve (AUC) values. We determined the optimal cut-off values that maxi-mized the sensitivity and specificity for each index and the corre-sponding sensitivity, specificity, positive predictive value (PPV), negative predictive value (NPV), and accuracy. Significant differences between 2 AUC values were assessed using Delong’s test. All statistical analyses were conducted using EZR version 1.37 (Saitama Medical Center, Jichi Medical University, Saitama, Japan ; available at www.jichi.ac.jp / saitama-sct / SaitamaHP. files / statmedEN.html), a graphical user interface for R (The R Foundation for Statistical Computing, Vienna, Austria) (21). Statistical significance was set at p < 0.05.
RESULTS
Patient and tumor characteristics
The patient and tumor characteristics are presented in Table 1. Between January 2016 and October 2016, 19 patients met the inclusion criteria and underwent dynamic and DTP 18F-FDG
PET / CT (12 men, 7 women ; age [mean ± SD] 69.21 ± 10.40, range 37–81 years). Twenty-three lesions were identified as bone and soft tissue lesions on PET / CT evaluations (15 soft tissue, 8 bone). The MSLs were classified according to the WHO Classifi-cation of Tumours of Soft Tissue and Bone, Fourth Edition (22), by pathologists blinded to the PET results. Histopathologically, 4 lesions (17%) were classified as BMSLs, 10 (44%) as PMMSTs (soft tissue tumors : 7 grade [G] 2 ; bone tumors : 2 G2 and 1 G3), and 9 (39%) as MMSTs. Of the 4 bone metastases, 3 were soli-tary bone tumors.
The tumor diameters ranged from 20 to 245 mm, with most le-sions having a long-axis diameter of < 60 mm. There was no sig-nificant between-group difference in the tumor size (p = 0.117). Visual evaluation
All MMSLs and 2 BMSLs were FDG-positive on all dynamic phases and the 1-h early and 2-h delayed phases. In contrast, one osteochondroma was FDG-negative on all dynamic phases and the 1-h early and 2-h delayed phases, and another osteochon-droma was negative on the dynamic first and second phases but positive on the dynamic third phase and the 1-h early and 2-h delayed phases.
SUVs and RI-SUVmax
SUVmax, RI-SUVmax, and SUVmean values are summa-rized in Tables 2 and 3. SUV1 was slightly higher than SUV2 for 2 BMSLs and 5 PMMSTs. For all other lesions, SUV2 was high-er than SUV1. Afthigh-er the dynamic second phase, SUVmax grad-ually decreased or was near identical, with little fluctuation, for 3 BMSLs and 1 PMMST. In contrast, SUVmax increased over time after the dynamic second phase for 1 BMSL, 8 PMMSTs, and all MMSTs.
SUVmax for each time phase and RI-dual were signifi-cantly higher for MMSLs than for BMSLs (p = 0.012 for
SUV1 ; p = 0.00158 for SUV2 ; p = 0.00158 for SUV3 ; p = 0.00581 for SUV4 ; p = 0.00158 for SUV5 ; p = 0.00858 for RI-dual). All SUVmax values were significantly higher for PMMSTs than for BMSLs (p = 0.04771 for SUV1 ; p = 0.01621 for SUV2 ; p = 0.0162
for SUV3 ; p = 0.0195 for SUV4 ; p = 0.0162 for SUV5). All meta-bolic parameters were significantly higher for MMSTs than for BMSLs (p = 0.01355 for SUV1 ; p = 0.00548 for SUV2, SUV3, SUV4, and SUV5 ; p = 0.006851 for RI-dyn ; p = 0.0005479 for RI-dual). SUVmax for each time phase and RI-dyn were significantly higher for MMSTs than for PMMSTs (p = 0.0143 for
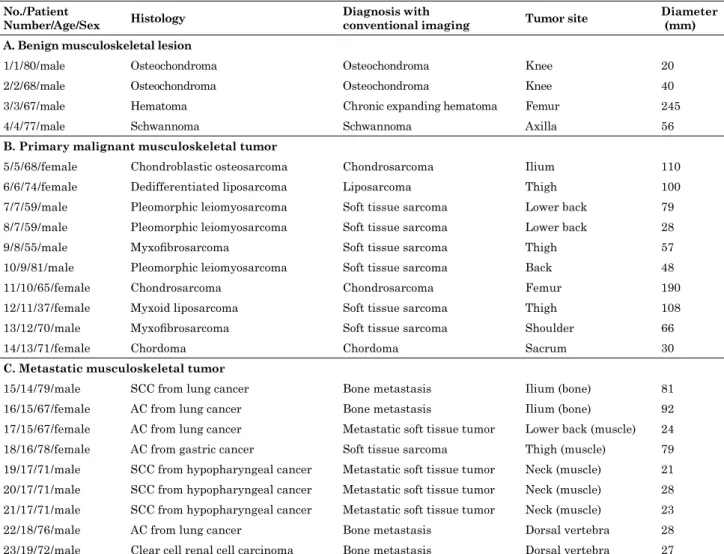
Table 1. Characteristics of the patients and tumors
No./Patient
Number/Age/Sex Histology Diagnosis with conventional imaging Tumor site Diameter (mm)
A. Benign musculoskeletal lesion
1 / 1 / 80 / male Osteochondroma Osteochondroma Knee 20
2 / 2 / 68 / male Osteochondroma Osteochondroma Knee 40
3 / 3 / 67 / male Hematoma Chronic expanding hematoma Femur 245
4 / 4 / 77 / male Schwannoma Schwannoma Axilla 56
B. Primary malignant musculoskeletal tumor
5 / 5 / 68 / female Chondroblastic osteosarcoma Chondrosarcoma Ilium 110 6 / 6 / 74 / female Dedifferentiated liposarcoma Liposarcoma Thigh 100 7 / 7 / 59 / male Pleomorphic leiomyosarcoma Soft tissue sarcoma Lower back 79 8 / 7 / 59 / male Pleomorphic leiomyosarcoma Soft tissue sarcoma Lower back 28
9 / 8 / 55 / male Myxofibrosarcoma Soft tissue sarcoma Thigh 57
10 / 9 / 81 / male Pleomorphic leiomyosarcoma Soft tissue sarcoma Back 48
11 / 10 / 65 / female Chondrosarcoma Chondrosarcoma Femur 190
12 / 11 / 37 / female Myxoid liposarcoma Soft tissue sarcoma Thigh 108 13 / 12 / 70 / male Myxofibrosarcoma Soft tissue sarcoma Shoulder 66
14 / 13 / 71 / female Chordoma Chordoma Sacrum 30
C. Metastatic musculoskeletal tumor
15 / 14 / 79 / male SCC from lung cancer Bone metastasis Ilium (bone) 81 16 / 15 / 67 / female AC from lung cancer Bone metastasis Ilium (bone) 92 17 / 15 / 67 / female AC from lung cancer Metastatic soft tissue tumor Lower back (muscle) 24 18 / 16 / 78 / female AC from gastric cancer Soft tissue sarcoma Thigh (muscle) 79 19 / 17 / 71 / male SCC from hypopharyngeal cancer Metastatic soft tissue tumor Neck (muscle) 21 20 / 17 / 71 / male SCC from hypopharyngeal cancer Metastatic soft tissue tumor Neck (muscle) 28 21 / 17 / 71 / male SCC from hypopharyngeal cancer Metastatic soft tissue tumor Neck (muscle) 23 22 / 18 / 76 / male AC from lung cancer Bone metastasis Dorsal vertebra 28 23 / 19 / 72 / male Clear cell renal cell carcinoma Bone metastasis Dorsal vertebra 27 AC : adenocarcinoma, SCC : squamous cell carcinoma.
SUV1 ; p = 0.00145 for SUV2 ; p = 0.000605 for SUV3 ; p = 0.00898 for SUV4 ; p = 0.00898 for SUV5 ; p = 0.000815 for RI-dyn).
Figures 1, 2, and 3 show representative dynamic and DTP 18F-FDG PET / CT images of MMSTs, PMMSTs, and BMSLs. Figure 4 shows the change in median SUVmax values for each time phase per study group.
ROC curves and cut-off values for SUVmax and RI-SUVmax
Tables 4 and 5 show the threshold (i.e., cut-off) values for each parameter and the resulting sensitivity, specificity, PPV, NPV, and accuracy for discriminating between MMSLs and BMSLs and between MMSTs and PMMSTs.
For differentiating MMSLs from BMSLs, the cut-off values yielded the highest sensitivity of 94.7% and highest specificity of 100.0%, with PPV, NPV, and accuracy values of 94.7%, 100.0%,
and 95.7%, respectively, for SUVmax analyses in the dynamic second phase. Compared with the AUC derived in all other ROC analyses, that for SUV2 was the largest at 0.987 ; however, Delong’s test did not reveal any significant differences among the AUC values for all parameters (p > 0.05 for all).
For differentiating between the MMSTs and PMMSTs, the cut-off values yielded the highest sensitivity of 100.0% and high-est specificity of 90.0%, with PPV, NPV, and accuracy values of 90.0%, 100.0%, and 94.0%, respectively, for the SUVmax analy-ses in the dynamic third phase and RI-SUVdyn. Compared with the AUC derived in all other ROC analyses, that for SUV3 was the largest at 0.967 ; however, Delong’s test did not reveal any significant differences among the AUC values for all parameters (p > 0.05 for all).
Table 2. SUVmax and RI-SUVmax values at each time-point in each group
BMSL MMSL PMMST MMST SUV1 2.53 ± 0.75 4.48 ± 0.35 4.53 ± 0.26 5.72 ± 0.56 (1.45–4.57) (2.57–8.83) (2.57–5.21) (3.69–8.83) SUV2 2.59 ± 0.41 5.29 ± 0.51 4.19 ± 0.71 6.58 ± 0.34 (1.92–3.65) (2.49–10.65) (2.49–6.00) (4.78–10.65) SUV3 2.57 ± 0.37 6.29 ± 0.64 4.39 ± 0.45 7.58 ± 0.79 (1.46–3.01) (2.50–12.21) (2.50–7.08) (6.29–12.21) SUV4 2.56 ± 0.97 9.66 ± 0.20 6.23 ± 1.01 10.77 ± 1.15 (1.86–2.73) (2.53–17.23) (2.53–12.03) (8.57–17.23) SUV5 2.41 ± 0.23 11.37 ± 1.20 6.94 ± 1.33 13.96 ± 1.38 (1.53–2.80) (1.77–20.75) (1.77–14.16) (9.18–20.75) RI-SUVdyn -5.65% ± 14.08% 32.52% ± 6.16% 8.68% ± 6.91% 46.08% ± 3.94% (-47.48–32.52) (-38.93–71.27) (-38.93–45.68) (32.52–71.27) RI-SUVdual -0.21% ± 3.75% 17.71% ± 4.67% 19.02% ± 6.63% 8.47% ± 6.82% (-17.74–3.70) (-30.04–65.85) (-30.04–48.15) (4.65–65.85) SUV, standardized uptake value ; RI-SUV, retention index of maximum standardized uptake value ; BMSL, benign musculoskeletal lesion ; MMSL, malignant musculoskeletal lesion ; PMMST, primary malignant musculoskeletal tu-mor ; MMST, metastatic musculoskeletal tutu-mor ; dyn, dynamic ; dual, dual-time-point
Data are presented as median ± standard error of the mean. Data in parentheses represent the ranges.
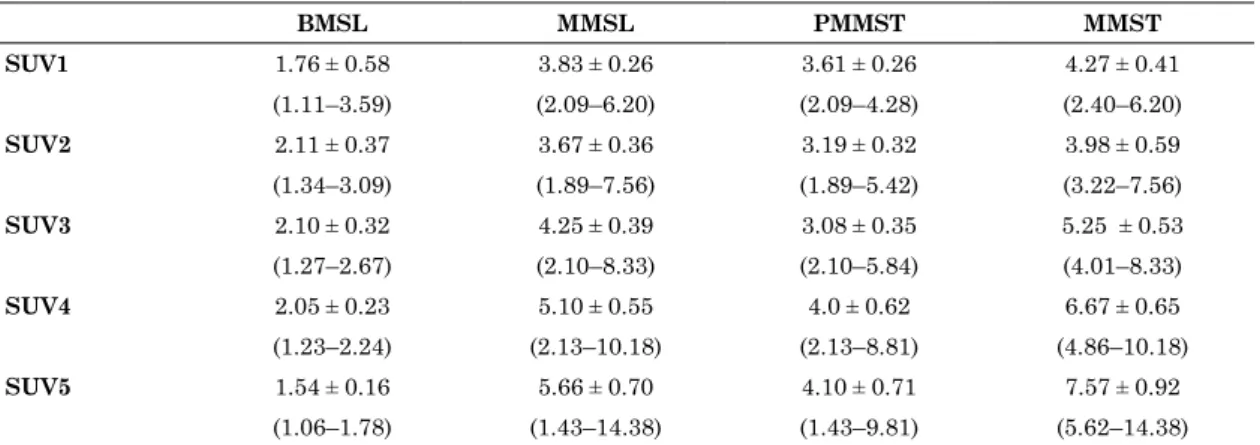
Table 3. SUVmean at each time-point in each group
BMSL MMSL PMMST MMST SUV1 1.76 ± 0.58 3.83 ± 0.26 3.61 ± 0.26 4.27 ± 0.41 (1.11–3.59) (2.09–6.20) (2.09–4.28) (2.40–6.20) SUV2 2.11 ± 0.37 3.67 ± 0.36 3.19 ± 0.32 3.98 ± 0.59 (1.34–3.09) (1.89–7.56) (1.89–5.42) (3.22–7.56) SUV3 2.10 ± 0.32 4.25 ± 0.39 3.08 ± 0.35 5.25 ± 0.53 (1.27–2.67) (2.10–8.33) (2.10–5.84) (4.01–8.33) SUV4 2.05 ± 0.23 5.10 ± 0.55 4.0 ± 0.62 6.67 ± 0.65 (1.23–2.24) (2.13–10.18) (2.13–8.81) (4.86–10.18) SUV5 1.54 ± 0.16 5.66 ± 0.70 4.10 ± 0.71 7.57 ± 0.92 (1.06–1.78) (1.43–14.38) (1.43–9.81) (5.62–14.38) SUV, standardized uptake value ; BMSL, benign musculoskeletal lesion ; MMSL, malignant musculoskeletal lesion ; PMMST, primary malignant musculoskeletal tumor ; MMST, metastatic musculoskeletal tumor.
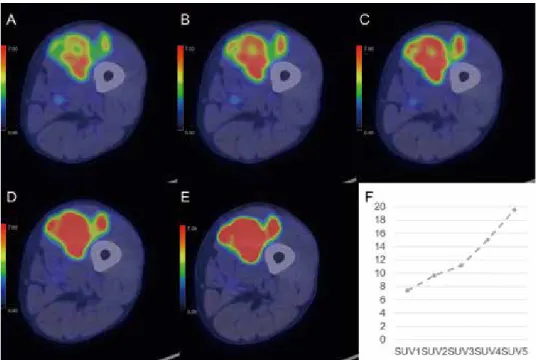
Fig 1. A 78-year-old woman with metastatic soft tissue tumor from gastric cancer in the left thigh
Positron emission tomography/computed tomography (PET / CT) (A-E) images are shown. On the dynamic phases (A-C), fluorodeoxyglucose (FDG) accumulation in the soft tissue tumor is inhomogeneous and focal intense accumulation is identifiable in the posterior part from the dynamic first phase (maximum standardized uptake value [SUVmax] : dynamic first phase, 7.41 ; dynamic second phase, 9.65 ; dynamic third phase, 11.14). The accumulation gradually becomes intense in most parts of the tumor during the dynamic phases (A-C). The 1-h early (D) and 2-h delayed (E) phases show homogeneous and intense accumulation in the soft tissue tumor (SUVmax: 1-h early phase, 15.04 ; 2-h delayed phase, 19.52). The time-SUVmax curve (F) shows a high level for the SUVmax for the dynamic first phase (SUV1), with a continuous increase during the dynamic (SUV1-3), 1-h early (SUV4), and 2-h delayed (SUV5) phases. The physiological FDG uptake of the bone and soft tissue in the early dynamic phase is faint, while the FDG accumulation in the tumor is clearly depicted.
Fig 2. A 74-year-old-woman with differentiated liposarcoma (grade 2) in the right thigh
Positron emission tomography/computed tomography (PET / CT) images are shown for the dynamic (A-C), 1-h early (D), and 2-h delayed (E) phases. On the dynamic first phase (A), fluorodeoxyglucose (FDG) accumulation in the soft tissue tumor is inhomogeneous (maximum standardized uptake value [SUVmax], 5.21). After the dynamic second phase (B-E), the accumulation gradually becomes fainter and more homogeneous and the focal intense accumulation becomes clearer in the left portion of the tumor, compared with accumulation in the dynamic first phase (SUVmax : dynamic second phase, 5.63 : dynamic third phase, 6.02 : 1-h early phase, 10.41 : 2-h delayed phase, 13.35). The time-SUVmax curve (F) shows a gradual increase during the dynamic phases (SUV1-3) and a high level for the SUVmax during the 1-h early (SUV4) and 2-h delayed (SUV5) phases, with continuous increase.
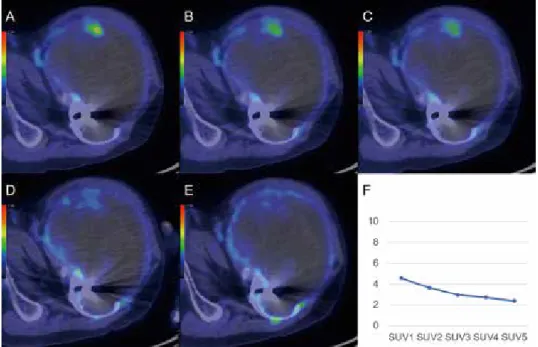
Fig 3. A 67-year-old-man with chronic expanding hematoma in the left femur
Positron emission tomography/computed tomography (PET / CT) images are shown for the dynamic (A-C), 1-h early (D), and 2-h delayed (E) phases. On the dynamic first phase (A), fluorodeoxyglucose (FDG) accumulation in the peripheral region of the bone tumor is focal and faint (maximum standardized uptake value [SUVmax], 4.57). After the dynamic second phase (B-E), FDG accumulation gradually becomes fainter (SUVmax : dynamic second phase, 3.65 : dynamic third phase, 2.97 : 1-h early phase, 2.73 : 2-h delayed phase, 2.40). The time-SUVmax curve (F) shows a low level for SUVmax at the dynamic first phase (SUV1), with a gradual decrease during the dynamic (SUV1-3), 1-h early (SUV4), and 2-h delayed (SUV5) phases.
Fig 4. The change in median SUVmax values for each time phase in benign and malignant musculoskeletal lesions.
Table 4. Performance of various parameters in discriminating between MMSLs and BMSLs in semiquantitative analyses
SUV1 SUV2 SUV3 SUV4 SUV5 RI-SUVdual
Threshold value 3.49 3.38 3.55 5.16 4.00 4.26 Sensitivity (%) 94.7 94.7 89.5 89.5 94.7 89.5 Specificity (%) 75.0 100.0 100.0 100.0 100.0 100.0 PPV (%) 94.7 94.7 100.0 100.0 100.0 100.0 NPV (%) 75.0 100.0 66.7 66.7 80.0 66.7 Accuracy (%) 91.3 95.7 91.3 91.3 95.7 91.3 AUC 0.895 0.987 0.974 0.980 0.961 0.908
SUV, standardized uptake value ; RI-SUV, retention index of maximum standardized uptake value ; dual, dual-time-point scans ; PPV, positive predictive value ; NPV, negative predictive value ; AUC, area under the curve ; MMSLs, malignant muscu-loskeletal lesions ; BMSLs, benign muscumuscu-loskeletal lesions.
DISCUSSION
To date, no studies have evaluated the diagnostic capabilities of dynamic 18F-FDG PET / CT in differentiating between ma-lignant and benign primary unknown MSLs. In this study, we assessed the changes in 18F-FDG uptake in MSLs on dynamic PET / CT scans to compare their diagnostic capacity with that of DTP PET / CT scans. We also attempted to determine the phase that can provide the most accurate diagnostic information for MSLs.
In clinical functional imaging, the most popular method to diagnose malignancies is static PET imaging. The relatively weaker physiological accumulation of FDG in the bone and soft tissues, makes assessing the accumulation of FDG in mus-culoskeletal lesions easier compared to that in other organs. PMMSTs are typically 18F-FDG-avid, while BMSLs show a faint 18F-FDG uptake on static PET images. Reportedly, when using semiquantitative SUV-based methods in MSL cases, the utility of DTP scanning to evaluate FDG accumulation changes over time. In a prospective study of 67 patients with bone lesions (23), there were significant differences in SUVmax in the 1-h early phase and RI, with a sensitivity, a specificity, and an accuracy of 90.6%–96.0%, 44.0%–76.0%, and 72.4%–83.7%, respectively. The AUC values for RI were significantly greater than those for SUVmax in the 1-h early phase. In another study of 56 soft tissue tumors (24), there were significant differences in SUVmax between benign and malignant tumors on the 1-h early and 2-h delayed phases. However, low-grade malignant tumors show mild 18F-FDG uptake and granulomas and active inflammation show false-positive findings on DTP scans (24, 25). Therefore, MSLs may show variable 18F-FDG uptake, and conventional 18 F-FDG PET may have a limited role in the diagnosis of low-grade sarcomas and benign lesions (8, 26).
The present study showed transitional patterns of continually increasing 18F-FDG uptake in most MMSLs and revealed that FDG avidity is stronger in MMSLs than in BMSLs from the early dynamic phase to the delayed phase. Especially, different from those for the BMSLs and PMMSTs, the SUVmax value in the dynamic second phase was higher than that in the dynamic first phase for all MMSTs. We found significant differences in the SUVmax for each time phase and RI-dyn between MMSTs and PMMSTs. In the included patients population, the median RI values for BMSLs were lower in the dynamic scans than in the DTP scans. According to a previous report, the SUVmax for 16 of 17 chronic bacterial osteomyelitis cases was stable or de-creased between 30 and 90 min after injection, and the median SUVmax for 4 malignant lesions was 3.19 (range 2.31−4.70) at
30 min and 4.1 (range 3.52−5.32) at 90 min (26). Another report revealed a significant difference in the mean RI values between benign and malignant bone tumors on 2-h DTP scans (23). In the first few minutes after FDG injection, the FDG uptake is pri-marily determined by blood perfusion and vascular permeability in the specific tissue. In the subsequent metabolic phase, FDG is gradually accumulated in metabolically active cells (9). Our find-ings suggest that most MMSLs show progressively increasing FDG avidity from the early dynamic phase to the 2-h delayed phase and that FDG avidity is stronger at 5−35 min than at 60−120 min after injection. The amount of FDG metabolized in most MMSTs is greater than that metabolized in BMSLs and PMMSTs from the early dynamic phase, and it may be a key finding for differentiating between MMSTs and BMSLs and PMMSTs. FDG accumulation in BMSLs, except for granulomas, and active inflammation may continuously decrease or remain stable from the early dynamic phase.
Regarding differentiation between MMSLs and BMSLs, this study demonstrated a high diagnostic capacity for SUVmax cut-off value of 3.38, based on the ROC curve analysis of the dynamic second phase (AUC 0.987). In addition, although Delong’s test did not reveal any significant differences among the AUC values for all parameters, ROC curve analysis for the dynamic third phase showed the highest diagnostic ability at the SUVmax cut-off value of 6.29 for differentiating MMSTs from PMMSTs (AUC 0.967). In dynamic PET studies without list-mode, the evaluation of full FDG kinetics and application of discriminant analysis are required and can be prospectively used to classify bone lesions as malignant or benign. A study (8) showed that this method had a sensitivity, a specificity, and an accuracy of 75.9%, 97.2%, and 87.7%, respectively. On 18F-FDG PET studies in patients with MSLs, tumor heterogeneity, the number of granulomas, active inflammation, and low-grade sarcoma may affect the outcome of dynamic PET / CT imaging. Hence, our results suggest that the analysis of FDG accumulation in the early dynamic phases is a valuable predictor for discriminating MSLs and show that the diagnostic capacity of SUVmax on the dynamic second and third phases is equivalent or superior to that on the 1-h early and 2-h delayed PET / CT scans in our study population. Therefore, a diagnostic accuracy equal to that obtained using the 60-min and 120-min protocols used in clinical contexts can be obtained with a single measurement requiring 15–25 min. The diagnostic capacity of this approach alone may not be sufficient to differ-entiate between MSLs or be used as the basis for changing the current standard diagnostic flow, which is dependent on biopsy. However, the early dynamic PET / CT scans in list-mode may aid the prediction of histopathology in cases where it is impossible to Table 5. Performance of various parameters in discriminating between MMSTs and PMMSTs in semiquantitative analyses
SUV1 SUV2 SUV3 SUV4 SUV5 RI-SUVdyn
Threshold value 5.06 6.19 6.29 8.57 9.18 32.52 Sensitivity (%) 77.8 77.8 100.0 100.0 100.0 100.0 Specificity (%) 90.0 100.0 90.0 70.0 70.0 90.0 PPV (%) 87.5 100.0 90.0 75.0 75.0 90.0 NPV (%) 81.8 83.3 100.0 100.0 100.0 100.0 Accuracy (%) 84.2 89.5 94.7 84.2 84.2 94.7 AUC 0.833 0.933 0.967 0.856 0.856 0.956
RI-SUV, retention index of maximum standardized uptake value ; Dyn, dynamic scans ; PPV, positive predictive value ; NPV, negative predictive value ; AUC, area under the curve ; SUV, standardized uptake value ; PMMSTs, primary malignant mus-culoskeletal tumors ; MMSTs, metastatic musmus-culoskeletal tumors.
perform percutaneous biopsy and where there are multiple sites with various suspected morphological subtypes.
This study was limited by the small sample size and lack of granuloma and active inflammation cases, which show FDG avidity (false-positive) on routine FDG PET scans. Moreover, we did not assess the pathological background responsible for differ-ences among MSLs in FDG uptake, which involves the expres-sion of glucose transporters in the tumors, and did not perform kinetic modeling in FDG PET. A multi-institutional trial using a larger patient population that includes all histological subtypes, combined with a kinetic study and immunohistochemical analy-sis, may provide a clearer picture and more comprehensively re-veal the diagnostic capacity of dynamic 18F-FDG PET / CT scans for MSLs. Despite its limitations, this study demonstrated the high diagnostic ability of this approach for MMSLs and MMSTs with an optimal cut-off SUVmax. In addition, our dynamic 18 F-FDG PET / CT analysis can be routinely performed in clinical practice without additional invasive methods, such as continuous phlebotomy for arterial input function.
In conclusion, this study reported a transitional increase in the 18F-FDG uptake in MMSLs and that FDG avidity was stron-ger in MMSLs than in BMSLs from the early dynamic phase to the 2-h delayed phase. In the included patients population, dynamic 18F-FDG PET / CT, particularly when combined with semiquantitative analyses for SUV2 and SUV3, showed high diagnostic accuracy in differentiating between MSLs. Additional studies with larger cohorts are needed to identify the modality− dynamic PET / CT or DTP scanning−that performs better in terms of MSL differentiation.
CONFLICT OF INTERESTS
None
ACKNOWLEDGEMENTS
The authors would like to thank the radiographers and ad-ministration team at Tokushima University Hospital for their technical assistance and cooperation during the imaging and administration processes.
FUNDING
No funding was received for conducting the research or for reporting the results.
REFERENCES
1. Inai R, Shinya T, Tada A, Sato S, Fujiwara T, Takeda K, Kunisada T, Yanai H, Ozaki T, Kanazawa S : Diagnostic value of thallium-201 scintigraphy in differentiating malig-nant bone tumors from benign bone lesions. Ann Nucl Med 29 : 674-681, 2015
2. Keller S, Inai R, Sato S, Tada A, Adam G, Yamamura J, Kanazawa S : Thallium-201 uptake of giant cell tumor : One step toward the differential diagnosis to atypically present-ing osteosarcoma. AJR Am J Roentgenol 208 : 171-179, 2017 3. Kobayashi H, Kotoura Y, Hosono M, Sakahara H, Hosono
M, Yao ZS, Tsuboyama T, Yamamuro T, Endo K, Konishi J : Diagnostic value of Tc-99m (V) DMSA for chondrogenic tumors with positive Tc-99m HMDP uptake on bone scin-tigraphy. Clin Nucl Med 20 : 361-364, 1995
4. Choong PF, Kunisada T, Slavin J, Schlicht S, Hicks R : The role of thallium-201 and pentavalent dimercaptosuccinic acid for staging cartilaginous tumours. Int Semin Surg Oncol 1 : 10, 2004
5. Shinya T, Sato S, Kunisada T, Inai R, Yanai H, Ozaki T, Kanazawa S : Both a visual and a semiquantitative analy-sis for differentiating benign from malignant chondrogenic bone tumors using Tc-99m (V) DMSA scintigraphy : a pro-spective study. Nucl Med Commun 36 : 802-807, 2015 6. Hicks RJ : Functional imaging techniques for evaluation of
sarcomas. Cancer Imaging 5 : 58-65, 2005
7. Dimitrakopoulou-Strauss A, Strauss LG, Schwarzbach M, Burger C, Heichel T, Willeke F, Mechtersheimer G, Lehnert T : Dynamic PET 18F-FDG studies in patients with prima-ry and recurrent soft-tissue sarcomas : impact on diagnosis and correlation with grading. J Nucl Med 42 : 713-720, 2001 8. Dimitrakopoulou-Strauss A, Strauss LG, Heichel T, Wu H,
Burger C, Bernd L, Ewerbeck V : The role of quantitative (18)F-FDG PET studies for the differentiation of malignant and benign bone lesions. J Nucl Med 43 : 510-518, 2002 9. Rusten E, Rødal J, Revheim ME, Skretting A, Bruland
OS, Malinen E : Quantitative dynamic 18FDG-PET and tracer kinetic analysis of soft tissue sarcomas. Acta Oncol 52 : 1160-1167, 2013
10. Okazumi S, Dimitrakopoulou-Strauss A, Schwarzbach MH, Strauss LG : Quantitative, dynamic 18F-FDG-PET for the evaluation of soft tissue sarcomas : relation to differential diagnosis, tumor grading and prediction of prognosis. Hell J Nucl Med 12 : 223-228, 2009
11. Dimitrakopoulou-Strauss A, Strauss LG, Egerer G, Vasamiliette J, Mechtersheimer G, Schmitt T, Lehner B, Haberkorn U, Stroebel P, Kasper B : Impact of dynamic 18F-FDG PET on the early prediction of therapy outcome in pa-tients with high-risk soft-tissue sarcomas after neoadjuvant chemotherapy : a feasibility study. J Nucl Med 51 : 551-558, 2010
12. Dimitrakopoulou-Strauss A, Strauss LG, Egerer G, Vasamiliette J, Schmitt T, Haberkorn U, Kasper B : Predic-tion of chemotherapy outcome in patients with metastatic soft tissue sarcomas based on dynamic FDG PET (dPET) and a multiparameter analysis. Eur J Nucl Med Mol Imaging 37 : 1481-1489, 2010
13. Kwee TC, Basu S, Cheng G, Alavi A : FDG PET / CT in car-cinoma of unknown primary. Eur J Nucl Med Mol Imaging 37 : 635-644, 2010
14. Schierz JH, Opfermann T, Steenbeck J, Lopatta E, Settmacher U, Stallmach A, Marlowe RJ : Early dynamic 18F-FDG PET to detect hyperperfusion in hepatocellular carcinoma liver lesions. J Nucl Med 54 : 848-854, 2013
15. Nakajima R, Abe K, Kondo T, Tanabe K, Sakai S : Clinical role of early dynamic FDG-PET / CT for the evaluation of renal cell carcinoma. Eur Radiol 26 : 1852-1862, 2016 16. Epelbaum R, Frenkel A, Haddad R, Sikorski N, Strauss LG,
Israel O, Dimitrakopoulou-Strauss A : Tumour aggressive-ness and patient outcome in cancer of the pancreas assessed by dynamic 18F-FDG PET / CT. J Nucl Med 54 : 12-18,2013 17. Belakhlef S, Church C, Jani C, Lakhanpal S : Early
dy-namic PET / CT and 18F-FDG blood flow imaging in bladder cancer detection : a novel approach. Clin Nucl Med 37 : 366-368, 2012
18. Bernstine H, Braun M, Yefremov N, Lamash Y, Carmi R, Stern D, Steinmetz A, Sosna J, Groshar D : FDG PET / CT early dynamic blood flow and late standardized uptake value determination in hepatocellular carcinoma. Radiology 260 : 503-510, 2011
Uyama N, Yamanaka M, Terazawa K, Toba H, Bando Y, Otsuka H, Harada M : Preliminary clinical assessment of dynamic 18F-fluorodeoxyglucose positron emission tomogra-phy / computed tomogratomogra-phy for evaluating lymph node me-tastasis in patients with lung cancer : a prospective study. Ann Nucl Med 33 : 414-423, 2019
20. Shinya T, Otomi Y, Dimitrakopoulou-Strauss A, Kubo M, Kondo M, Otomo M, Terazawa K, Bando Y, Harada M : Pre-liminary clinical assessment of dynamic 18 F-fluorodeoxyglu-cose positron-emission tomography / computed tomography for evaluating the clinicopathological grade in patients with non-Hodgkin’s lymphoma : a prospective study. Nucl Med Commun 41 : 26-33, 2020
21. Kanda Y : Investigation of the freely available easy-to-use software ‘EZR’ for medical statistics. Bone Marrow Trans-plant 48 : 452-458, 2013
22. Fletcher CDM, Bridge JA, Hogendoorn P, Mertens F : WHO Classification of Tumours of Soft Tissue and Bone. IARC
Press, Lyon, 2013
23. Tian R, Su M, Tian Y, Li F, Li L, Kuang A, Zeng J : Du-al-time point PE T /CT with F-18 FDG for the differentiation of malignant and benign bone lesions. Skeletal Radiol 38 : 451-458, 2009
24. Hamada K, Tomita Y, Ueda T, Enomoto K, Kakunaga S, Myoui A, Higuchi I, Yoshikawa H, Hatazawa J : Evalua-tion of delayed 18 F-FDG PET in differential diagnosis for malignant soft-tissue tumors. Ann Nucl Med 20 : 671-675, 2006
25. Ishibashi M, Tanabe Y, Fujii S, Ogawa T : Pictorial review of 18F-FDG PET / CT findings in musculoskeletal lesions. Ann Nucl Med 31 : 437-453, 2017
26. Sahlmann CO, Siefker U, Lehmann K, Meller J : Dual time point 2-[18F]fluoro-2’-deoxyglucose positron emission tomography in chronic bacterial osteomyelitis. Nucl Med Commun 25 : 819-823, 2004