Japan Advanced Institute of Science and Technology
JAIST Repository
https://dspace.jaist.ac.jp/
Title
Simulation of optical spectra of Eu^<3+> ion in
fluorozirconate glasses by molecular dynamics
simulation and point charge crystal field
Author(s)
Soga, Kohei; Inoue, Hiroyuki; Makishima, Akio
Citation
Journal of Applied Physics, 89(7): 3730-3735
Issue Date
2001-04-01
Type
Journal Article
Text version
publisher
URL
http://hdl.handle.net/10119/4548
Rights
Copyright 2001 American Institute of Physics.
This article may be downloaded for personal use
only. Any other use requires prior permission of
the author and the American Institute of Physics.
The following article appeared in Kohei Soga,
Hiroyuki Inoue and Akio Makishima, Journal of
Applied Physics, 89(7), 3730-3735 (2001) and may
be found at
http://link.aip.org/link/?JAPIAU/89/3730/1
Description
Simulation of optical spectra of Eu
3¿ion in fluorozirconate glasses
by molecular dynamics simulation and point charge crystal field
Kohei Soga,a)Hiroyuki Inoue, and Akio Makishima
Department of Materials Engineering, School of Engineering, University of Tokyo, 7-3-1 Hongo, Bunkyo-ku, Tokyo 113-8656, Japan
共Received 22 February 2000; accepted for publication 21 December 2000兲
Eu3⫹-doped fluorozirconate glasses with two compositions Zr:Ba⫽1:1共ZB11兲 and Zr:Ba
⫽3:1共ZB31兲 were prepared. The emission, excitation, and fluorescence line narrowing spectra of
those glasses were measured. Certain differences between the two glasses were observed in the observed spectra. Structural models of the glasses were simulated by molecular dynamics 共MD兲 simulation. The optical spectra of Eu3⫹ in those glasses were simulated from the simulated glass structures using a point charge crystal field. The differences in spectral characteristics between the two glasses in the observed spectra were reproduced in the simulated spectra. The MD simulation showed that the barium ions were more apt to coordinate to EuFa clusters than the zirconium ions
were. © 2001 American Institute of Physics. 关DOI: 10.1063/1.1351542兴
I. INTRODUCTION
Rare-earth 共RE兲 doped glasses are known as materials for glass lasers, fiber lasers, upconversion lasers, and optical amplifiers.1–4 In these applications, the excitation and the emission are due to transitions of 4 f electronic states of trivalent RE ions. Energy levels and transition rates of 4 f electronic states of RE ions in solids are dominated by the surrounding structure of RE ions.4–6 Therefore, their optical properties, such as spectral band shape and quantum efficien-cies, are host dependent.
For the design of these materials, appropriate methods for the analysis and the prediction of optical properties are important. In 1962, Judd and Ofelt7,8 proposed an excellent method of treatment for analyzing absorption intensity and predicting emission intensity. A number of researchers com-bined the Judd–Ofelt analysis with lifetime measurements to calculate the transition rates.1–4However, in most cases, the effects of the variation of the spectral band shape were ne-glected. For laser operation of the RE doped glass, the spec-tral band shape is important because it directly dominates the quantum efficiency. For upconversion lasers, the spectral shapes are also important because excited state absorption and energy transfer processes are strongly dependent on the spectral shapes of transitions. In the field of optical amplifi-cation, the use of a wavelength division multiplexing
共WDM兲 technique is inevitable. The knowledge of spectral
band shapes is essential for the design of RE doped glasses for WDM optical amplifiers.3Thus the simulation of optical spectra of RE ions in glasses is crucial for the design of these materials.
In many studies of the optical properties of RE-doped glasses, the discussions are based on the composition, not on the glass structure.1 As mentioned above, the energy level splitting and the transition rate of 4 f electronic states in RE
ions are affected by the environment of the ions. Therefore, studies of the relation between a glass structure and its opti-cal properties are significant from the standpoint of both sci-ence and application. In recent years, we have investigated this subject by using fluorescence line narrowing 共FLN兲 emission observations9 and a spectral simulation using a point charge crystal field, in which the structures of glass were simulated by molecular dynamic共MD兲 simulation.10
Analysis of the spectra of RE-doped crystals has been intensively carried out since the 1950s. Simulation of the optical spectra from a structure model including energy level splitting and transition intensities was performed for KY3F10
by Pocher et al. in 1978.11–13They have published numerous papers on various kinds of crystals.14–24The simulation of a RE spectrum in glass was first carried out on silicate glass in 1976 by Brecher and Riseberg.25 The authors considered only the structure of EuOxfirst coordination polyhedrons, in
which the intensity calculation of transitions between Stalk levels was not included. The symmetry of the RE site was limited for the simplicity of computation. In the 1980s, there were several articles dealing with this method.26–30 In the last decade, we and several other researchers have been studying the simulation of spectra including transition inten-sities and the effects of ions outside the first coordination shell without assuming any site symmetry.31–36
Fluorozirconate glass is a good host for the RE ions because the quantum efficiencies of the emission of RE ions are relatively high in this glass.1 In addition, the flat gain spectrum of an Er-doped fiber amplifier made of fluorozir-conate glass is desirable for the WDM operation.3
The purpose of this article is to study a method of the simulation of the optical spectra of RE ions in glass and investigate the environment of RE ions in glass. The lation of spectra is based on structural models by MD simu-lation. Even and odd crystal field parameters are calculated from the structural models using a point charge crystal field for the calculation of energy level splitting and transition intensities, respectively. Electronic states of Eu3⫹ ions in a
a兲Author to whom correspondence should be addressed; electronic mail: [email protected]
3730
fluoride host were estimated by the DV-X␣ method for the simulation. Glasses with two different cation ratios were studied. By comparing the observed and the simulated spec-tra of the two glasses, the validity of the simulation method was obtained.
II. EXPERIMENT A. Sample preparation
The compositions of the glass samples were 45ZrF4•45BaF2•4LaF3•4AlF3•2EuF3 共ZB11兲 and 67.5ZrF4
•22.5BaF2•4LaF3•4AlF3•2EuF3 共ZB31兲. Glass batches for
10 g were prepared from commercially available fluorides
共⬎99.9% purity兲. The batches were heated in a gold crucible
using an electric furnace for 15 min at a temperature of 950 °C for ZB11 and at 850 °C for ZB31, respectively. The melts were pressed between aluminum blocks. The above processes were conducted in a N2 glove box.
B. Measurement of emission spectra
The schematic diagram for the FLN measurements is shown in Fig. 1. The concept and the method of measure-ment of FLN emission spectra have been described previously.9,25 The system was calibrated using a standard lamp. The excitation wavelengths were 17 271–17 346 cm⫺1
共corresponding to the excitation due to 7F
0–5D0 transition兲
with a 15 cm⫺1 interval. The emission spectra were mea-sured in the 13 698–17 241 cm⫺1range共corresponding to the emissions due to5D0–7F1, 7F2, 7F3, and7F4 transitions兲.
Broadband emission spectra were calculated by integrating the FLN emission spectra.
III. METHOD OF CALCULATION A. Molecular dynamics simulation
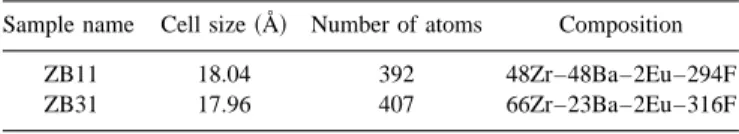
The method and potential parameters of MD simulations are described in Ref. 10. The compositions and cell sizes are shown in Table I. LaF3 and AlF3 were removed as minor
components for the simplicity of the computation. Each cell contained two europium ions. To obtain the variation of the Eu3⫹ sites in the glass structure, MD simulations were
per-formed for 200 different sets of random initial coordinates. Thus 400 Eu3⫹ sites were simulated for glass composition by MD simulation.
B. Energy level and transition intensity calculation of the 4f electrons in Eu3¿
A detailed method of the calculations can be found in the literature.4,11–13 In this article, we describe briefly the key theoretical points for the calculation. Using a point charge approximation for the ions surrounding the rare earth, the Hamiltonian describing the electrostatic field共crystal field兲 at the europium ion can be written as
HCF⫽
兺
k q⫽⫺k兺
k BkqCkq, 共1兲 Bkq⫽⫺ak e2 4⑀0具
4 f兩r k兩4 f典
兺
i Qi rik⫹1Ckq* ⫽ak具
4 f兩rk兩4 f典
Akq, 共2兲 Akq⫽⫺ e2 4⑀0兺
i Qi rik⫹1Ckq* , 共3兲where the ligand i of charge Qi is at a distance ri from a
europium ion,
具
4 f兩rk兩4 f典
is the radial integral for the 4 f electrons. The value of具
4 f兩rk兩4 f典
was calculated using the DV-X␣method as described below. Ckqis a tensor operatorgiven with spherical harmonic function Ykqas
Ckq⫽
冑
4
2k⫹1Ykq. 共4兲
Crystal field parameters Akqwere calculated form the Qi
and ri in the structural models by MD simulation. A crystal
field parameter with an odd k contributes to the transition intensities, and that with an even k contributes to the energy level splitting of the RE spectra. No symmetry for the RE sites was assumed for this calculation. Although all of the ions in a solid should be included in the summation with i, this kind of treatment is impossible. In the actual calculation, the summations in Eqs. 共2兲 and 共3兲 were limited to the ions within 200 Å from a europium ion because the longer the distance from the center ion is, the less the contribution to a crystal field as seen in Eq.共2兲. The necessity of encountering ions farther from a europium ion than the first coordinated fluorine ions was discussed in Ref. 10. It is known that cor-rection factor ak is needed for the interpretation of a
struc-tural model to an optical spectrum.12 In this study, ak was
treated as an adjustable parameter.
The Hamiltonian for the 4 f electronic state can be de-scribed as
FIG. 1. Schematic diagram of FLN emission measurement system.
TABLE I. Cell size, number of atoms, and composition in a cell in MD simulation.
Sample name Cell size共Å兲 Number of atoms Composition ZB11 18.04 392 48Zr–48Ba–2Eu–294F ZB31 17.96 407 66Zr–23Ba–2Eu–316F
3731
H⫽H0⫹HSO⫹HCF, 共5兲
where H0⫹HSOis the free ion Hamiltonian calculated from E1⫽5573.0 cm⫺1, E2⫽26.708 cm⫺1, E3⫽557.39 cm⫺1,
and⫽1326.0 cm⫺1.37
By diagonalizing the matrix with the element
具
␣SLJ MJ兩H兩␣⬘
S⬘
L⬘
J⬘
MJ⬘典
共6兲for the 51兩SL
典
states, 399兩SLJ典
states, and 1393兩SLJMJ典
states, energy level splitting was obtained as the eigenvalues ⑀and the eigenvectors兩␣SLJ MJ
典
were calculated as兩␣SLJ MJ
典
⫽兺
SLJ MJ
CSLJ M
J兩SLJMJ
典
. 共7兲In this calculation of energy levels, the value k was limited to 2, 4, and 6 for the selection rule.
The magnetic dipole transition intensities can be calcu-lated as described in Refs. 4 and 12 using the resultant eigen-vectors 兩␣SLJ MJ
典
of the above diagonarization. They arenot sensitive to the local environment of the Eu3⫹ ion be-cause they apparently do not involve crystal field parameters. The intensity of transition by the electric dipole operator P between the two states 兩␣SLJ MJ
典
and兩␣⬘
S⬘
L⬘
J⬘
MJ⬘典
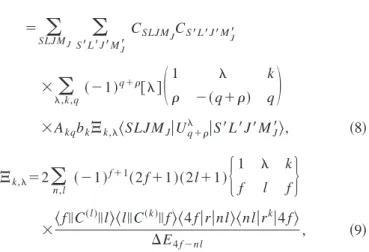
isdescribed by the method developed by Judd and Ofelt with4,7,8
具
␣SLJ MJ兩P兩␣⬘
S⬘
L⬘
J⬘
MJ⬘典
⫽兺
SLJ MJS⬘L兺
⬘J⬘M J ⬘CSLJ MJCS⬘L⬘J⬘MJ⬘ ⫻兺
,k,q 共⫺1兲 q⫹关兴冉
1 k ⫺共q⫹兲 q冊
⫻Akqbk⌶k,具
SLJ MJ兩Uq⫹兩S⬘
L⬘
J⬘
MJ⬘典
, 共8兲 ⌶k,⫽2兺
n,l 共⫺1兲 f⫹1共2 f ⫹1兲共2l⫹1兲再
1 k f l f冎
⫻具
f储C共l兲储l典具
l储C共k兲储f典具
4 f兩r兩nl典具
nl兩r k兩4 f典
⌬E4 f⫺nl , 共9兲where bk is the correction factor for ⌶k, which is also
treated as an adjustable parameter in this study. The Akq
parameters are the crystal field parameters described as Eq.
共3兲 and were calculated from MD structural models using a
point charge crystal field. The values of k in the calculation of electric dipole transition intensities are limited to 1, 3, 5, and 7 for the selection rule.
The electronic states of rare earth ions are included as
具
4 f兩rk兩4 f典
in Eq.共2兲 and⑀nl,兩nl典
in Eq.共9兲. For thesimu-lation of spectra, the 5d and ng states were encountered as
兩nl
典
states. We applied an electronic state calculation called DV-X␣for the electronic state of the Eu3⫹ion in a fluoride host EuF3 crystal. The program SCAT for the computationwas provided by Adachi et al.38 For the calculation, the first coordination polyhedron, EuFxwas used. The second
neigh-bor ions were treated as point charges. The DV-X␣
calcula-tion gave the results for
具
4 f兩rk兩4 f典
, ⑀5d and兩5d典
. ⑀ng, and兩ng
典
were estimated by using the approximation described in the literature.39IV. RESULTS AND DISCUSSION A. Simulation of optical spectra and phenomenological parameters,ak andbk
The excitation and emission spectra of europium ions were simulated using transition energies and intensities cal-culated from MD structural models. Obtaining smooth spec-tra to compare with the observed ones, each spec-transition line was assumed to have a Gaussian distribution with a FWHM of 15 cm⫺1at the position of the transition energy and with the height of the transition intensity. A spectrum was simu-lated integrating those lines for all of the structural models that belonged to a category.
The phenomenological parameters ak and bk had to be
determined to calculate the energy level splitting and transi-tion intensities. Due to the selectransi-tion rules, the contributransi-tion of a crystal field parameter to an energy level splitting or a transition intensity is roughly limited by the k value as shown in Table II. The selection rules are strictly valid when J mixing is not encountered. Although the calculated energy levels and transition intensities were affected by J mixing to some extent, the effects were relatively small and it is ad-equate to use those rules for the determination of akand bk.
We determined the ak and bk parameters using the
differ-ences of their contribution of the crystal fields to the simu-lated spectra by the k values. For example, the energy level splitting of the7F1state is affected only by A2q. Comparing
the observed and the simulated spectra, the a2 value was
determined. In the case of 7F2 energy splitting, only the
crystal field parameters Akqwith k⫽2 and 4 affect the
split-ting. Using the a2value obtained above, we could determine
the a4 parameter by comparing the observed and simulated
spectra of 7F2. Finally, using the a2, a4 parameters
deter-mined above and the 7F4 spectra, the a6 parameter was
de-termined. The ak and bk parameters are listed in Table III
together with the parameters calculated for the EuF3 crystal
by the DV-X␣ electronic state calculation. In the intensity calculation, A7q parameters were omitted because their
con-tributions to the transition bands in our observation were negligible.
B. Broadband emission and excitation spectra
Figure 2 shows the observed 共b兲 and simulated 共a兲 broadband emission spectra. The simulated broadband
spec-TABLE II. Contribution of crystal field parameters (Akq) to energy level splittings and transition intensities.
5D 0→ Energy level splitting
7F 1 k⫽2 7F 2 k⫽2,4 7F 3 k⫽4,6 7F 4 k⫽4,6 EDTb EDT Intensity MDTa k⫽1,3 共forbidden兲 k⫽3,5 ⫽2 ⫽4
aMDT: Magnetic dipole transition. b
tra are obtained by integrating spectral lines over all of the structural models for each glass. In relation to the transition intensity, the5D0–7F1 bands mostly consist of magnetic
di-pole transitions, and those intensities are insensitive to the glass structure. The crystal field affects only the splitting of the energy levels. However, the5D0–7F2 bands mostly
con-sist of electric dipole transitions, whose intensities are sensi-tively changed by the crystal field, i.e., glass structure. Tran-sition intensity corresponds to the area of an emission band. To compare the intensity of the structure sensitive bands, all of the emission spectra on this article were normalized so that the areas of the5D
0–7F1 bands would be constant.
In observed emission spectra, the characteristic differ-ences between the ZB11 and ZB31 glasses were revealed as the sharper profile of the ZB31 glass on the high-energy side of the 5D0–7F2 band and on the low energy side of the
5D
0–7F4 band compared to those of the ZB11 glass. The
emission intensity, spectral shape, and the above differences between the two glasses were reproduced in the simulated spectra.
The simulated and observed excitation spectra are shown in Fig. 3. In both spectra, the energy of the high-energy edge of the band of the ZB31 glass was higher than that of the
ZB11 glass. This difference was reproduced in the simulated spectra. The energy of the low-energy edge of the ZB31 glass in the simulated spectrum was higher than that of the ZB11 glass. However, this feature did not appear in the ob-served spectra. The reason is not clear. One possible reason for this mismatch of the observed and simulated spectra is the neglect of the phonon effects, such as phonon sidebands or thermalization.
C. FLN emission spectra
An excitation with a narrow line by a tunable laser is known to give narrower emission spectra than a broadband excitation for glassy materials because of the limitation of the excitation in an excitation spectrum broadened by the random distribution of the structure. This method is referred to as FLN and has been used by many spectroscopists inves-tigating rare-earth doped glasses to provide clearer informa-tion for the spectra than broadband excitainforma-tion does.9,25,26
Figure 4 shows the simulated共a兲 and observed 共b兲 FLN emission spectra of Eu3⫹in the ZB11 and ZB31 glasses. The
7F
0–5D0 excitation energy was varied for the observed
spectra by tuning the excitation laser. A corresponding change of the excitation energy in the simulation was per-formed grouping the structural models with the 7F0–5D0 TABLE III. Electronic state parameters 具f兩rk兩 f典 and ⌶
k calculated for EuF3crystal by DV-X␣electronic state calculation and phenomenological factors akand bkfor the simulations of spectra.
Unit k EuF3crystal 共by DV-X␣兲 ak, bk 具f兩rk兩 f典 共Å2兲 2 — 0.26 0.59 共Å4兲 4 — 0.16 2.2 共Å6兲 6 — 0.21 4.3 ⌶k (10⫺6cm2/erg) 1 2 ⫺0.75 0.93 (10⫺22cm2/erg) 3 2 0.47 3.0 (10⫺22cm2/erg) 3 4 0.47 (10⫺38cm2/erg) 5 4 ⫺0.37 5.2 (10⫺38cm2/erg) 5 6 ⫺0.80 (10⫺54cm2/erg) 7 6 0.59 —
FIG. 2. Simulated共a兲 and observed 共b兲 broadband emission spectra of Eu3⫹
in ZB11 and ZB31 fluorozirconate glasses.
FIG. 3. Simulated共a兲 and observed 共b兲 excitation spectra of Eu3⫹in ZB11 and ZB31 fluorozirconate glasses共monitored at 14 300 cm⫺1兲.
3733
energies in the same region, for example, between 17310 and 17324 cm⫺1, when the simulated emission lines were inte-grated.
The characteristic differences between the two glasses, which were not clear in the broadband spectra, are clearly observed in the FLN spectra. A gradual increase of the split-ting by increasing the excitation energy was observed in the simulated spectra as well as in the observed spectra.
As a matter of convenience, three peaks of the5D0–7F1
band are noted as⑀1,⑀2, and⑀3from the higher energy side
as shown in Fig. 4. The characteristic differences between the ZB11 and ZB31 glasses in the observed spectra were as follows;
共1兲 In the5D
0–7F1band, the splitting of the⑀2and⑀3
com-ponents was larger for the ZB11 glass than for the ZB31 glass.
共2兲 In the5D
0–7F2 band, the shoulder on the higher energy
side was sharper for the ZB31 glass than for the ZB11 glass.
共3兲 In the 5D 0–
7F
2 band, the differences in the spectral
shape and intensity between the two glasses were smaller at the higher excitation energy side of the band. The above three characteristic differences between the two glasses were reproduced in the simulated spectra. This fact means that the structural difference which affects the spec-troscopic character of rare-earth ions in glass was simulated properly by MD simulation, and that the simulation of spec-tra using a point charge crystal field is usable in analyzing the spectra of the RE ions in glass.
D. Structure models by MD simulation
The results of optical spectrum simulation showed that the structures of the RE sites, which affected the optical spectra, were reproduced by MD simulation. We will discuss the structural aspects of the RE coordination in the structural models by MD simulation in this section. Figures 5 and 6 show the Eu–X 共X⫽Zr, Ba, and F兲 pair distributions and cumulative distribution, respectively, as a result of MD simulation. The peak of the Eu–F pair distribution was at 2.4 Å, whose value was comparable with the average Eu–F dis-tances of europium fluoride crystals. The average coordina-tion numbers of the atoms to the Eu ions, obtained from Fig. 6, are shown in Table IV. The Eu–F coordination number was larger in the ZB11 glass than in the ZB31 glass. Com-paring RN⫽N共Ba兲/N共Zr⫹Ba) 共ratio of the number of atoms
in a cell兲 with RNC⫽NC(Eu–Ba)/NC(Eu–兵Zr⫹Ba其)共the
ra-FIG. 4. Simulated共a兲 and observed 共b兲 FLN emission spectra of Eu3⫹in
ZB11 and ZB31 glasses.
FIG. 5. Pair radial distribution function of Eu–X共X⫽Zr, Ba, and F兲 pairs in ZB11 and ZB31 fluorozirconate glasses.
FIG. 6. Eu–X 共X⫽Zr, Ba, and F兲 cumulative distribution of ZB11 and ZB31 fluorozirconate glasses.
tio of coordination numbers兲, the RNC was larger in both
ZB11 and ZB31. Thus barium atoms tended to coordinate to EuFx polyhedron in both glasses.
V. CONCLUSION
The simulation of the spectra of Eu3⫹-doped fluorozir-conate glasses with two compositions, Zr:Ba⫽1:1 共ZB11兲 and Zr:Ba⫽3:1 共ZB31兲, was studied using MD simulations and a point charge crystal field. The characteristic differ-ences of observed emission spectra between two glasses were revealed as sharper profiles of the peaks of the ZB31 glass compared with those of the ZB11 glass. A difference in the splitting behavior between the two glasses by the change of excitation energy was observed for the FLN emission spectra. Those differences in the observed optical spectra were reproduced in the simulated spectra. The analysis of structural models by MD simulation showed that barium ions tended more to coordinate with EuFa clusters than with
zir-conium ions.
1R. Reisfeld and C. K. Jorgensen, Handbook on the Physics and Chemistry
of Rare Earths, edited by K. A. Gschneidner and L. Eyring共1987兲, Chap.
58, pp. 1–90. 2
J. Lucas and J. Adam, Glastech. Ber. 62, 422共1989兲.
3M. Yamada, T. Kanamori, Y. Terunuma, K. Okawa, M. Shimizu, S. Sudo, and K. Sagawa, IEEE Photonics Technol. Lett. 8, 882共1996兲.
4R. C. Powell, Physics of Solid-State Laser Materials 共Springer, New York, 1998兲.
5
S. Hufner, Optical Spectra of Transparent Rare Earth Compounds 共Aca-demic, New York, 1978兲.
6G. H. Dieke, Spectra and Energy Levels of Rare Earth Ions in Crystals 共Interscience, New York, 1968兲.
7
B. R. Judd, Phys. Rev. 127, 750共1962兲. 8G. S. Ofelt, J. Chem. Phys. 37, 511共1962兲.
9K. Soga, M. Uo, H. Inoue, and A. Makishima, J. Am. Ceram. Soc. 78, 129 共1995兲.
10K. Soga, H. Inoue, A. Makishima, and S. Inoue, Phys. Chem. Glasses 36, 253共1995兲.
11
P. Porcher and P. Caro, J. Chem. Phys. 65, 89共1976兲. 12P. Porcher and P. Caro, J. Chem. Phys. 68, 4176共1978兲. 13P. Porcher and P. Caro, J. Chem. Phys. 68, 4183共1978兲. 14
P. Porcher and P. Caro, J. Lumin. 21, 207共1980兲.
15M. Taibi, J. Aride, E. AnticFidancev, M. LemaitreBlaise, and P. Porcher, Phys. Status Solidi A 115, 523共1989兲.
16E. Anticfidancev, M. LemaitreBlaise, P. Porcher, M. Taibi, and J. Aride, J. Alloys Compd. 188, 75共1992兲.
17E. AnticFidancev, J. Aride, M. LemaitreBlaise, P. Porcher, and M. Taibi, J. Alloys Compd. 188, 242共1992兲.
18C. Cascales, E. AnticFidancev, M. LemaitreBlaise, and P. Porcher, J. Al-loys Compd. 180, 111共1992兲.
19E. AnticFidancev, M. LemaitreBlaise, J. Chaminade, and P. Porcher, J. Alloys Compd. 180, 223共1992兲.
20E. AnticFidancev, C. Cascales, M. LemaitreBlaise, and P. Porcher, J. Al-loys Compd. 207, 178共1994兲.
21A. Florez, M. Florez, S. A. LopezRivera, J. Martin, P. Porcher, O. L. Malta, Y. Messaddeq, and M. A. Aegerter, J. Alloys Compd. 275–277, 333共1998兲.
22J. Holsa, R. J. Lamminmaki, and P. Porcher, J. Alloys Compd. 275–277, 398共1998兲.
23J. Holsa, E. Sailynoja, P. Ylha, E. AnticFidancev, M. LemaitreBlaise, and P. Porcher, J. Chem. Soc., Faraday Trans. 94, 481共1998兲.
24J. Holsa, R. J. Lamminmaki, P. Porcher, P. Deren, and W. Strek, Spectro-chim. Acta, Part A 54, 2189共1998兲.
25C. Brecher and L. A. Riseberg, Phys. Rev. B 13, 81共1976兲. 26
C. Brecher and L. A. Riseberg, Phys. Rev. B 21, 2607共1980兲. 27S. A. Brawer and M. J. Weber, Appl. Phys. Lett. 35, 31共1979兲. 28
S. A. Brawer and M. J. Weber, Phys. Rev. Lett. 45, 460共1980兲. 29S. Brawer and M. J. Weber, J. Non-Cryst. Solids 38&39, 9共1980兲. 30
M. J. Weber and S. A. Brawer, J. Non-Cryst. Solids 52, 321共1982兲. 31G. Cormier and J. A. Capobianco, Europhys. Lett. 24, 743共1993兲. 32
G. Cormier, J. A. Capobianco, C. A. Morrison, and A. Monteil, Phys. Rev. B 48, 16290共1993兲.
33
G. Cormier, J. A. Capobianco, and C. A. Morrison, J. Chem. Soc., Fara-day Trans. 90, 755共1994兲.
34
M. T. Harrison and R. G. Deaning, J. Lumin. 69, 265共1996兲.
35A. Monteil, S. Chaussedent, and J. A. Capobianco, Mol. Simul. 20, 127 共1997兲.
36H. Inoue, K. Soga, and A. Makishima, J. Non-Cryst. Solids 222, 212 共1997兲.
37W. T. Carnall, P. R. Fields, and K. Ra Jnak, J. Chem. Phys. 46, 4450 共1968兲.
38H. Adachi, M. Tsukada, and C. Satoko, J. Phys. Soc. Jpn. 45, 875共1978兲. 39W. Krupke, Phys. Rev. 145, 325共1966兲.
TABLE IV. Average coordination numbers of atoms to europium ions. Size of the coordination ZB11 ZB31 Average coordination number Nc(Eu–F) 3.2 8.8 8.4 Nc(Eu–Zr) 5.5 5.6 8.0 Nc(Eu–Ba) 5.5 6.3 3.1 Ratio of coordination number of cations to a europium ion RNC⫽Nc(Eu–Ba)/ Nc(Eu–兵Zr⫹Ba其) 0.53 0.28
Ratio of the number of cations in a unit cell
RN⫽N共Ba兲/ N共Zr⫹Ba兲
0.50 0.25
3735