Using High-Rising Cities to Visualize Performance in Real-Time
11
0
0
全文
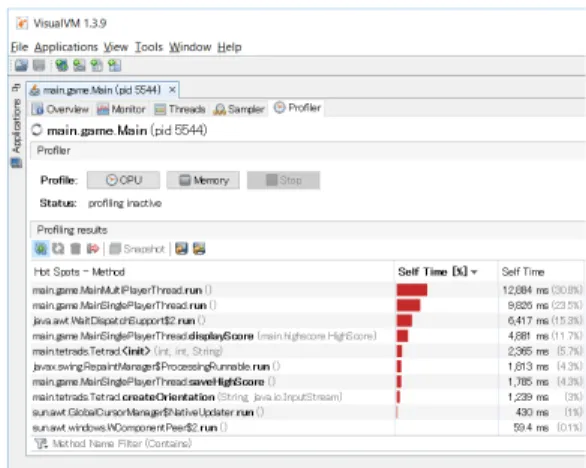
(2) Using High-Rising Cities to Visualize Performance in Real-Time Katsuya Ogami∗ , Raula Gaikovina Kula∗ , Hideaki Hata∗ , Takashi Ishio∗ , Kenichi Matsumoto∗ ∗ Graduate. School of Information Science Nara Institute of Science and Technology, Nara, Japan Email: {ogami.katsuya.ny7, raula-k, hata, ishio, matumoto}@is.naist.jp. Abstract—For developers concerned with a performance drop or improvement in their software, a profiler allows a developer to quickly search and identify bottlenecks and leaks that consume much execution time. Non real-time profilers analyze the history of already executed stack traces, while a real-time profiler outputs the results concurrently with the execution of software, so users can know the results instantaneously. However, a realtime profiler risks providing overly large and complex outputs, which is difficult for developers to quickly analyze. In this paper, we visualize the performance data from a real-time profiler. We visualize program execution as a three-dimensional (3D) city, representing the structure of the program as artifacts in a city (i.e., classes and packages expressed as buildings and districts) and their program executions expressed as the fluctuating height of artifacts. Through two case studies and using a prototype of our proposed visualization, we demonstrate how our visualization can easily identify performance issues such as a memory leak and compare performance changes between versions of a program. A demonstration of the interactive features of our prototype is available at https://youtu.be/eleVo19Hp4k.. I. I NTRODUCTION The first Lehman law of software evolution [1] states that ‘a system must be continually adapted or it becomes progressively less satisfactory’. Furthermore, Lehman’s second law states that ‘an evolving system increases its complexity unless work is done to maintain or reduce it’. As such, developers concerned with performance are required to constantly monitor the performance while evolving (i.e., making code changes) their applications. Developers utilize profilers as a means to quickly search and identify performance issues such as bottlenecks and memory leaks, which may consume the execution time of their applications. State–of–the–art profilers profile application performance at a specific snapshot of an application. According to an online report [2] in 2015, VirtualVM1 and JProfiler2 are comprehensive profilers for applications that run on the Java Virtual Machine (JVM). Both tools offer application developers the ability to properly profile their code execution, collect and browse thread dumps and heap dumps, while gathering various statistics about the internals of the JVM. Although comprehensive, we identify two drawbacks when using profilers such as VirtualVM and JProfiler. The first is the delay that exists between the execution of the program, logging of the execution stack traces and then profiling the results for 1 https://visualvm.github.io/ 2 https://www.ej-technologies.com/products/jprofiler/overview.html. Fig. 1. A screenshot of VirtualVM showing program execution at a particular snapshot in time. Performance is visualized by a horizontal bar chart.. a specific snapshot. Since profilers require time to process the information from an execution log, there is a delay between the actual running of the code and the analysis of its profile. The time taken to collect the data between executions can quickly become tedious and time-consuming for developers, especially if there are many different scenarios that the developer would like immediate feedback on performance while executing their application. The second drawback is the design and presentation of user interfaces provided by these tools. As shown in Figure 1, the typical screen presented by these tools are in the form of a horizontal bar chart. Although intuitive, in this example, other important information such as the relationship between the different components are not easily visible in a single interface. In this paper, we propose a three dimensional cities (commonly known as CodeCity) visualization to show performance in real-time to address these drawbacks. As shown in Figure 2, our proposed visualization (i) profiles in real-time, thus instantaneously updates the visualization while the application is running and (ii) depicts the underlying structure of the application with performance, thus providing a sense of the relationship between the different components in the application. To evaluate the practicality and usefulness of our visualization, we present two case studies in which we (i) identify a potential performance issues (i.e., threads that are not properly killed) and (ii) depict performance during software maintenance (i.e.,.
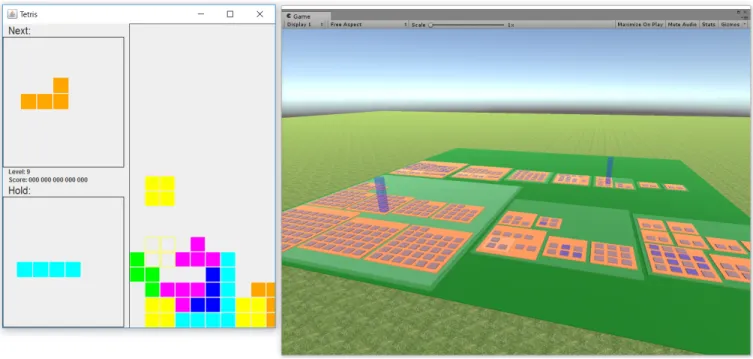
(3) Fig. 2. Our prototype is a CodeCity visualization that shows real-time feedback on the performance of a‘Tetris’ game. Fluctuations on the high-rise buildings indicate performance executions based on the user interactions of a target program (i.e., user interaction of the Graphical User Interface (GUI). ). performance and refactoring activities). The paper is organized as follows. Section II presents the state–of–the–art and related work. Section III presents the visualization design and details while Sections IV and V presents the evaluation and case studies used to demonstrate the practicality and usefulness of our visualization. We discuss aspects such as the generality, visual scalability, ease of use and practicallity in Section VI. We then finally conclude the paper in Section VII. II. S TATE OF THE A RT In this section, we introduce the background and literature related to performance profilers. We first introduce two performance profilers that are popular in industry. We then cover related literature in terms of the visualization of performance. A. Existing Tools in Practice VirtualVM is the state–of–the–art performance profiler that has a feature of recording snapshots, as seen in Figure 1. According to the offical website, VisualVM is ‘an All-in-One Java Troubleshooting tool that takes advantage of several command line tools that are bundled with the Java Development Kit (JDK) distribution, and presents the information about the Java process performance’. Besides being a lightweight monitoring tool, VirtualVM offers application developers the ability to properly profile their code execution, collect and browse thread dumps and heap dumps, while gathering various statistics about the internals of the JVM. Another very popular performance profiling tool reported to be extensively used in industry is JProfiler. The official documentation state that ‘JProfiler is a comprehensive profiler. for Java SE and Java EE applications with plugins for all major IDEs, which provides enhanced analysis of the collected profile data’. As with VirtualVM, JProfiler also provides CPU and memory profiling. As shown in Figure 2, our visualization depicts the structure of software as different artifacts in CodeCity. We highlight two main differences between our proposed visualization against existing tools. The first is the real-time feedback from the visualization. Both VirtualVM and JProfiler rely on logged data of executed program stack traces as either thread of heap dumps. In our proposed method, we eliminate the process required to record and process the data collected in a stack trace. As shown in the figure, the visualization dynamically records as an application program is run. This is especially advantageous for a user that requires instant feedback, possibly reducing the time needed to profile several snapshots of the application. The second difference between our proposed visualization and existing tools is inclusion of the program structure in the visualization, that provides insights into design aspects of the application. As shown in Figure 1, the VirtualVM User Interface does not show the relationship between the called methods. JProfiler does show a call graph view, where the methods are represented by colored rectangles that provide instant visual feedback about where the slow code resides in the method call chains, hence, making bottlenecks easier to find. However, a large software system with hundreds of methods may generate call graph that is too complex to comprehend and aesthetically unpleasing for users..
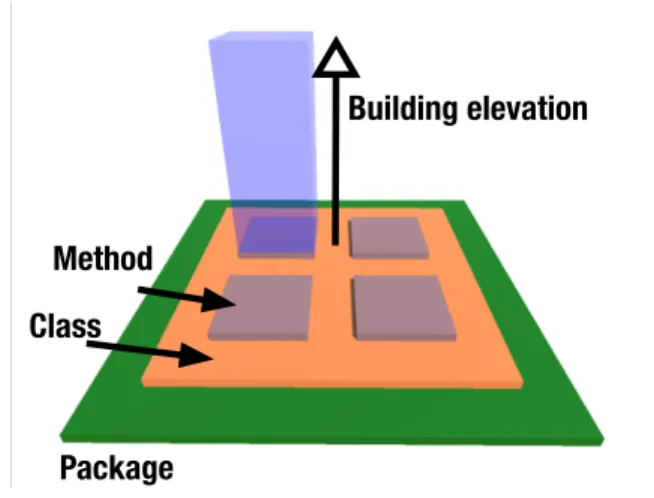
(4) B. Related Work The most related work is the ‘Performance Evolution Blueprint’ [3] and ‘Visualizing dynamic metrics with profiling blueprints’ [4]. In these two works, Bergel and colleagues propose a profiling blueprint as a visualization that helps identify and remove performance bottlenecks. Furthermore, the evolution blueprint evaluates performance during the evolution of the program. Similarly, Bezemer et al, propose ‘Differential Frame Graphs’ to understanding software performance regressions between two profiles [5]. Different to this work, our visualization considers the performance fluctuations that occur while running a single program version. Many profiling tools and approaches utilize the call method relationship to describe the ‘design’ of a program. For example, a circular bundle [6] view visualizes the method call relationship. Zinsight [7] visualizes event statistics and frequent method call patterns. To reduce complexity, in this work, the circular bundle includes an interactive timeline, in which a user can customize and select a specific runtime snapshot size. Much like VirtualVM and JProfiler, many profiling tools have been based on capture and profiling a snapshot of a running program [8], [9]. However, there has been other work that have attempted close to real-time profiling. In these works, the snapshots are referred to as phases, with phase detection approaches are proposed to split an execution trace into smaller phases corresponding to features in an execution. For example, Watanabe et al. [10] proposed a technique to identify phases based on active objects. Other work used key characteristics to highlight the phases. Voigt et al. [11] proposed a plot to visualize active objects in an execution trace. Medini et al. [12] proposed an effective algorithm that extract meaningful labels for detected phases. For a real-time profiler, Reiss [13] proposed a technique to compare active methods between a pair of consecutive time slots. An important aspect of runtime monitoring and feedback is the overhead efficiency when profiling. There exists work [14] that exploits hardware performance counters to reduce runtime overhead for profiling. Furthermore, to understand how time spent for an interaction of methods, De Pauw et al. [15] proposed to use a customized UML sequence diagram whose time axis represents a real time. Using detected phases, a developer can focus on a part of an execution trace. In our work, we create a fixed-time frame that provides a instantaneous feedback while a program in running. Yamaguchi et al. [16] proposed to visualize the behavior of distributed processes. Their algorithm achieves an automatic, stable layout of rectangles representing hierarchical data elements. Our method is dependent on the package structure of a program to achieve a stable layout. III. V ISUALIZATION D ESIGN A. Cities Metaphor Wettel et. al [17] introduce CodeCity as an integrated environment for software analysis, in which software systems are visualized as interactive, navigable 3D cities. The classes. Building elevation. Method Class. Package Fig. 3. Typical layout of a district in the city.. are represented as buildings in the city, while their packages are depicted as the districts in which the buildings reside. The visible properties of the city artifacts depict a set of chosen software metrics, as in the polymetric views of CodeCrawler. The CodeCity metaphor has been the inspiration in numerous visualization scenarios of software. Early work include been Santos et al. [18], who proposed cities for visualizing information for network monitoring and later Panas et al. [19] proposed a similar idea for software production. Early researchers who actually implemented the city metaphor, [20], [21] represented classes are districts and the methods are buildings. We settled on a City metaphor, because is offers a clear notion of the locality and as explained by Wettel, ‘supports orientation and features a structural complexity that is not oversimplified’. As shown by Wettel and Lanza [22], the CodeCity visualization can be leveraged to visually localize design problems. We believe that this can be useful feature when profiling the performance of a program. Moreover, we map the height of an artifact (i.e., such as a building) to provide a visual impression of the performance the artifact has in relation to the current executed functions of a program. In our visualization, we conjecture that performance peaks and fluctuations are easily identified by the ‘high-risers’ in the city. B. Mapping Performance to the City The visualization is divided into two levels of analysis granularity. Firstly, to intuitively express the structural properties of a software, we use the district localization. The second level of mapping is the height of the buildings. The key point of the visualization is that the ‘high-rise’ buildings can be easily detected by the user. 1) District Design: The district design has the main objective of depicting the structure of a software system. Figure 3 depicts the typical layout of the district. As shown, every method is represented by standard uniform square-sized plot building. Furthermore, methods are grouped according to the class (i.e,. classes are mapped to the same orange block)..
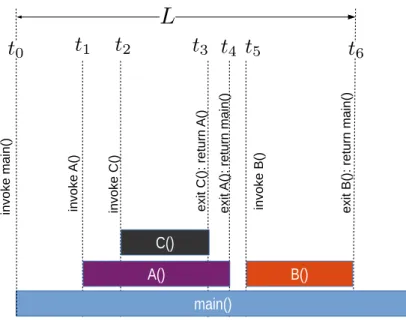
(5) exit B(): return main(). invoke B(). exit A(): return main(). exit C(): return A(). invoke C(). invoke A(). invoke main(). C() A(). B() main(). Fig. 4. Example of how we calculate the height of a building. In Figure 4, we first show an example of an event EL where methods main(), A(), C() and B() are executed during time-frame L.. Within in the same block, the grouped methods are ordered alphabetically by their names. Finally, classes are then grouped according to their packages. (i.e., common classes are grouped into the green district). The visualization is also able to group according to sub-packages within a package. It is important to note that in the visualization that the packages and classes are ordered according to the number of methods contained. For example, the largest package with the most methods will be aligned at the bottom left of the visualization. The rationale is that the users will be able to easily understand the performance in relation to structure of the program. 2) Building Design: As shown in Figure 4, our building elevation is based on a sequence of events within a fixedtime frame. Consider that E represents all events during the execution of a program. Let L be a fixed-time frame of interest. Hence, we are interested in a subset of E, EL that contains all events that have been executed within the time-frame of L. For example, in Figure 4, methods main(), A(), C() and B() have been executed time-frame of L. Our algorithm uses sequences of executed time events (i.e., t1 , t2 ...ti ) where i is the number of time events within EL : L = ti − t0 As shown in Figure 4, there are six events that occur during the EL , hence, L = (t6 − t0 ). Each event consists of (i) timestamp, (ii) executed methods M (iii) action. The action is described as either a invoke or exit and return action. These properties of an event are used to identify all events that occurred during the execution of method m. For each. method m, we now compute the accumulated execution time T ime(m) for the method as: X. T ime(m) =. ti+1 − ti. {i∈EL |M (ei )=m}. For example, for the method A(), the executed time is calculated as T ime(A()) = (t2 − t1 ) + (t4 − t3 ). Using L, we then normalize the executed time relative to the EL . Therefore, we calculate for m: Elevation(m) =. T ime(m) L. Using the example in Figure 4, the height of the mapped building for method A() is calculated as follows: Elevation(A()) =. (t2 − t1 ) + (t4 − t3 ) (t6 − t0 ). where the elevation of method A() is calculated by using only the time when A() was invoked (i.e., we subtract the time when C() is invoked from when A() was invoked). We then normalize this over the total time-frame L. C. Technical Implementation A prototype of our visualization was developed using the game engine Unity3 and implemented in the Java programming language. Unity is a 3D game engine that can render 3 Unity. at https://unity3d.com/.
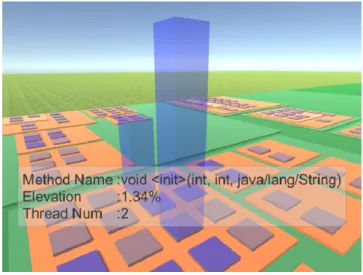
(6) three-dimensional visualizations. For the prototype, our main consideration is how the executions was captured (through logging). Specifically, we discuss some of the main technical considerations when implementing the logging of executions and the handling of Java threads. 1) Logging of method executions: To record execution time for each method, we use bytecode instrumentation. We use the Java ASM4 library, which is a bytecode analyzer to inspect methods in any loaded classes of an executed Java program. This is done by injecting logging code at the entry and the exit of the methods that invoke other methods (i.e., caller methods). Specifically, the injection is performed just before the assembly code of a return or exception throw. It is important to note that our approach of bytecode instrumentation is unable to inject logging code into methods protected by licenses or in cases of when the bytecode is unavailable (native methods). Execution time of those methods are in the execution time of their callers. Our prototype is able to exclude packages if required. However, due to the design, the execution time of these excluded methods are still indirectly included in the caller method execution time. The obtained sequences of events (i.e., EL ) and their execution times are then transmitted in close to real-time batch via a Transmission Control Protocol (TCP) to our visualizer. The visualizer is implemented with Unity (version 5.5.0f3)5 . Each method is assigned a unique ID. All information such as the method names are sent in one transmission. We set the fixed-time frame of L at 3 seconds as it provides the most realtime experience, with trade-offs with the TCP and interface between the profiler and the user GUI of the executed program. 2) Handling of multi-threaded executions: Java uses threads to handle the concurrency that occurs within a program. Our prototype is able to handle each thread independently as a sequence of events EL . In cases of multiple-threads accessing the same method, the longest executed time logged will be used as executed time of that method. At this stage, it is possible for a lag in the logging process to delay the event sequence. D. Real-time Interaction Properties A key highlight of our prototype is a dynamic analysis and feedback on performance in real-time (i.e., as a program is being executed). As shown in Figure 2, we see that a target program (i.e., ‘tetris’ game application) is running simultaneously with our profiling visualization prototype. Therefore, all game input such as Graphical User Interfaces (GUI) keystrokes and other user interactions are visualized in real-time. Figure 5 presents a screenshot of a zoomed image of a method, in this case, a constructor of void <init>(int, int, java,lang.String). As illustrated, the tooltip also shows the name of the method (i.e., Method Name), the elevation height (i.e., %) and the number of threads (i.e., Thread Num) that have executed the method.. Fig. 5. Zoomed representation of our prototype. Upon the mouseover, we can see the (i) method name (ii) elevation and (iii) thread num of the method.. To manage the layout of the city, we determined the sizes of the packages relative to the metric number of classes and methods. Hence, the default aspect ratios for our package and class constructs. Since the visualization is real-time, aesthetically, our intention is for simplicity so that users are quick to identify and focus on the changes in performance of the methods. An important aspect of our proposed visualization, which cannot be shown in the paper, is the constant fluctuation of executed building heights during the real-time dynamic execution of the target program. The fluctuations are caused by both (i) the dynamic user interactions with the target program and (ii) the fixed time-frame L. A video that demonstrates these dynamic fluctuating buildings is available at https://youtu.be/eleVo19Hp4k. IV. E VALUATION We study two real world cases to evaluate our prototype. Our goal of the case studies is to demonstrate the practicality and usefulness of our proposed visualization. The requirement criteria for our case study was as follows: (i) should be a Java application that can be compiled and executed as a binary jar file, (ii) should have sufficient commit messages so that the history could be analyzed and (iii) have a sufficient code base that can be visualized as a city. Furthermore, it was preferable for the program to have a GUI to allow for more user interaction. In the end, we decided that a gaming application is suitable as most games have various GUI. The classic game ‘Tetris’ was selected due to its simple functionality and ease of keystrokes that would dynamically be displayed in our prototype. After a systematic search (i.e., using the GitHub search function), the end result was a selection a Java version of Tetris6 from five other tetris programs implemented in Java. The main deciding factors included the code change history. 4 http://asm.ow2.org/) 5 https://unity3d.com/. 6 The. website is available at https://github.com/exal99/Tetris.
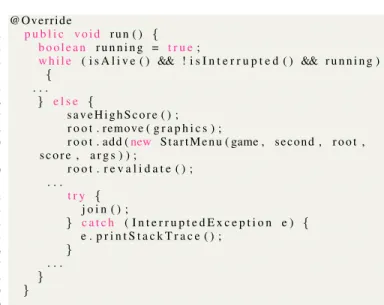
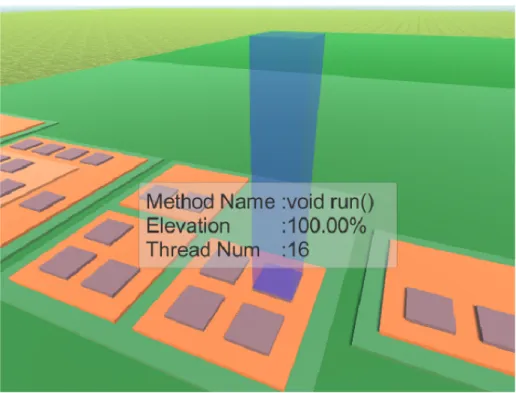
(7) TABLE I C ASE O NE : S UMMARY OF PROGRAM ATTRIBUTES DURING THE IDENTIFICATION OF A M ULTI -T HREADING L EAK Commit Date. TABLE II C ASE T WO : D ISTRICT C HANGES BASED ON R EFACTORING ACTIVITIES. Oct 7, 2016. # of Packages # of Classes # of Lines of Code. 8 24 1681. Commit Date. Before Oct 5, 2016. After Oct 5, 2016. Classes Lines of Code. 24 1681. 24 1682. Changed Packages Changed files Added Lines of Code Deleted Lines of Code. 8 22 59 58. (i.e., 103 commits) and the program size (i.e., number of packages and lines of code). 1 2. V. C ASE S TUDIES. 3 4. 5. We introduce two case studies that were used in our 6 experiments. The first case study is a demonstration of how the 7 building height can be used to highlight sections in the code 89 that are highly executed. We also would like to show how this simple but effective indicator of some potential performance 10 11 issues in the source code. 12 The second case study is a demonstration of how we utilize 13 the structure of the CodeCity metaphor to depict evolutionary 14 15 changes in the target program. Specifically, we would like to 16 show how the prototype is able identify structural changes 17 that have over two versions of the target program. We also 18 19 show and discuss how performance is affected by these code 20 changes.. A. Case One: Analysis of Performance with Multi-Threading The first case study demonstrates how our prototype is able to identify and monitor issues related to multi-threading and memory consumption in a software program. Table I describes the source code snapshot of the latest version of the target program (last modified Oct 2016). The table shows that our target program consists of 8 packages, 24 classes and 1,681 lines of code. We find that the target program has a run() method is the interface that is intended to be executed by a thread. Figure 6 clearly shows a highly executed method (i.e., run()), with a high elevation (100%). We notice that this building has no fluctuation in height and it constantly at 100% height. Furthermore, the height of this building does not fluctuate, even when the user has ended a game and starts a new game. As shown in Figure 6, we can see that there is 16 threads created for the run() method. This corresponds with the user interaction (i.e., user has restarted the game 16 times). Furthermore, the source code reveals that the run() method is comprised of a loop that creates a new thread each time a new game is created by a user.. @Override p u b l i c void run ( ) { boolean running = t r u e ; w h i l e ( i s A l i v e ( ) && ! i s I n t e r r u p t e d ( ) && r u n n i n g ) { ... } else { saveHighScore ( ) ; r o o t . remove ( g r a p h i c s ) ; r o o t . add ( new S t a r t M e n u ( game , s e c o n d , r o o t , score , args ) ) ; root . revalidate () ; ... try { join () ; } catch ( InterruptedException e ) { e . printStackTrace () ; } ... } } Listing 1. Code Snippet showing the join() method in the MainSinglePlayerThread class. Listing 1 shows the snippet of the portion of the code that allows prior threads to remain alive (i.e., MainSinglePlayerThread class). We are unsure of the developer’s intention, however, we find that the run() method does not implement any management of the threading. Potentially, this performance issue may result in a OutOfMemoryExceptions if these pool of threads are large enough, that will cause the application to crash. Due to the nature of the application (i.e., gaming application) and amount of memory consumed by each thread, we could assume that this issue may not have a significant impact on the usual performance of the application. However, is a design concern as ‘programmers can typically get into trouble sizing data structures such as threads, understanding per-entry costs, and managing the lifetimes of these structures’ [23] . One possible fix to manage this concurrency issue, is to kill each thread every time a game has ended, especially for this single player mode. Subsequently, the program should start a new thread each time a new game is created. To remedy this issue, we have contacted the developer with our recommended solution7 . 7 We. have raised a pull-request at https://github.com/exal99/Tetris/pull/3.
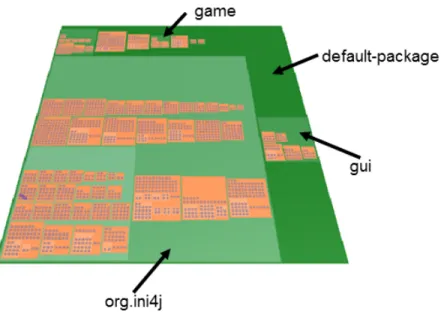
(8) Fig. 6. A high-rise building indicates a performance issue. In this example, we find that the high riser is caused by a thread leak with multiple-threading. We find that the method invokes a new thread each time the user restarts for a new game.. B. Case Two: Analysis of Performance in an Evolving City The second case study demonstrates how our prototype is able to model any structural changes as the program evolves. Concretely, we show the performance when a set of refactoring operations have been applied to a newer version of the software. This example show be able to show that the refactorings have no effect on the performance of the application. Table II describes the source code snapshots between a refactoring commit on the source code (5th October 2016)8 . We can see in the table that although the commit resulted in 1 additional line of code, there was code changes to 22 files we 59 added lines and 58 deletion. Upon the inspection of difference in the source code, we find that the commit included the integration of the main package, which involved importing (i.e., using the import keyword) new package structures. According to the commit message, the developers were ‘Made all packegase subpackeges to prepare for the ai’. Figure 7 shows how our prototype able to detect and show these changes in the source code structure as landscapes changes of the district. As shown in Figure 7a, before the refactoring, we find that there are nine districts in the city. The biggest district shown in the figure represents the thirdparty library, Ini4j9 , which is a simple Java API for handling configuration files in Windows .ini format. As highlighted in 8 The commit is accessible at https://github.com/exal99/Tetris/commit/ 925883f60f2dc2e57bd42ccf990637c89843ff8e 9 website at http://ini4j.sourceforge.net/. the figure, we observe that the classes related to the user interface (i.e., gui packages) are clearly in different locations compared to the game packages. Later in Figure 7b, after the refactoring, the structure of the city has changed. Under closer inspection of the code, we observe that the developer had introduced a new main class (i.e., main.java) and main package into the program. In the newer version, we find that all the game packages and classes have been merged into the the newer main.game packages. As shown in the Figures, these set of refactoring operations have no impact on performance. Although this trivial example has no apparent impact on performance, it is a useful case to demonstrate how our prototype is able to depict changes in the program ‘design’ structure between two versions of a program. VI. D ISCUSSION In this section, we discuss implications of our results. Specifically, we discussing the implications in terms of the generality, visual scalability, ease of use, practicality and potential future avenues such as additional scenarios for a user. A. Generality In our case study, we performed our experiments on a Java application. Currently our implementation is limited to executable Java bytecode binaries. However, we believe that this visualization can be extended to other programming languages..
(9) (a) District design layout before refactoring operations were applied to some methods. (b) District design layout after refactoring operations were applied to some methods Fig. 7. Evolution of the district structure of the city that reflect refactoring activities applied to the target program..
(10) B. Visual Scalability Indeed our visual design takes advantage of the CodeCity metaphor to depict program structure and identify performance issues. However, the visualization as yet does not fully realize the other aesthetic features such as color and aspect ratio. In a real-time situation, however, we did consider whether or not other features would be more distracting and information overload. Therefore, our future plan would be to slowly add other useful elements to the visual design, while keeping the user engaged. With the scalability, prior works show how the cities metaphor can be used to analyze massive software projects. In this example, we used a simple example with a single third-party library included. However we believe that the visualization is scalable to larger code bases. For future work, we would like to experiment with larger projects that have much more complex structures than our current case study. C. Ease of Use The CodeCity visualization has been popularly used in both the research community and the industry alike. With just elevation to represent performance, we conjecture that the visualization is both intuitive and very simple to use. To validate our claims, a user case study of our tool is needed and this is envisioned as a future extension of this work. D. Practicality Since current tools require a snapshot window, we conjecture that most profiling is specifically targets towards scripted sequences in a program. We discovered that an advantages of the real-time profiling is the ability to run the program unscripted, thus potentially capturing these unexpected sequences while running a program. This is especially beneficial for gaming applications that have complex GUI implementations. Through case scenario executions of the prototype, we were able to demonstrate some of the useful applications of our visualization. However, in this study, we did not consider other considerations such as the overhead costs and delay with multi-threading. This may become an issue with multiple threads with a large scale system. As future work, we plan to measure the overheads using benchmarks such as the DaCapo Benchmark [24]. E. Additional Scenarios and Future Work In this paper, we present only two cases of how our visualization can be leveraged to show issues of (i) handling multi-threading and (ii) impact of refactoring activities. We believe that there is still many other scenarios that are needed to be tested. Below is are two scenarios that we would like to explore: • evaluating scenarios that include large-scale target programs with complex GUI implementations. • identification and differentiation of concurrent executions (i.e., multiple threads execution over the same method). A possibility would be tracking each individual thread and using visualization properties such as color.. Additionally, it would be beneficial to receive feedback from practitioners. Such feedback would allow us to make future improvements. We should consider these future enhancements to our proposed solution as future work. Compared to the related works that have used the CodeCity metaphor, our proposed visualization has not used many of the other aspects such as color, shape and area density properties. Therefore, as future work, we would like to investigate and utilize these properties to provide complementary information that a user may find useful. VII. C ONCLUSION In this paper, we present a visualization tool that is used to profile performance of a program in real-time that is based on the CodeCity visualization. Our key is to demonstrate the usefulness and practicality of this visualization. Using a prototype, we illustrate through case studies of a real-world implementation of a gaming application to identify (i) analysis of a potential thread leakage and (ii) the performance in an evolving city. For future work, we plan to further explore how the other city attributes could be utilized to enrich the profiling of performance for software applications. ACKNOWLEDGMENT This work has been supported by JSPS KAKENHI Grant Number 16H05857 and JP26280021. R EFERENCES [1] M. M. Lehman, “Laws of software evolution revisited,” in Proceedings of the 5th European Workshop on Software Process Technology, ser. EWSPT ’96. London, UK, UK: Springer-Verlag, 1996, pp. 108–124. [Online]. Available: http://dl.acm.org/citation.cfm?id=646195.681473 [2] S. Maple. (2015) Top 5 Java profilers revealed: Real world data with VisualVM, JProfiler, Java Mission Control, YourKit and Custom tooling. [Online]. Available: https://zeroturnaround.com/rebellabs/top5-java-profilers-revealed-real-world-data-with-visualvm-jprofiler-javamission-control-yourkit-and-custom-tooling/ [3] J. P. S. Alcocer, A. Bergel, S. Ducasse, and M. Denker, “Performance evolution blueprint: Understanding the impact of software evolution on performance,” in 2013 First IEEE Working Conference on Software Visualization (VISSOFT), Sept 2013, pp. 1–9. [4] A. Bergel, R. Robbes, and W. Binder, Visualizing Dynamic Metrics with Profiling Blueprints. Berlin, Heidelberg: Springer Berlin Heidelberg, 2010, pp. 291–309. [Online]. Available: http://dx.doi.org/10.1007/9783-642-13953-6 16 [5] C. P. Bezemer, J. Pouwelse, and B. Gregg, “Understanding software performance regressions using differential flame graphs,” in 2015 IEEE 22nd International Conference on Software Analysis, Evolution, and Reengineering (SANER), March 2015, pp. 535–539. [6] D. Holten, B. Cornelissen, and J. J. van Wijk, “Trace visualization using hierarchical edge bundles and massive sequence views,” in 2007 4th IEEE International Workshop on Visualizing Software for Understanding and Analysis, June 2007, pp. 47–54. [7] W. De Pauw and S. Heisig, “Zinsight: A visual and analytic environment for exploring large event traces,” in Proceedings of the 5th International Symposium on Software Visualization. New York, NY, USA: ACM, 2010, pp. 143–152. [Online]. Available: http://doi.acm.org/10.1145/1879211.1879233 [8] E. Blanton, D. Lessa, P. Arora, L. Ziarek, and B. Jayaraman, “Ji.fi: Visual test and debug queries for hard real-time,” Concurrency and Computation: Practice and Experience, vol. 26, no. 14, pp. 2456–2487, 2014. [Online]. Available: http://dx.doi.org/10.1002/cpe.3156.
(11) [9] W. D. Pauw, E. Jensen, N. Mitchell, G. Sevitsky, J. M. Vlissides, and J. Yang, “Visualizing the execution of java programs,” in Revised Lectures on Software Visualization, International Seminar. London, UK, UK: Springer-Verlag, 2002, pp. 151–162. [Online]. Available: http://dl.acm.org/citation.cfm?id=647382.724791 [10] Y. Watanabe, T. Ishio, and K. Inoue, “Feature-level phase detection for execution trace using object cache,” in Proceedings of International Workshop on Dynamic Analysis, 2008, pp. 8–14. [11] S. Voigt, J. Bohnet, and J. Dollner, “Object aware execution trace exploration,” in 2009 IEEE International Conference on Software Maintenance, Sept 2009, pp. 201–210. [12] S. Medini, G. Antoniol, Y.-G. Gueneuc, M. D. Penta, and P. Tonella, “SCAN: an Approach to Label and Relate Execution Trace Segments,” in WCRE 2012, 2012. [13] S. P. Reiss, “Dynamic detection and visualization of software phases,” in Proceedings of the Int’l Workshop on Dynamic Analysis, May 2005, pp. 1–6. [14] G. Ammons, T. Ball, and J. R. Larus, “Exploiting hardware performance counters with flow and context sensitive profiling,” SIGPLAN Not., vol. 32, no. 5, pp. 85–96, May 1997. [Online]. Available: http://doi.acm.org/10.1145/258916.258924 [15] W. D. Pauw, S. Krasikov, and J. F. Morar, “Execution patterns for visualizing web services,” in Proceedings of SoftVis, 2006, pp. 37–45. [Online]. Available: http://dl.acm.org/citation.cfm?id=1148499 [16] Y. Yamaguchi and T. Itoh, “Visualization of distributed processes using ”data jewelry box” algorithm,” in Proceedings of Computer Graphics International, July 2003, pp. 162–169. [17] R. Wettel, M. Lanza, and R. Robbes, “Software systems as cities: A controlled experiment,” in Proceedings of the 33rd International Conference on Software Engineering, ser. ICSE ’11. New York, NY, USA: ACM, 2011, pp. 551–560. [18] C. Russo dos Santos, P. Gros, P. Abel, D. Loisel, N. Trichaud, and J.-P. Paris, “Mapping information onto 3D virtual worlds,” in IV 2000,. IEEE International Conference on Information Visualization, 19-21 July 2000, London, UK, London, UNITED KINGDOM, 07 2000. [Online]. Available: http://www.eurecom.fr/publication/616 [19] T. Panas, R. Berrigan, and J. Grundy, “A 3D metaphor for software production visualization,” in Proceedings on Seventh International Conference on Information Visualization, 2003. IV 2003., July 2003, pp. 314–319. [20] C. Knight and M. Munro, “Virtual but visible software,” in Proceedings of the International Conference on Information Visualisation, ser. IV ’00. Washington, DC, USA: IEEE Computer Society, 2000, pp. 198–. [Online]. Available: http://dl.acm.org/citation.cfm?id=518910.850420 [21] S. M. Charters, C. Knight, N. Thomas, and M. Munro, “Visualisation for informed decision making; from code to components,” in Proceedings of the 14th International Conference on Software Engineering and Knowledge Engineering, ser. SEKE ’02. New York, NY, USA: ACM, 2002, pp. 765–772. [Online]. Available: http://doi.acm.org/10.1145/568760.568891 [22] R. Wettel and M. Lanza, “Visually localizing design problems with disharmony maps,” in Proceedings of the 4th ACM Symposium on Software Visualization, ser. SoftVis ’08. New York, NY, USA: ACM, 2008, pp. 155–164. [Online]. Available: http://doi.acm.org/10.1145/ 1409720.1409745 [23] N. Mitchell and G. Sevitsky, “The causes of bloat, the limits of health,” SIGPLAN Not., vol. 42, no. 10, pp. 245–260, Oct. 2007. [Online]. Available: http://doi.acm.org/10.1145/1297105.1297046 [24] S. M. Blackburn, R. Garner, C. Hoffman, A. M. Khan, K. S. McKinley, R. Bentzur, A. Diwan, D. Feinberg, D. Frampton, S. Z. Guyer, M. Hirzel, A. Hosking, M. Jump, H. Lee, J. E. B. Moss, A. Phansalkar, D. Stefanovi´c, T. VanDrunen, D. von Dincklage, and B. Wiedermann, “The DaCapo benchmarks: Java benchmarking development and analysis,” in OOPSLA ’06: Proceedings of the 21st annual ACM SIGPLAN conference on Object-Oriented Programing, Systems, Languages, and Applications. ACM Press, Oct. 2006, pp. 169–190..
(12)
図
+5
関連したドキュメント
In Section 3 the extended Rapcs´ ak system with curvature condition is considered in the n-dimensional generic case, when the eigenvalues of the Jacobi curvature tensor Φ are
In the second computation, we use a fine equidistant grid within the isotropic borehole region and an optimal grid coarsening in the x direction in the outer, anisotropic,
Keywords: continuous time random walk, Brownian motion, collision time, skew Young tableaux, tandem queue.. AMS 2000 Subject Classification: Primary:
By considering the p-laplacian operator, we show the existence of a solution to the exterior (resp interior) free boundary problem with non constant Bernoulli free boundary
This paper presents an investigation into the mechanics of this specific problem and develops an analytical approach that accounts for the effects of geometrical and material data on
While conducting an experiment regarding fetal move- ments as a result of Pulsed Wave Doppler (PWD) ultrasound, [8] we encountered the severe artifacts in the acquired image2.
In the proofs of these assertions, we write down rather explicit expressions for the bounds in order to have some qualitative idea how to achieve a good numerical control of the
Wro ´nski’s construction replaced by phase semantic completion. ASubL3, Crakow 06/11/06
