IRUCAA@TDC : Magnetic resonance signal intensity from retrodiscal tissue related to joint effusion status and disc displacement in elderly patients with temporomandibular joint disorders
9
0
0
全文
(2) 55. Bull Tokyo Dent Coll (2009) 50(2): 55–62. Original Article. Magnetic Resonance Signal Intensity from Retrodiscal Tissue Related to Joint Effusion Status and Disc Displacement in Elderly Patients with Temporomandibular Joint Disorders Mai Ohkubo*,**, Tsukasa Sano**, Mika Otonari-Yamamoto**, Yoshihiko Hayakawa***, Tomohiro Okano****, Kaoru Sakurai*****, Toru Sato******, Tetsuya Sugiyama*,***** and Ryo Ishida*,****** *Department of Dysphagia Rehabilitation and Community Dental Care, Tokyo Dental College, 1-2-2 Masago, Mihama-ku, Chiba 261-8502, Japan **Department of Oral & Maxillofacial Radiology, Tokyo Dental College, 1-2-2 Masago, Mihama-ku, Chiba 261-8502, Japan ***Department of Computer Sciences, Faculty of Engineering, Kitami Institute of Technology, 165, Koen-cho, Kitami, Hokkaido 090-8507, Japan ****Department of Radiology, Showa University School of Dentistry, 2-1-1 Kitasenzoku, Ota-ku, Tokyo 145-8515, Japan *****Department of Removable Prosthodontics and Gerodontology, Tokyo Dental College, 1-2-2 Masago, Mihama-ku, Chiba 261-8502, Japan ******Department of Crown and Bridge Prosthodontics, Tokyo Dental College, 1-2-2 Masago, Mihama-ku, Chiba 261-8502, Japan. Received 20 June, 2008/Accepted for publication 2 March, 2009. Abstract Magnetic resonance imaging (MRI) on patients with temporomandibular joint disorders (TMD) has revealed that a decrease and/or increase in signal intensity from retrodiscal tissue, joint effusion (the excessive accumulation of joint fluid) and articular disc displacement are related to TMD. However, the effect of aging on these phenomena has yet to be clarified. This study was carried out to explore the relationship between changes in signal intensity from retrodiscal tissue, joint fluid status and pathological disc conditions in elderly patients with TMD. Twenty patients aged over 60 years were examined. They consisted of one man and 19 women, and ranged between 60 and 79 years in age (mean, 66.0 years). The relationships between decreased signal intensity on proton-density-weighted (PDW) images and increased signal intensity on T2-weighted (T2W) MR images from retrodiscal tissue, joint fluid status and state of articular disc were examined. Joint fluid status was classified into 5 levels by extent of high signal areas in upper and lower articular spaces on T2W images. Disc displacement status was evaluated by PDW images. The Wilcoxon test was applied for the statistical analysis. The group showing increased T2W signal intensities from the retrodiscal tissue consisted of 31 out of 40 joints (77.5%). This group showed a significant difference in comparison with the other groups in which no apparent joint fluid was shown (p⬍0.05). There were no statistically significant differences among other categories. The results suggest a negative relationship between joint fluid and increased signal intensity from retrodiscal tissue due to reflection of the inflammatory reaction in TM joints. Key words:. Temporomandibular joint disorders —Magnetic resonance imaging — Elderly patients. 55.
(3) 56. Ohkubo M et al.. Introduction Temporomandibular disorders (TMD) may become more prevalent with increasing age. Many reports on TMD in pediatrics and adults have been published, but few on elderly TMD patients1,3). Many elderly people show symptoms of TMD such as clicking, asymmetric mouth-opening, and pain on opening the mouth widely and chewing. However, often they do not complain, nor seek appropriate professional help for their condition1). They recognize their TMD symptoms, but can not explain them to others. In severe cases, signs such as lower ingestion may alert medical or dental professionals to the presence of this disorder. MR (magnetic resonance) imaging (MRI) has evolved as the prime diagnostic tool for soft-tissue abnormality of the temporomandibular joint (TMJ)7,10,11,19,20). Furthermore, MR images are equal to, or possibly better than, at least standard tomography for the detection of cortical bone components, despite limited visualization11). Therefore MRI, as a non-invasive and accurate examination tool, has replaced CT and arthrographic examinations of the TMJ. Epidemiologic studies of the TMD in elderly patients have been reported. However, MR imaging diagnosis has not been applied in these studies. The joint effusion which may occur in joints with inflammatory arthritis is well depicted by MR imaging7,13,24,25,28), and the relationships between joint effusion and pain, disc displacement, and bone and bone marrow changes in the TMJ have been studied7,11,13,24,26,28). Decreased signal intensities from retrodiscal tissue on T1 images were associated with the later stages of disc displacement27). Increased signal intensities from retrodiscal tissue on T2-weighted (T2W) images were reportedly higher in painful joints15). However, there have been no studies on the relationships among an increase and/or decrease in signal intensities in retrodiscal tissue, joint fluid status and pathological disc condition as a phenomenon of aging. The aim of this study was to evaluate the relation-. ships between MR signal intensity from retrodiscal tissue, joint fluid status and disc displacement in elderly patients.. Materials and Methods 1. Subjects A total of 40 joints were studied in 20 patients consisting of one man and 19 women aged over 60 years (to 79 years as a maximum), with a mean age of 66.0 years. These patients were drawn from a total of 301 patients referred for MRI due to a diagnosis of suspected TMD. 2. Imaging conditions MRI was performed with the following 4 kinds of unit: the Magnetom Expert 1.0T, the Magnetom Vision 1.5T and the Magnetom Impact 1.0T (Siemens, Erlangen, Germany), and the Signa 1.5T (GE Healthcare, Milwaukee, USA) using surface coils specificallydesigned for TMJ imaging. Oblique sagittal cross-sectional plane images, which were oriented according to the individual angle of the mandibular condyle, were obtained as described by Musgrave et al.14). The examination to take oblique sagittal images was repeated twice at both open and closed mouth positions. At those imaging slices, proton-density weighted (PDW) images and T2W images were taken7). The fast spin echo technique was applied. Scanning parameters are listed in Table 1. Each MR image was provided for diagnosis by an oral and maxillofacial radiologist and also for discussion by two radiologists until they reached a consensus. A five-grade rating system, originally proposed by Larheim, et al.10) was applied for classification of the extent of joint fluid/effusion: the high or low signalintensity areas in the upper and lower joint spaces on T2W images were classified into No Fluid (score: 0), Minimal Fluid (1), Moderate Fluid (2), Marked Fluid (3), or Extensive Fluid (4) in sequence. Joint fluid/effusion status was evaluated and calculated using this score. Abnormality in shape and displacement.
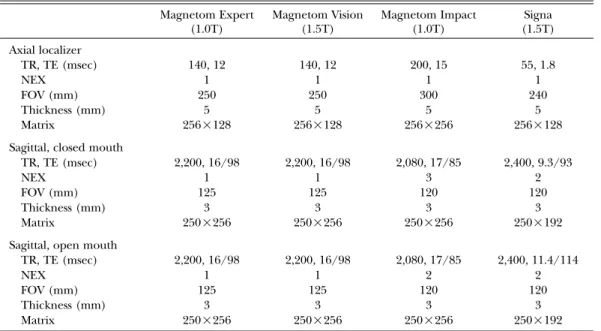
(4) 57. MR Signal and Disc in Elderly with TMD. Table 1 Scanning parameters for MRI Magnetom Expert (1.0T). Magnetom Vision (1.5T). Magnetom Impact (1.0T). Signa (1.5T). 140, 12 1 250 5 256⳯128. 140, 12 1 250 5 256⳯128. 200, 15 1 300 5 256⳯256. 55, 1.8 1 240 5 256⳯128. Sagittal, closed mouth TR, TE (msec) NEX FOV (mm) Thickness (mm) Matrix. 2,200, 16/98 1 125 3 250⳯256. 2,200, 16/98 1 125 3 250⳯256. 2,080, 17/85 3 120 3 250⳯256. 2,400, 9.3/93 2 120 3 250⳯192. Sagittal, open mouth TR, TE (msec) NEX FOV (mm) Thickness (mm) Matrix. 2,200, 16/98 1 125 3 250⳯256. 2,200, 16/98 1 125 3 250⳯256. 2,080, 17/85 2 120 3 250⳯256. 2,400, 11.4/114 2 120 3 250⳯192. Axial localizer TR, TE (msec) NEX FOV (mm) Thickness (mm) Matrix. FOV⳱field of view NEX⳱number of exposures. of the articular disc were evaluated by PDW images and classified into 4 categories as follows: normal superior disc position with normal function, disc displacement with reduction, disc displacement without reduction, or disc displacement without reduction associated with osteoarthritis15), that is to say, there were one normal-function group and 3 abnormalfunction groups. Increased signal intensity from retrodiscal tissue was evaluated by oblique sagittal T2W images at open mouth. Signal intensity was relatively compared to those of the cerebral cortex of the temporal lobe based on T2W images. Each signal intensity from the retrodiscal tissue was classified into one of two groups, namely, high or low. On the other hand, decreased signal intensity from the retrodiscal tissue was evaluated by oblique sagittal PDW images at closed mouth. Decreased signal intensity on each image was noted when there was a well-defined area of clearlydepicted low-signal in the retrodiscal tissue. Therefore, each signal intensity from the retrodiscal tissue was categorized into one of. two groups, namely, absence or presence of decreased signal intensity. Collected data were statistically analyzed by means of the Wilcoxon’s rank-sum test. The a priori level of significance was set at 0.05.. Results 1. Joint fluid and disc displacement Joint fluid status in the total 40 joints was evaluated as follows: 8 for No Fluid (grade 0, 20%), 23 for Minimal Fluid (grade 1, 57.5%), 7 for Moderate Fluid (grade 2, 17.5%), 1 for Marked Fluid (grade 3, 2.5%) and 1 for Extensive Fluid (grade 4, 2.5%). Disc displacement status in the total 40 joints was evaluated as follows: 21 for normal superior disc position with normal function (52.5%), 9 for disc displacement with reduction (22.5%), 2 for disc displacement without reduction (5%), 8 for disc displacement without reduction associated with osteoarthritis (20%)..
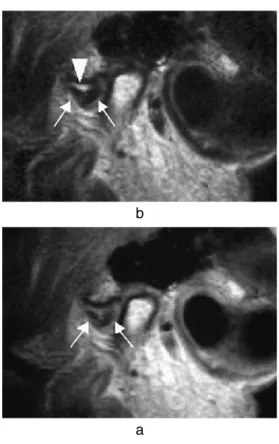
(5) 58. Ohkubo M et al.. Table 2 Relationship between increased signal intensity from retrodiscal tissue on T2W images and joint fluid status Increased signal intensity from retrodiscal tissue Higher group Lower group. No. of joint. Mean score of fluid. 31 9. 0.90 1.78. *. p⬍0.05 using Wilcoxon test between increased T2W signal intensity from retrodiscal tissue and joint fluid (n⳱40TMJs). Table 3 Relationship between disc displacement and joint fluid Disc displacement. No. of joint. Mean score of fluid. Normal superior disc position with normal function. 21. 0.95. Disc displacement. 19. 1.26. Note (1): Joint fluid/effusion status scores were same as in Table 2. Note (2): Disc displacement status in detail was classified as follows: Normal superior disc position with normal function (21 joints, 52.5%) Disc displacement with reduction (9 joints, 22.5%) Disc displacement without reduction (2 joints, 5%) Disc displacement without reduction associated with osteoarthritis (8 joints, 20%). 2. Increased signal intensity of retrodiscal tissue on T2W images at open mouth versus joint fluid and disc displacement Signal intensity from the retrodiscal tissue on T2W images was increased in 31 joints (higher group, 77.5%) and not increased in 9 joints (lower group, 22.5%), as shown in Table 2. The results showed a statistically significant difference between the 2 groups (p⬍0.05). Mean fluid decreased in the higher group in comparison with the lower group. It was suggested that there was a negative relationship between increased signal intensity from the retrodiscal tissue and the joint fluid. Concerning the relationship between disc displacement status and joint fluid status, mean scores for fluid were 0.95 for 21 normal position/function joints and 1.26 for other abnormal joints, as shown in Table 3. There was a tendency for the joint fluid score to be lower in the normal position/function group compared to in the abnormal-joint group. However, the results showed no statistically significant difference between the 2 groups. A clinical case is shown in Fig. 1.. b. a Fig. 1 A 60-year-old woman A sagittal oblique PDW image (a) and corresponding T2W image (b) show anterior displacement and deformity of articular disc (arrow). Joint fluid was observed at upper joint spaces (arrow head)..
(6) 59. MR Signal and Disc in Elderly with TMD. Table 4. Relationship between decreased signal intensity from retrodiscal tissue on PDW images and joint fluid status. Decreased signal intensity from retrodiscal tissue. No. of joint. Mean score of fluid. absent. 30. 1.17. present. 10. 0.90. Note: Joint fluid/effusion status scores were the same as Table 2.. Fig. 2 A 65-year-old woman A sagittal oblique PDW image shows decreased signal intensity in retrodiscal tissue (arrow).. Table 5. Relationship between disc displacement and decreased signal intensity from retrodiscal tissue on PDW images Decreased signal intensity from retrodiscal tissue on PDW images Disc displacement. No. of joint. Normal superior disc position with normal function Disc displacement with reduction Disc displacement without reduction Disc displacement without reduction associated with osteoarthritis. 3. Decreased signal intensity of retrodiscal tissue on PDW at open mouth versus joint fluid and disc displacement Decreased signal intensity in the retrodiscal tissue on PDW images was observed in 10 joints (25%), as shown in Table 4. A clinical case is shown in Fig. 2. The residual 30 joints showed no MR evidence of decreased signal intensity. absence (30 in total). presence (10 in total). 21 (52.5%) 9 (22.5%) 2 (5%). 14 8 2. 7 1 0. 8 (20%). 6. 2. in the retrodiscal tissue on PDW images. The results showed no statistically significant difference between the 2 groups. Additionally, no appreciable relationship between decreased signal intensity from the retrodiscal tissue on PDW images and disc displacement status was found, as shown in Table 5..
(7) 60. Ohkubo M et al.. Discussion Joint effusion is the pathologic accumulation of joint fluid in the joints and is associated with inflammation. This fluid is well depicted on T2W images7,13,18,24,26,28). Joint fluid accumulations are only observed in symptomatic patients. However, small amounts of joint fluid are observed among asymptomatic individuals7). Furthermore, synovial fluid was reported to show quantitative and qualitative changes in response change in the TMJ17). A biochemical analysis revealed that various components in synovial fluid were related to pain8,24). One study reported that the release or activation of matrix metalloproteinases and collagenases in fibroblasts and chondrocytes in tissues are involved when regressive changes in the synovial membrane are present. Therefore, a high joint fluid score is seen as indicating an inflammatory condition. The relationship between joint pain, joint fluid and disc displacement is subject to intensive research. Dynamic contrast-enhanced MRI with closed mouth revealed that TMJs with pain or dysfunction had a higher signal intensity than those without pain or dysfunction22,23). On T2W images with mouth open, a slight increase in signal intensity in painful joints was observed in comparison with painfree joints17). These findings indicate a higher degree of vascularity in painful joints. In histological studies, the number of vessels in the posterior disc attachment (retrodiscal tissue) increased in pathological joints9). The retrodiscal tissue of patients with symptomatic disc derangement was hyperemic, with perivascular inflammation4). Furthermore, Scapino21) reported that venous channels in the temporal part of the retrodiscal tissue were conspicuously dilated. Isacsson et al.5) demonstrated that the nonhyalinized posterior disc attachment was an intense red color, with marked histological changes in the vessels, including thickening of the walls and extravasation of erythrocytes and fibrin. Other studies on retrodiscal tissue have demonstrated vascular changes, with thickening of the vessel walls2). Isberg et al.6) reported. thickening of the walls of the capillaries, veins and arteries, with narrowing of the lumina and occasional obliteration of the vessel and extravasated erythrocytes in the connective tissue of retrodiscal tissue. These findings are in agreement with those of Hall et al.2). They also found thickening of the arterial walls, suggesting endothelial proliferation and possibly restriction of blood flow in retrodiscal tissue. These pathological findings may indicate either increased or decreased vascularity, and are not fully in accordance with the MR findings of several other studies. In a study of Takaku et al.25), all 11 joints in symptomatic subjects showed fibrous tissue hyperplasia, 6 of the 11 joints showed decreased vascularity compared with control joints, and 7 of them showed edematous changes in some areas of the retrodiscal tissue; however, they reported that all of the 11 joints showed higher MR signal intensity in the retrodiscal tissue compared with control joints. This may appear somewhat contradictory, unless we consider that water content, reflecting vascularity, is the most likely cause of this increased signal intensity on MR images. Therefore, this increased signal intensity on MR images indicates the presence of inflammation in the joint spaces. This study found a negative relationship between joint fluid and increased signal intensity from the retrodiscal tissue on T2 images. Therefore, in joint spaces associated with inflammation, it is appeared as synovial fluid, which yielded quantitative and qualitative alterations in response to changes occurring in the TMJ. Alternatively, the higher degree of vascularity in the retrodiscal tissue was hyperemic, with perivascular inflammation. Other studies in non-elderly patients have demonstrated a statistically significant association between increased relative signal intensity from retrodiscal tissues on T2W images and joint effusion12). Oral environmental factors such as whether the patient is edentulous, using dentures or without molar support may further complicate the issue. Previous reports suggested a relationship between disc displacement and joint effu-.
(8) MR Signal and Disc in Elderly with TMD. sion10,26). However, we found no statistically significant relationship between disc displacement and joint fluid. This result suggests that a large quantity of fluid is related to disc displacement, whereas a small quantity is probably not. Decreased signal intensity in retrodiscal tissue may be associated with fibrous changes. The theory is that the decrease in pain that is frequently observed in longstanding disc displacement is the result of fibrous changes in the retrodiscal tissue. Reportedly, a clinically observed decrease in T1 signal intensity in the retrodiscal tissue may not suggest an increased density of collagen fibers. Indeed, it may reflect their loose distribution16). However, we found no statistically significant relationship between decreased signal intensity and disc displacement or joint fluid. The question remains as to whether decreased signal intensity imaging is specific to elderly patients or not. To explore the clinical significance of changes in retrodiscal tissue also necessitates further study. In conclusion this study found a relationship between decreased amount of joint fluid and increased signal intensity from retrodiscal tissue, which reflected an inflammatory reaction in the TMJ. In future, this should be taken as an indication of TMD in elderly patients.. 5). 6). 7). 8). 9). 10). 11). References 12) 1) Greene CS (1994) Temporomandibular disorders in the geriatric population. J Prosthet Dent 72:507–509. 2) Hall MB, Brown RW, Baughman RA (1984) Histologic appearance of the bilaminar zone in internal derangement of the temporomandibular joint. Oral Surg Oral Med Oral Pathol 58:375–381. 3) Hiltunen K, Peltola JS, Vehkalahti M, Narhi T, Ainamo AA (2003) 5-year follow-up of signs and symptoms of TMD and radiographic findings in the elderly. Int J Prosthodont 16: 631–634. 4) Holmlund AB, Gynther GW, Reinholt FP (1992) Disk derangement and inflammatory. 13). 14). 61. changes in the posterior disk attachment of the temporomandibular joint. A histologic study. Oral Surg Oral Med Oral Pathol 73: 9–12. Isacsson G, Isberg A, Johansson AS, Larson O (1986) Internal derangement of the temporomandibular joint: radiographic and histologic changes associated with severe pain. J Oral Maxillofac Surg 44:771–778. Isberg A, Isacsson G, Johansson AS, Larson O (1986) Hyperplastic soft-tissue formation in the temporomandibular joint associated with internal derangement. A radiographic and histologic study. Oral Surg Oral Med Oral Pathol 61:32–38. Katzberg RW, Westesson PL, Tallents RH, Anderson R, Kurita K, Manzione JV, Totterman S (1988) Temporomandibular joint: MR assessment of rotational and sideways disk displacements. Radiology 169:741–748. Kubota E, Kubota T, Matsumoto J, Shibata T, Murakami K (1998) Synovial fluid cytokines and proteinases as markers of temporomandibular joint disease. J Oral Maxillofac Surg 56:192–198. Kurita K, Westesson PL, Sternby NH, Eriksson L, Carlsson LE, Lundh H, Toremalm NG (1989) Histologic features of the temporomandibular joint disk and posterior disk attachment: comparison of symptom-free persons with normally positioned disks and patients with internal derangement. Oral Surg Oral Med Oral Pathol 67:635–643. Larheim TA, Westesson PL, Sano T (2001) MR grading of temporomandibular joint fluid: association with disk displacement categories, condyle marrow abnormalities and pain. Int J Oral Maxillofac Surg 30:104–112. Laskin DM (1993) Diagnosis of pathology of the temporomandibular joint. Clinical and imaging perspectives. Radiol Clin North Am 31:135–147. Lee SH, Yoon HJ (2009) The relationship between MRI findings and the relative signal intensity of retrodiscal tissue in patients with temporomandibular joint disorders. Oral Surg Oral Med Oral Pathol Oral Radiol Endod 107: 113–115. Murakami K, Segami N, Fujimura K, Iizuka T (1991) Correlation between pain and synovitis in patients with internal derangement of the temporomandibular joint. J Oral Maxillofac Surg 49:1159–1161. Musgrave MT, Westesson PL, Tallents RH, Manzione JV, Katzberg RW (1991) Improved magnetic resonance imaging of the temporomandibular joint by oblique scanning planes. Oral Surg Oral Med Oral Pathol 71:525–528..
(9) 62. Ohkubo M et al.. 15) Orsini MG, Kuboki T, Terada S, Matsuka Y, Yatani H, Yamashita A (1999) Clinical predictability of temporomandibular joint disc displacement. J Dent Res 78:650–660. 16) Sakuma K, Sano T, Yamamoto M, Tachikawa T, Okano T (2003) Does decreased T1 signal intensity in the retrodiscal tissue of the temporomandibular joint reflect increased density of collagen fibres? Dentomaxillofac Radiol 32: 222–228. 17) Sano T, Westesson PL (1995) Magnetic resonance imaging of the temporomandibular joint. Increased T2 signal in the retrodiscal tissue of painful joints. Oral Surg Oral Med Oral Pathol Oral Radiol Endod 79:511–516. 18) Sano T, Widmalm SE, Yamamoto M, Sakuma K, Araki K, Matsuda Y, Okano T (2003) Usefulness of proton density and T2-weighted vs. T1-weighted MRI in diagnoses of TMJ disk status. Cranio 21:253–258. 19) Sano T, Yamamoto M, Okano, T (2003) Temporomandibular joint: MR imaging. Neuroimag Clin N Am 12:583–595. 20) Sano T, Yamamoto M, Okano T, Gokan T, Westesson PL (2004) Common abnormalities in temporomandibular joint imaging. Curr Probl Diagn Radiol 33:16–24. 21) Scapino RP (1983) Histopathology associated with malposition of the human temporomandibular joint disc. Oral Surg Oral Med Oral Pathol 55:382–397. 22) Suenaga S, Hamamoto S, Kawano K, Higashida Y, Noikura T (1996) Dynamic MR imaging of the temporomandibular joint in patients with arthrosis: relationship between contrast enhancement of the posterior disk attachment and joint pain. Am J Roentgenol 166:1475– 1481.. 23) Suenaga S, Sonoda S, Oku T, Abeyama K, Noikura T (1997) MRI of the temporomandibular joint disk and posterior disk attachment before and after nonsurgical treatment. J Comput Assist Tomogr 21:892–896. 24) Takahashi T, Nagai H, Seki H, Fukuda M (1999) Relationship between joint effusion, joint pain, and protein levels in joint lavage fluid of patients with internal derangement and osteoarthritis of the temporomandibular joint. J Oral Maxillofac Surg 57:1187–1193. 25) Takaku S, Toyoda T, Sano T, Heishiki A (1995) Correlation of magnetic resonance imaging and surgical findings in patients with temporomandibular joint disorders. J Oral Maxillofac Surg 53:1283–1288. 26) Westesson PL, Brooks SL (1992) Temporomandibular joint: relationship between MR evidence of effusion and the presence of pain and disk displacement. Am J Roentgenol 159: 559–563. 27) Westesson PL, Paesani D (1993) MR imaging of the TMJ. Decreased signal from the retrodiskal tissue. Oral Surg Oral Med Oral Pathol 76:631–635. 28) Yamamoto M, Sano T, Okano T (2003) Magnetic resonance evidence of joint fluid with temporomandibular joint disorders. J Comput Assist Tomogr 27:694–698. Reprint requests to: Dr. Mai Ohkubo Department of Dysphagia Rehabilitation and Community Dental Care, Tokyo Dental College, 1-2-2 Masago, Mihama-ku, Chiba 261-8502, Japan.
(10)
図

関連したドキュメント
the pelvic space and prostate size using preoperative magnetic resonance imaging. (MRI) for difficult
Histologic appearance varies markedly from area to area in the same case, varying from vascular granulation tissue heavily in filtrated with both plasma cells and lymphocytes to
7.A Ogura, K Hayakawa, T Miyati, F Maeda: The effect of susceptibility of gadolinium contrast media on Diffusion-weighted imaging and the apparent Diffusion coefficient. Dose MD,
men. In women, we confirmed that only VAT but not SAT showed an independent association with insulin resistance as assessed by Matsuda ISI, in agreement with prior studies
Methods: IgG and IgM anti-cardiolipin antibodies (aCL), IgG anti-cardiolipin-β 2 glycoprotein I complex antibody (aCL/β 2 GPI), and IgG anti-phosphatidylserine-prothrombin complex
38) Comi G, et al : European/Canadian multicenter, double-blind, randomized, placebo-controlled study of the effects of glatiramer acetate on magnetic resonance imaging-measured
Here, we investigated the transethnic polygenetic features shared between Japanese PD patients and European patients with psychiatric disorders and their intermediate phenotypes
Narutaka OZAWA Joint work with Nicolas Monod.. Geometry and Analysis, Kyoto University, 16
