ESRI Research Note No.49
EBPMとエビデンスレベルの評価指標
土屋隆裕
July 2019
内閣府経済社会総合研究所
Economic and Social Research Institute
Cabinet Office
Tokyo, Japan
ESRI Research Note は、すべて研究者個人の責任で執筆されており、内閣府経済社会総合研究所の見解
を示すものではありません(問い合わせ先:
https://form.cao.go.jp/esri/opinion-0002.html
)
。
ESRI リサーチ・ノート・シリーズは、内閣府経済社会総合研究所内の議論の一端を
公開するために取りまとめられた資料であり、学界、研究機関等の関係する方々から幅
広くコメントを頂き、今後の研究に役立てることを意図して発表しております。
資料は、すべて研究者個人の責任で執筆されており、内閣府経済社会総合研究所の見
解を示すものではありません。
The views expressed in “
ESRI
Research Note” are those of the authors and not those of the
Economic and Social Research Institute, the Cabinet Office, or the Government of Japan.
EBPM
とエビデンスレベルの評価指標
土屋 隆裕:横浜市立大学データサイエンス学部教授
〔要旨〕
EBPM は客観的証拠に基づく政策立案・政策形成などと訳される。エビデンス、つ
まり客観的証拠が何を表すのかという点についてはいくつかの解釈があり得るが、一つ
の解釈は、今後実施する政策の有効性について事前に評価した結果というものである。
エビデンスをそのようにとらえた場合には、EBPM の推進に当たってエビデンスレベ
ルの評価指標の設定が不可欠である。しかし我が国ではそのような評価指標の整備はほ
とんど進んでいない。そこで諸外国における様々な評価指標とともに、評価結果の現状
を紹介し、今後の EBPM 推進の方向性を考察する。
1
EBPM
におけるエビデンスとは何か
1.1
客観的証拠に基づく政策立案
今後我が国が迎える人口減少社会において、限られた資源を有効に活用し、効率的な行政を
展開するため、
Evidence-Based Policy Making
(
EBPM
)への期待が高まっている。平成
29
年
5
月にまとめられた『統計改革推進会議 最終取りまとめ』
(統計改革推進会議
, 2017
)において
も、
EBPM
推進のための体制整備や統計等の整備・改善の必要性が強調されている。
EBPM
(
Evidence-Based Policy Making
)は、日本語では、客観的証拠に基づく政策立案・
政策形成などと訳されることが多い。行政の展開が税金で賄われる以上、政策の決定を何らか
の根拠に基づいて行うことや、政策決定の根拠を明らかにすることは、納税者に対する説明責
任を果たす上で必須のことであろう。また、その根拠に客観性が求められることも当然と言え
る。国の行政機関や地方公共団体が作成する公的統計は、その時点での社会状況をできる限り
正確かつ客観的に描き出したものである。つまり客観性を持った公的統計は、政策の立案や行
政の展開に当たって十分に有効活用されるべきであり、
EBPM
の推進と公的統計の整備・活用
とは不可分の関係にある。
このような
EBPM
の理念自体は分かりやすい一方で、現実に
EBPM
を推進しようとしたと
き、特にエビデンス、つまり「客観的証拠」が何を指すものなのかという点に関しては、何通
りかの解釈が見られるようである。以下では三つの解釈を順に取り上げていく。
1.2
正確な事実に基づく政策立案
第一の解釈は、現実の状況を誰にとっても共通の方法で客観的に記述したデータを「客観的
証拠」とするものである。つまり、過去の経験や勘など個人に依存する方法で主観的に現実を
とらえ、それら一部の人々にしか分からない形で政策を決定するのではなく、特に数値や統計
データといった万人に共通の方法で客観的に、かつオープンに現状を描き出し、それらに基づ
き多くの人々が納得できる形で政策を決定していくのが
EBPM
というわけである。
例えば
2016
年度の「学生生活調査」
(
独立行政法人 日本学生支援機構
, 2018)
によれば、大
学生の年間の学生生活費平均は
188
万円であり、奨学金を受給している大学生は
48.9
%という
結果が得られている。このような数値データによって実態を正確に捉えた上で、大学生への学
費援助に関する政策を立案していくのが、数値データという客観的証拠に基づく政策形成の一
例ということになる。また森川
(2017)
は、
EBP
(
Evidence-Based Policy making
)の実施状
況や
EBP
に対する意識調査の結果を、
「エビデンスに基づく政策形成」に関するエビデンスと
して提示している。
当然のことながら、政策の立案・決定の前提として現状を正確に把握しておくことは不可欠
である。このような、
「客観的証拠」を数量による現状把握と解釈したときの
EBPM
とは、い
わば「正確な事実に基づく政策立案」とでも言い換えることができよう。
EBPM
を進めるため
のエビデンスが得られていないと主張するとき、その主張は、関連する統計データが整備され
ておらず、実態を正確に、あるいは数値的に把握できていないということを意味する。そのた
め
EBPM
を推進するに当たっては、政策形成に役立つ統計データの整備を進める必要があり、
既存の統計調査をどのように拡充・再編したらよいか、あるいは新たにどのような統計調査を
実施すればよいかといった議論につながることになる。
1.3
政策の事後評価
第二の解釈は、「客観的証拠」を単に現状を記述しただけの統計データや数値データとする
のではなく、政策の評価と結び付けて考えるものである。
Abraham et al. (2017)
によれば、
EBPM
でいうエビデンスとは、統計的な目的をもって統計的な活動によって得られた、政策評価
のために役立ち得る情報(
information produced by “statistical activities” with a “statistical
purpose” that is potentially useful when evaluating government programs and policies
)のこ
ととされている。つまりエビデンスとは統計的な情報ではあるが、現状や実態を記述しただけ
の数値データのことではなく、政策評価のために役立つ情報ということである。もちろん、政
策評価は実態に基づいて行われるものであるから、実態を映し出した統計データも政策評価に
利用され得るという意味において、広義のエビデンスと言えるかもしれない。しかし政策は、
当然のことであるが、一定の効果を期待して実施するものである。政策の評価に役立つという
ことは、政策の効果の有無の評価に役立つということを意味する。つまり政策評価に役立つ情
報といったときの情報とは、単なる数値データというよりは、それらも含みつつ、まさに政策
の効果の有無について評価あるいは判定できるレベルにまで昇華・統合された情報、あるいは
一言で言ってしまえば、政策の効果の有無についての評価そのもののことである。施策の効果
の有無を評価できる情報でなければ、その情報は
EBPM
におけるエビデンスとは言えないと
いうのが、「客観的証拠」に対する第二の解釈である。
ところで政策評価というと、我が国では平成
14
年
4
月
1
日に施行された「行政機関が行う政
策の評価に関する法律」を念頭に置いた、政策のいわば
“
事後
”
評価が一般に思い起こされるで
あろう。既に実施した政策に対して、その費用対効果を評価したり、目標に対する実現度を評
価したりするのである。その場合、政策評価のために数値データを用いるということは、既に
実施した政策の効果等を数値データを用いて評価することとなる。例えば外国人観光客を誘致
する政策の実施後に、統計データによって訪日外国人の観光客数の増加が示されれば、当該政
策は効果があったとして高い評価を得ることとなる。
つまり
EBPM
における「客観的証拠」の第二の解釈では、既存の施策の効果の有無について、
客観的にかつ事後的に評価した結果がエビデンスということになる。
EBPM
を推進するという
ことは、既に実施した政策あるいは実施中の政策の有用性に関して、客観的な評価をさらに充
実させるということを意味する。ただし、全ての政策が事後の評価を想定して実施されている
わけではなく、また数値的な評価自体が困難な政策もある。この第二の解釈を強調し過ぎると、
より良い施策のために根拠を用いるという本来の理念が失われ、逆に既に実施した、あるいは
現在実施中の政策の正当化のための根拠探しに時間を奪われるという、いわゆる
“Policy-Based
Evidence Making” (House of Commons Science and Technology Committee, 2006, pp.47)
を
助長するおそれがある点に注意する必要がある。
1.4
政策の “事前” 評価
「客観的証拠」の第三の解釈は、既に実施した政策を事後評価した結果というよりは、これ
から実施していく政策をいわば
“
事前
”
評価した結果をエビデンスとするというものである。な
ぜなら
EBPM
とは、
Policy Making
と称しているように、エビデンスに基づき政策を立案・決
定していく活動のことであり、政策を評価すること自体が主目的の活動ではないからである。
ここで政策評価の基準となるのは、その政策を実施することによって、期待される効果が今後
現実に得られるのかどうかということである。場合によっては、求める効果は同一であっても、
その効果が期待できる政策は複数考えられるかもしれない。そのような場合、各政策を実施す
ることで、期待される効果が実際に得られるのか、その確実性はどの程度なのかを政策ごとに
事前に評価した結果がエビデンスであり、そのエビデンスに基づいて実際に実施する政策を選
定あるいは決定していくのである。
このとき、政策による効果の有無が、ロジックモデルなど単なる理論によって示されている
よりは、過去の施策による実績として示されている方が、エビデンスとしては強力である。こ
れまでにも効果があったという客観的な資料があれば、次回も同様の効果が期待できるからで
ある。
Cartwright and Hardie (2012)
は、このことを
“It Worked There”
から
“It Will Work
Here”
への転換と表現している。さらに過去の実施環境に依存せず、政策と効果の間に因果関
係があることを示せればさらによい。政策に対するそのような評価は過去の施策結果に基づい
て行われる。つまり過去の施策について評価するとしても、それは今後別の場面においても同
様の効果が期待できるかという観点からの評価である。将来期待される効果の有無という点に
関して各政策を評価した結果を「客観的根拠」として、政策を決定していこうとするのが
EBPM
ということになる。
本稿ではこれ以降、
EBPM
におけるエビデンス、つまり「客観的証拠」に対して、現状を数値
データで記述したものという第一の解釈や過去の政策評価という第二の解釈ではなく、今後の
施策の効果を客観的に評価できる資料という第三の解釈を採ることとする。その上で、
EBPM
の推進に当たっては何が必要かという点を考えていくこととする。
2
エビデンスレベルの評価指標
2.1
EBPM におけるエビデンスレベルの評価指標の必要性
ある政策について過去や他所で効果で見られたという実績があったとしても、その政策を実
施すれば今後も同様の効果が期待できると直ちに結論付けるわけにはいかない。施策によって
効果が生じたという因果関係を示すことは容易ではないし
(
例えば、中室・津川
(2017)
や伊藤
(2017)
などを参照
)
、また将来の様々な条件が、過去とは異なる場合もあるからである。
例えば子供の学力向上を目的とした少人数学級という政策の場合を考えてみよう。ある一つ
の学校で少人数学級を取り入れたところ、子供の学力が上がったという結果が得られたとして
も、学力の向上が少人数学級という施策を原因として生じたとは限らない。仮に少人数学級を
取り入れなくとも、学力は向上したかもしれないからである。また学力の向上は、その学校に
特有の条件によって引き起こされたのかもしれない。そのため別の学校で少人数学級を取り入
れれば学力が向上するというエビデンスとしては不十分である。
では少人数学級を取り入れた複数の学校では学力が向上しており、少人数学級としなかった
複数の学校では学力の向上が見られなかった場合はどうだろうか。先の結果よりは、別の新た
な学校で少人数学級を採用したときに学力が向上する可能性は高まる。しかしそれでも学力の
向上を確実に保証するエビデンスとはならない。学力が向上した学校では教員や地域社会等に
関して良い条件が揃っており、向上しなかった学校では条件が悪かったからかもしれないから
である。
それでは複数の学校を、少人数学級を採用する学校と採用しない学校とに無作為に振り分け
た場合はどうだろうか。この方法は無作為化比較対照実験(
Randomized Control Test; RCT
)
と呼ばれる方法である。少人数学級の採否以外については
2
群の間で条件がほぼ同一となるこ
とが期待できるため、少人数学級を採用した学校の方がより学力が向上していれば、学力の向
上は少人数学級が原因である可能性はかなり高まる。しかしだからと言って、別の新たな学校
で少人数学級を取り入れれば、確実に学力が向上するとまでは言い切れない。
RCT
を行った学
からである。
つまりエビデンスと言っても、そのエビデンスが将来の政策効果をどの程度確実に保証する
のか、確実性の程度は様々である。そのため政策の裏付けとなるエビデンスを示すときには、
エビデンスそのものと同時に、エビデンスが示す確実性について、そのレベルを評価した結果
も合わせて示していく必要がある。あるいは、評価結果も含めてエビデンスといってもよいか
もしれない。またエビデンスのレベルについての評価は、エビデンス間で互いに比較可能なも
のでなければならない。いずれのエビデンスのレベルが高いのか、あるいは低いのかを比較で
きなければならないということである。つまりエビデンスのレベルを順序性をもって統一的に
評価する基準あるいは指標が必要となってくるのである。
EBPM
が、その考え方を取り入れた
Evidence-Based Medicine
においても、エビデンスレベルの評価指標の必要性が言われている
(Grondin & Schieman, 2011)
。
なお、ここで言うエビデンスのレベルとは、政策の効果の程度を表すものではなく、確実性
の程度を表すものである。エビデンスのレベルが低いということは、政策の効果がないという
ことを表すものではなく、効果の有無を確実性をもって示すことができないということを表す
ものである。したがってエビデンスのレベルが低い政策の中にも、現実には有用な政策が十分
あり得るということになる。
2.2
様々なエビデンスレベルの評価指標
本稿で言う第三の解釈に基づく
EBPM
の推進に当たっては、エビデンスレベルの評価指標を
組織として定めることが必須である。とは言え、評価指標の設定に当たっては唯一絶対的な基
準があるわけではない。評価指標は、評価を行う者やエビデンスを利用する者の価値観や考え
方、行政の諸分野における特殊性が反映されるものだからである。そのため様々な組織が独自に
評価指標を設定しており、
Puttick (2018)
は
18
の評価指標を紹介している。本稿の
Appendix
には
12
の評価指標を紹介した。
評価指標におけるレベルの数は、
Appendix
に紹介した中では
What Works Clearinghouse
の
3
が最も少なく、
Oxford Centre of Evidence-based Medicine 2009
の
10
が最も多い。レベルの
数が多様であるのは、本来エビデンスのレベルは連続的なものであり、また必ずしも議論の余地
なく一意的に決められるものではないため、大きな括りで捉えるべきであるという考え方と、だ
からこそ逆に細かく丁寧に評価すべきであるという考え方のいずれもがあり得るためであろう。
評価指標の多くは各エビデンスに対して単一のレベルを定めるものであるが、
EMMIE (Johnson,
Tilley & Bowers, 2015)
のように観点ごとにレベルを定める指標もある。
Appendix
には紹介し
ていないが、他にも
Puddy & Wilkins (2011)
や
OCEBM Levels of Evidence Working Group
(2011)
なども同様に観点別にレベルを定めている。
評価指標の多くは、大まかに言えばまず、システマティックレビューが行われていたり複数
であれば、高いレベルの評価を与えている。次に高いレベルとして評価しているのは、単一の
RCT
など実験研究による結果であり、前後比較などの観察研究はそれに次ぐレベルとして評
価している。最後に最も低いレベルとして評価しているのは、データによる検証が行われてお
らず、ロジックモデルなどの提示のみといった場合である。
CEBC Scientific Rating Scale
や
Early Intervention Foundation
など、そもそも評価の対象外であるとか有効性が認められない
といったエビデンスに対してもレベルを与える評価指標もある。
ただしエビデンスレベルは研究の方法論のみを基準に評価されるわけではなく、その質的な
内容も考慮して評価される。例えば
What Works Centre for Local Economic Growth (2016a)
では、
Maryland Scientific Methods Scale
において、
RCT
が行われている場合であっても必ず
しも一律に高いレベルの評価を与えてはいない。適切な無作為化が行われていること、脱落や無
回答に対する適切な処置が行われていること、処置群に対する処置が対照群に影響しないデザイ
ンとなっていること、といった三つの基準が満たされていなければ、満たされない程度に応じて
評価を引き下げている。つまりエビデンスレベルは指標さえあれば直ちに評価できるものでは
なく、指標の趣旨に沿った形で評価を行うには評価の詳細な方法も合わせて指標を示していく必
要がある。評価の具体的な方法を示した例としては、
What Works Centre for Local Economic
Growth (2016a)
の他にも
Snape et al. (2017)
や
What Works Clearinghouse (2017a; 2017b)
がある。
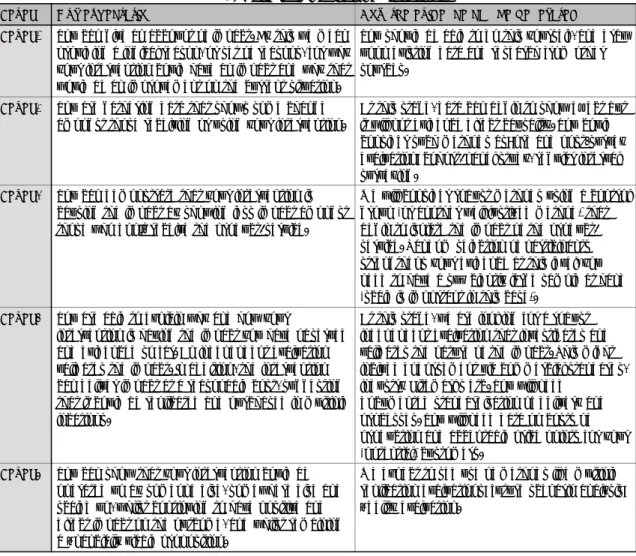
2.3
エビデンスレベル評価の現状
エビデンスのレベルは高い方が望ましいことは言うまでもない。しかし現実には、高いレベ
ルの評価を受けたエビデンスは決して多くはない。むしろ低いレベルの評価を受けたエビデン
スがほとんどである。
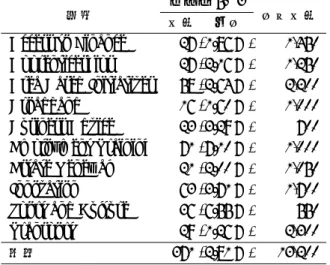
例えば
Project ORACLE (2018)
では、
386
件のエビデンスのうち、
5
段階のレベルにおいて
5
や
4
といった高い評価を受けたエビデンスは一つもない(表
1
)。それに対し、
1
という最も
低い評価のエビデンスは
285
件であり、全体の
73.8
%を占める。また次に低い
2
という評価の
エビデンスは
95
件であり、
1
と
2
の評価を合わせて
380
件、全体の
98.4
%を占める。
表
1: Project ORACLE
における各レベルのエビデンス数
レベル
5
4
3
2
1
合計
0 件
0 件
6 件
95 件
285 件
386 件
0.0 %
0.0 %
1.6 %
24.6 %
73.8 %
100.0 %
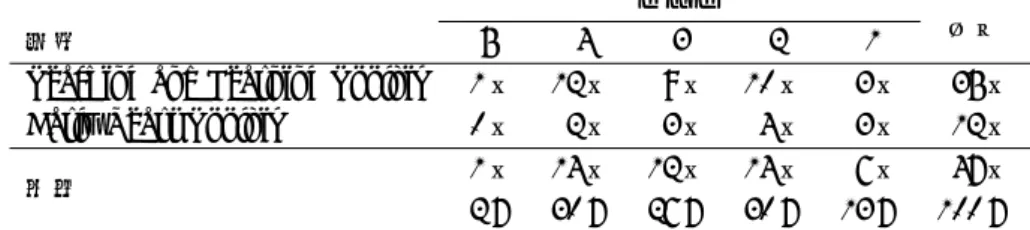
また
What Works Centre for Local Economic Growth (2015a, 2015b, 2015c, 2015d, 2015e,
2016b, 2016c, 2016d, 2016e, 2016f)
では、
5
段階で
5
から
3
までの高い評価を受けたエビデン
スの割合は、分野によって
1.26
%から
7.10
%と幅があるものの、いずれも
1
割に満たない(表
表
2: What Works Centre for Local Economic Growth
における高レベルエビデンス数
レベル 5∼3
分野
件数
割合
合計件数
Access to Finance
27 (1.86 %)
1,450
Apprenticeships
27 (2.16 %)
1,250
Area Based Initiatives
58 (2.64 %)
2,200
Broadband
16 (1.60 %)
1,000
Business Advice
23 (3.29 %)
700
Employment Training
71 (7.10 %)
1,000
Estate Renewal
21 (2.00 %)
1,050
Innovation
63 (3.71 %)
1,700
Sport and Culture
36 (6.55 %)
550
Transport
29 (1.26 %)
2,300
全体
371 (2.81 %)
13,200
2
)
。全体では
13,200
件のエビデンスのうち、
5
から
3
までの高い評価を受けたエビデンスの数
は
371
件にとどまり、その割合は
2.81
%となっている。逆に言えば、
1
や
2
といった低い評価
の割合は
97.19
%ということになる。
Early Intervention Foundation (2019)
では、
4
段階で最も高いレベル
4
の評価を受けたエビ
デンスは
101
件のうち
6
件(
5.9
%)だけである。半数近くの
50
件がレベル
2
の評価となって
いる(表
3
)。なお
Early Intervention Foundation
では、レベル
2
を下回るレベルは、ロジッ
クモデルのみを示してデータが得られていない
Not level 2
と、効果がなかったことを示す
NE
となっている。
表
3: Early Intervention Foundation
における各レベルのエビデンス数
レベル
4
3
2
合計
6 件
45 件
50 件
101 件
5.9 %
44.6 %
49.5 %
100.0 %
最後に
Education Endowment Foundation (2018a, 2018b)
では、
5
段階で最も高いレベル
5
のエビデンスは全体で
1
件(
2
%)だけであるが、次に高いレベル
4
のエビデンスは
2
分野を合
わせて
14
件(
30
%)となっている。また最も低いレベル
1
のエビデンスは全体で
6
件(
13
%)
であり、表
1
から表
3
に示した結果と比較すると、高評価を受けたエビデンスの割合が高い。
以上のとおり、一般に高いレベルの評価を受けたエビデンスは非常に少ないのが現状である。
高いレベルの評価を受けるためには、例えば
RCT
が実施されているといった要件を満たす必
要があるが、現実には
RCT
を組み込んだ施策は困難であったり、エビデンスとして評価する
ことを事前に念頭に置いた施策が行われていないことがその主な原因であろう。
表
4: Education Endowment Foundation
における各レベルのエビデンス数
レベル
分野
5
4
3
2
1
合計
Teaching and Learning Toolkit
1 件
12 件
9 件
10 件
3 件
35 件
Early Years Toolkit
0 件
2 件
3 件
4 件
3 件
12 件
1 件
14 件
12 件
14 件
6 件
47 件
全体
2 %
30 %
26 %
30 %
13 %
100 %
3
エビデンスレベル評価の今後
現在までのところ、我が国において独自にエビデンスレベルの評価指標を定めている組織は、
管見の限りではないようである。
EBPM
におけるエビデンス、「客観的証拠」の意味に関して
様々な解釈が混在していることが、その一つの要因であろう。客観的証拠とは現状を正確に記
述した資料であるという第一の解釈に基づくのであれば、統計や統計調査の充実が今後の主要
課題であり、本稿で紹介したようなエビデンスレベルの評価指標の策定は無用である。しかし、
今後実施する政策の有効性をいわば事前評価した資料のことであるという第三の解釈に基づく
EBPM
を推進していこうというのであれば、その前段階として、エビデンスレベルの評価指標
とその評価手順を組織として定めることは必須の作業である。評価指標に基づくレベルが示さ
れなければ、政策の立案者・決定者は各資料を統一的な基準で比較することができず、それら
に基づく政策立案・形成ができないからである。
また
EBPM
を推進しようとする組織が評価指標と評価手順を示すことは、エビデンスの利
用者である政策立案者にとって必要なだけでなく、エビデンスの作成者にとっても有益な作業
である。何がどのような観点からどのように評価されるのかという評価の基準が事前に示され
ることで、その基準を満たすにはあらかじめ何を用意しなければならないかが明確になるから
である。高いレベルの評価を受けるための
RCT
などは現実には困難であったとしても、ある
程度のレベルを確保するための次善の方法は、評価基準が具体的に示されていることで工夫を
凝らすことができるであろう。
したがって、我が国において今後
EBPM
を推進しようとするのであれば、
「客観的根拠」と
は何を意味するのかについて認識の共有化を図るとともに、場合によってはどのようなエビデ
ンスレベルの評価指標を用いるのか組織として公表することが必要であろう。ただし、エビデ
ンスは効率的な行政展開のために用いるものである。エビデンスの作成が目的化してしまった
り、現状に合わない評価指標を導入することで逆に行政が非効率となってしまったりしては本
末転倒である。エビデンスレベルの評価指標やその評価手順の作成・公表に当たっては、単に
海外の指標をそのまま導入するのではなく、我が国の行政の実状に適した方法を模索していく
ことが重要である。
Reference
• Abraham, K.G., Haskins, R., Glied, S., Groves, R.M., Hahn, R., Hoynes, H., Liebman, J.B.,
Meyer, B.D., Ohm, P., Potok, N., Mosier, K.R., Shea, R.J., Sweeney, L., Troske, K.R. and
Wallin, K.R. (2017) The Promise of Evidence-Based Plicymaking — Report of the Commision on
Evidence-Based Policymaking. Washington, DC: Commission on Evidence-Based Policymaking.
• Cartwright N., and Hardie, J. (2012) Evidence-Based Policy — A Practical Guide to Doing It
Better. New York: Oxford University Press.
• 独立行政法人 日本学生支援機構 (2018)『平成 28 年度 学生生活調査結果』https://www.jasso.go.
jp/about/statistics/gakusei_chosa/__icsFiles/afieldfile/2018/06/01/data16_all.pdf
(2019 年 6 月 5 日)
• Early Intervention Foundation (2019) https://guidebook.eif.org.uk/search (2019 年 6 月 5
日)
• Education Endowment Foundation (2018a) Sutton Trust-Education Endowment Foundation
Teaching and Learning Toolkit. London: Education Endowment Foundation,
https://educationendowmentfoundation.org.uk/evidence-summaries/teaching-learning
-toolkit (2019 年 6 月 5 日)
• Education Endowment Foundation (2018b) Education Endowment Foundation Early Years
Toolkit. London: Education Endowment Foundation, https://educationendowmentfoundation.
org.uk/evidence-summaries/early-years-toolkit/ (2019 年 6 月 5 日)
• Grondin, S.C. and Schieman, C. (2011) Evidence-based medicine: Levels of evidence and
eval-uation systems. In M.K.Ferguson (ed.) Difficult Decisions in Thoracic Surgery., pp.13–22.
London: Springer-Verlag.
• Guyatt, G.H., Oxman, A.D., Vist, G.E., Kunz, R., Falck-Ytter, Y., Alonso-Coello, P. and
Sch¨
unemann, H.J. (2008) GRADE: An emerging consensus on rating quality of evidence and
strength of recommendations. BMJ, 336, 924–926.
• House of Commons Science and Technology Committee (2006) Scientific Advice, Risk and
Ev-idence Based Policy Making. London: The Stationery Office Limited.
• 伊藤公一朗 (2017) 『データ分析の力 因果関係に迫る思考法』 光文社.
• Johnson, S.D., Tilley, N. and Bowers, K.J. (2015) Introducing EMMIE: an evidence rating
scale to encourage mixed-method crime prevention synthesis reviews. Journal of Experimental
Criminology, 11, 459–473.
• 森川正之 (2017) 「エビデンスに基づく政策形成」に関するエビデンス. RIETI Policy Discussion
Paper Series 17-P-008.
• 中室牧子・津川友介 (2017) 『「原因と結果」の経済学—データから真実を見抜く思考法』 ダイヤ
モンド社.
• OCEBM Levels of Evidence Working Group (2011) The Oxford 2011 Levels of Evidence.
Ox-ford: Oxford Centre for Evidence-Based Medicine.
http://www.cebm.net/index.aspx?o=
5653 (2019 年 6 月 5 日)
• Project ORACLE (2018) https://www.project-oracle.com/what-weve-done/ (2018 年 10
月 14 日)
• Puddy, R.W. and Wilkins, N. (2011) Understanding Evidence Part 1: Best Available Research
Evidence. A Guide to the Continuum of Evidence of Effectiveness. Atlanta, GA: Centers for
• Puttick, R. (2018) Mapping the Standards of Evidence Used in UK Social Policy. London:
Nesta.
• Snape, D., Meads, C., Bagnall, A.-M., Tregaskis, O., Mansfield, L. and MacLennan, S. (2017)
A Guide to Our Evidence Review Methods. https://whatworkswellbeing.files.wordpress.
com/2017/04/wwcw-methods-guide-mar-2017.pdf (2019 年 6 月 5 日)
• 統計改革推進会議 (2017) 『統計改革推進会議 最終とりまとめ』 https://www.kantei.go.jp/
jp/singi/toukeikaikaku/pdf/saishu_honbun.pdf (2019 年 6 月 5 日)
• What Works Centre for Local Economic Growth (2015a) Evidence Review: Apprenticeships.
London: Economic & Social Research Council.
• What Works Centre for Local Economic Growth (2015b) Evidence Review 5: Estate Renewal.
London: Economic & Social Research Council.
• What Works Centre for Local Economic Growth (2015c) Evidence Review 6: Broadband.
Lon-don: Economic & Social Research Council.
• What Works Centre for Local Economic Growth (2015d) Evidence Review 7: Transport.
Lon-don: Economic & Social Research Council.
• What Works Centre for Local Economic Growth (2015e) Evidence Review 9: Innovation.
Lon-don: Economic & Social Research Council.
• What Works Centre for Local Economic Growth (2016a) Guide to Scoring Evidence Using the
Maryland Scientific Methods Scale. London: Economic & Social Research Council.
• What Works Centre for Local Economic Growth (2016b) Evidence Review 1: Employment
Training. London: Economic & Social Research Council.
• What Works Centre for Local Economic Growth (2016c) Evidence Review 2: Business Advice.
London: Economic & Social Research Council.
• What Works Centre for Local Economic Growth (2016d) Evidence Review 3: Sports and Culture.
London: Economic & Social Research Council.
• What Works Centre for Local Economic Growth (2016e) Evidence Review 4: Access to Finance.
London: Economic & Social Research Council.
• What Works Centre for Local Economic Growth (2016f) Evidence Review 10: Area Based
Initiatives. London: Economic & Social Research Council.
• What Works Clearinghouse (2017a) Procedure Handbook Version 4.0. https://ies.ed.gov/
ncee/wwc/Docs/referenceresources/wwc_procedures_handbook_v4.pdf (2019 年 6 月 5 日)
• What Works Clearinghouse (2017b) Standards Handbook Version 4.0. https://ies.ed.gov/
Appendix
この章では、
12
のエビデンスレベルの評価指標を紹介する。
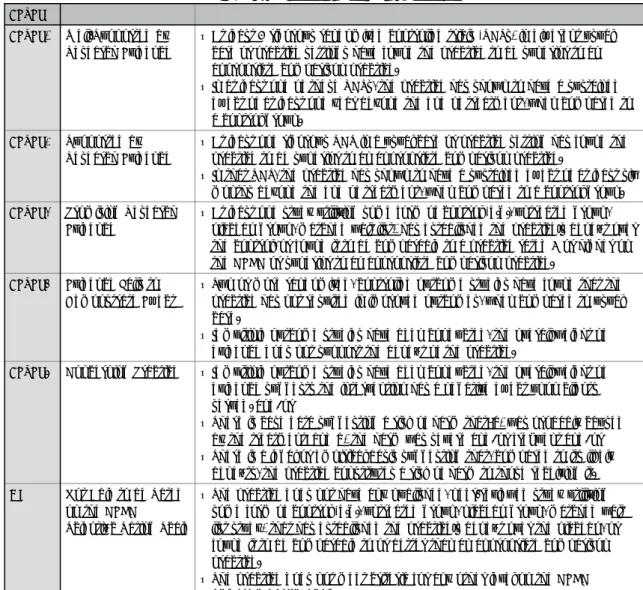
3.1
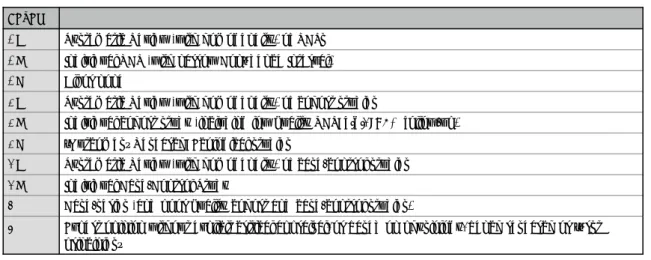
CEBC Scientific Rating Scale
表
5: CEBC Scientific Rating Scale
LevelLevel 1 Well-Supported by Research Evidence
• At least 2 rigorous randomized controlled trials (RCTs) in different usual care or practice settings have found the practice to be superior to an appropriate comparison practice.
• In at least one of these RCTs, the practice has shown to have a sustained effect of at least one year beyond the end of treatment, when compared to a control group.
Level 2 Supported by Research Evidence
• At least one rigorous RCT in a usual care or practice setting has found the practice to be superior to an appropriate comparison practice.
• In that RCT, the practice has shown to have a sustained effect of at least six months beyond the end of treatment, when compared to a control group. Level 3 Promising Research
Evidence
• At least one study utilizing some form of control (e.g., untreated group, placebo group, matched wait list) has established the practice s benefit over the control, or found it to be comparable to a practice rated 3 or higher on the CEBC or superior to an appropriate comparison practice.
Level 4 Evidence Fails to Demonstrate Effect
• Two or more randomized, controlled outcome studies have found that the practice has not resulted in improved outcomes, when compared to usual care.
• If multiple outcome studies have been conducted, the overall weight of evidence does not support the benefit of the practice.
Level 5 Concerning Practice • If multiple outcome studies have been conducted, the overall weight of evidence suggests the intervention has a negative effect upon clients served. and/or
• There is case data suggesting a risk of harm that: a) was probably caused by the treatment; and b) the harm was severe and/or frequent and/or • There is a legal or empirical basis suggesting that, compared to its likely
benefits, the practice constitutes a risk of harm to those receiving it. NR Not Able to be Rated
on the CEBC Scientific Rating Scale
• The practice does not have any published, peer-reviewed study utilizing some form of control (e.g., untreated group, placebo group, matched wait list study) that has established the practice s benefit over the placebo, or found it to be comparable to or better than an appropriate comparison practice.
• The practice does not meet criteria for any other level on the CEBC Scientific Rating Scale.
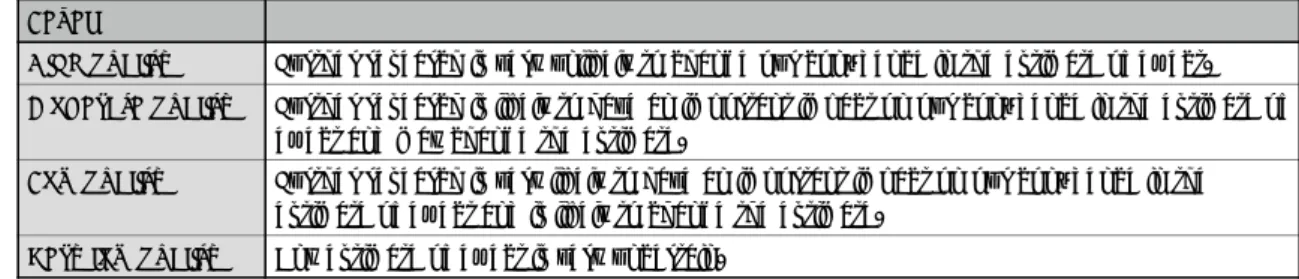
3.2
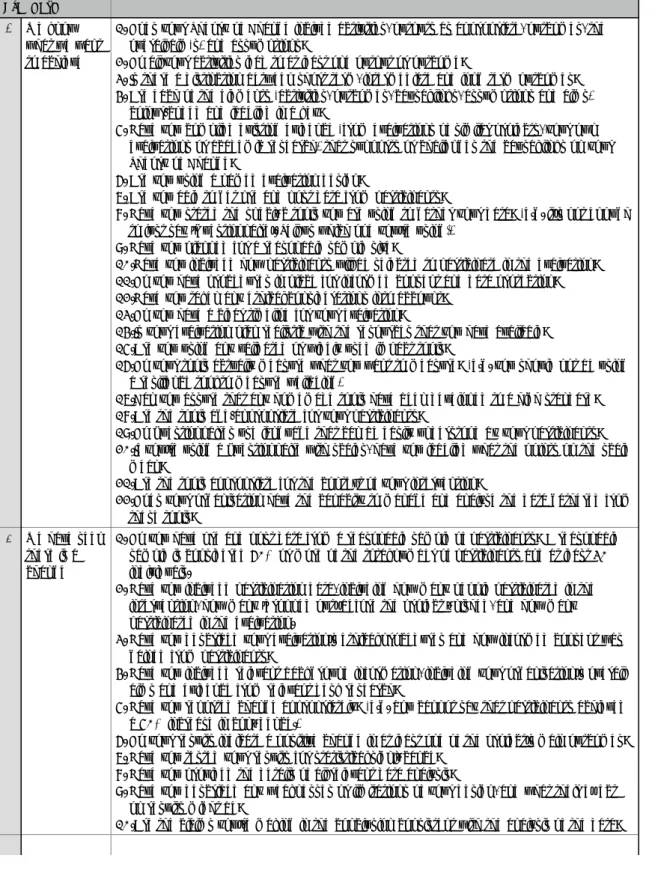
Centre for Analysis of Youth Transitions
表
6: Centre for Analysis of Youth Transitions
Score0 Basic Studies that describe the intervention and collect data
on activity associated with it.
1 Descriptive, anecdotal, expert opinion Studies that ask respondents or experts about whether the intervention works.
2 Study where a statistical relationship (correlation) between the outcome and receiving services is established
The correlation is observed at a single point in time, outcomes of those who receive the intervention are compared with those who do not get it.
3 Study which accounts for when the services were delivered by surveying before and after
This approach compares outcomes before and after an intervention.
4 Study where there is both a before and after evaluation strategy and a clear comparison between groups who do and do not receive the youth services
These studies use comparison groups, also known as control groups.
5 As above but in addition includes statistical modelling to produce better comparison groups and of outcomes to allow for other differences across groups
Study with a before and after evaluation strategy, statistically generated control groups and statistical modelling of outcomes.
6 Study where intervention is provided on the basis of individuals being randomly assigned to either the treatment or the control group.
Study that compares results from two independent randomly generated groups (one receiving the intervention and the other not) and uses statistical analysis to determine the programme s effectiveness. 7 Various studies that evaluate an intervention
which has been provided through random allocation at the individual level.
The intervention has been evaluated more than once and its effectiveness is assessed through more than one RCT showing high level of statistical analysis and reporting high quality of evidence
3.3
Early Intervention Foundation
表
7: Early Intervention Foundation
LevelLevel 4 Effectiveness Evidence from at least two high-quality evaluations demonstrating positive impacts across populations and environments lasting a year or longer. This evidence may include significant adaptations to meet the needs of different target populations.
Level 3 Efficacy Evidence from at least one rigorously conducted evaluation demonstrating a statistically significant positive impact on at least one child outcome. Level 2 Preliminary
Evidence
Evidence of improving a child outcome from a study involving at least 20 participants, representing 60% of the sample using validated instruments. Not level 2 Logic Model Key elements of the logic model are being confirmed and verified in relation to
practice and the underpinning scientific evidence. Testing of impact is underway but evidence of impact at Level 2 not yet achieved.
NE No Effect A finding of no effect on measured child outcomes in a high quality impact evaluation. The next step is to return to the verification and confirmation of the logic model.
【出典】
https://guidebook.eif.org.uk/eif-evidence-standards
3.4
Education Endowment Foundation
表
8: Education Endowment Foundation
Padlock1 Very limited evidence
No evidence reviews available, only individual research studies.
2 Limited evidence At least one evidence review. Reviews include studies with relevant outcomes, and studies with methods which enable researchers to draw weak conclusions about impact.
3 Moderate evidence
At least two evidence reviews. Reviews include studies with relevant outcomes, and studies with methods and analysis which enable researchers to draw moderate conclusions about impact.
4 Extensive evidence
At least 3 evidence reviews. Reviews include studies with highly relevant outcomes, and studies with methods and analysis which enable researchers to draw strong conclusions about impact. Impact estimates are broadly consistent across studies.
5 Very Extensive evidence
At least 5 evidence reviews. Reviews are recent, and include studies with highly relevant outcomes, and studies with methods and analysis which enable researchers to draw strong conclusions about impact. Impact estimates are consistent across studies.
3.5
EMMIE
表
9: EMMIE
Component EMMIE-Q scoring
Effects overall effect direction and size
0 Insufficient consideration of validity elements listed below 1 Sufficient consideration of one * element of validity 2 Sufficient consideration of two * elements of validity
3 Sufficient consideration of three of four * elements of validity
4 Sufficient consideration of five of six elements of validity (including all of those marked with an * )
Mechanism how the policy, practice or program produces its effects
0 No references to theory; simple black box
1 Broad statement of assumed program theory stated (mechanisms and/or processes) 2 Detailed articulation of theory, based on interrogation of relevant literature and/or
elicited from practice.
3 Formalization of theory and derivation of precise predictions from it
4 Test, corroboration, falsification and refinement of theories, using data assembled for the purpose.
Moderators conditions for the activation of the mediator or mechanism
0 No reference to condition contexts or moderators that may be significant for activation of mediators or mechanisms
1 Ad hoc description of possible relevant moderators or contexts
2 Tests of the effects of moderators or mechanisms defined post hoc using variables that are at hand
3 Theory-based pre-specification of expected moderators and mediators relevant to the activation of mediators or mechanisms
4 Collection and analysis of relevant data relating to the pre-specified expected moderators and contexts.
Implementation how the policy, practice, treatment or intervention is applied
0 No account of implementation or implementation challenges 1 Ad hoc comments on implementation
2 Systematic efforts to document implementation issues
3 Detailed evidence-based account of expected levels of fidelity to program, policy or treatment plans
4 Complete evidence-based account of expected levels of fidelity to program, expected obstacles and specification of elements necessary for replication elsewhere.
Economic the cost-effectiveness of the policy, practice, program,
treatment or intervention
0 No mention of costs (and/or benefits)
1 Only direct or explicit costs (and/or benefits) estimated
2 Direct or explicit and indirect and implicit costs (and/or benefits) estimated 3 Marginal or total or opportunity costs (and/or benefits) estimated
4 Marginal or total or opportunity costs (and/or benefits) by bearer (or recipient) estimated
validity elements
A transparent and well-designed search strategey*
High statistical conclusion validity (at least four of the following are necessary for a study to be considered sufficient)*
Sufficient assessment of the risk of bias (at least two necessary for sufficient consideration)*
Attention to the validity of the constructs, with only comparable outcomes combined and/or exploration of the implications of combining outcome constructs*
Assessment of the influence of study design (e.g., separate overall effect sizes for experimental and quasi-experimental design)
Assessment of the influence of unanticipated outcomes or spin-offs on the size of the effect (e.g., quantification of displacement or diffusion of benefit)
3.6
GRADE
表
10: Grading of Recommendations Assessment, Development and Evaluation
LevelHigh quality Further research is very unlikely to change our confidence in the estimate of effect. Moderate quality Further research is likely to have an important impact on our confidence in the estimate of
effect and may change the estimate.
Low quality Further research is very likely to have an important impact on our confidence in the estimate of effect and is likely to change the estimate.
Very low quality Any estimate of effect is very uncertain.
【出典】
Guyatt, Oxman, Vist, Kunz, Falck-Ytter, Alonso-Coello & Sch¨
unemann (2008)
3.7
The Maryland Scientific Methods Scale
表
11: The Maryland Scientific Methods Scale
LevelLevel 1 Either (a) a cross-sectional comparison of treated groups with untreated groups, or (b) a before-and-after comparison of treated group, without an untreated comparison group. No use of control variables in statistical analysis to adjust for differences between treated and untreated groups or periods.
Level 2 Use of adequate control variables and either (a) a cross-sectional comparison of treated groups with untreated groups, or (b) a before-and-after comparison of treated group, without an untreated comparison group. In (a),control variables or matching techniques used to account for cross-sectional differences between treated and controls groups. In (b), control variables are used to account for before-and-after changes in macro level factors.
Level 3 Comparison of outcomes in treated group after an intervention, with outcomes in the treated group before the intervention, and a comparison group used to provide a counterfactual (e.g. difference in difference). Justification given to choice of comparator group that is argued to be similar to the treatment group. Evidence presented on comparability of treatment and control groups. Techniques such as regression and (propensity score matching may be used to adjust for difference between treated and untreated groups, but there are likely to be important unobserved differences remaining. Level 4 Quasi-randomness in treatment is exploited, so that it can be credibly held that treatment and control
groups differ only in their exposure to the random allocation of treatment. This often entails the use of an instrument or discontinuity in treatment, the suitability of which should be adequately
demonstrated and defended.
Level 5 Reserved for research designs that involve explicit randomisation into treatment and control groups, with Randomised Control Trials (RCTs) providing the definitive example. Extensive evidence provided on comparability of treatment and control groups, showing no significant differences in terms of levels or trends. Control variables may be used to adjust for treatment and control group differences, but this adjustment should not have a large impact on the main results. Attention paid to problems of selective attrition from randomly assigned groups, which is shown to be of negligible importance. There should be limited or, ideally, no occurrence of contamination of the control group with the treatment.
3.8
Nesta Standards of Evidence
表
12: Nesta Standards of Evidence
Level Our expectation How the evidence can be generated
Level 1 You can give an account of impact. By this we mean providing a logical reason, or set of reasons, for why your intervention could have an impact and why that would be an improvement on the current situation.
You should be able to do this yourself, and draw upon existing data and research from other sources.
Level 2 You are gathering data that shows some change amongst those receiving or using your intervention.
At this stage, data can begin to show effect but it will not evidence direct causality. You could consider such methods as: pre and post-survey evaluation; cohort/panel study, regular interval surveying.
Level 3 You can demonstrate that your intervention is causing the impact by showing less impact amongst those who don t receive the product/service.
We will consider robust methods using a control group (or another well justified method) that begin to isolate the impact of the product/ service. Random selection of participants strengthens your evidence at this level, you need to have a sufficiently large sample at hand (scale is important in this case).
Level 4 You are able to explain why and how your
intervention is having the impact you have observed and evidenced so far. An independent evaluation validates the impact. In addition, the intervention can deliver impact at a reasonable cost, suggesting that it could be replicated and purchased in multiple locations.
At this stage, we are looking for a robust independent evaluation that investigates and validates the nature of the impact. This might include endorsement via commercial standards, industry Kitemarks etc. You will need
documented standardisation of delivery and processes. You will need data on costs of production and acceptable price points for your (potential) customers.
Level 5 You can show that your intervention could be operated up by someone else, somewhere else and scaled up, whilst continuing to have positive and direct impact on the outcome, and whilst remaining a financially viable proposition.
We expect to see use of methods like multiple replication evaluations; future scenario analysis; fidelity evaluation.
3.9
Oxford Centre of Evidence-based Medicine 2009
表
13: Oxford Centre of Evidence-based Medicine 2009
Level1a Systematic Review (with homogeneity) of RCTs 1b Individual RCT (with narrow Confidence Interval)
1c All or none
2a Systematic Review (with homogeneity) of cohort studies
2b Individual cohort study (including low quality RCT; e.g., <80% follow-up) 2c Outcomes Research; Ecological studies
3a Systematic Review (with homogeneity) of case-control studies 3b Individual Case-Control Study
4 Case-series (and poor quality cohort and case-control studies)
5 Expert opinion without explicit critical appraisal, or based on physiology, bench research or first principles
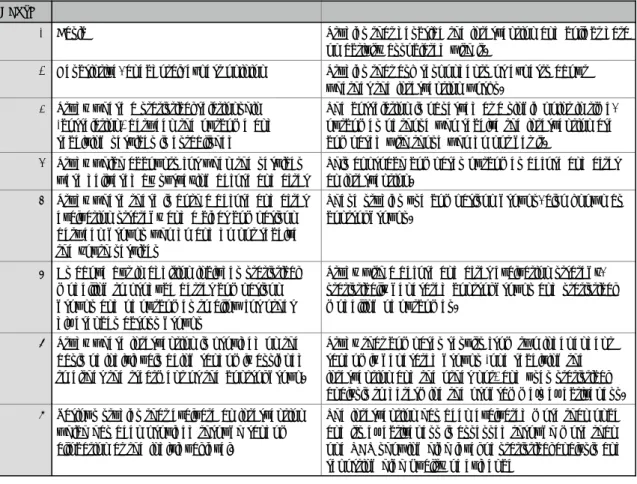
3.10
Project Oracle’s Standards
表
14: Project Oracle’s Standards
Standard1 We know what we want to achieve
1. Does your Theory of Change include activities, outputs as appropriate, outcomes, the overall aim(s) and assumptions?
2. Do all your activities lead to at least one output or outcome?
3. Is there a distinction between short term, intermediate and long term outcomes? 4. Are each of the elements (activities, outcomes, causal links, assumptions and aims)
colour-coded and labelled in a key?
5. Have you compiled existing evidence (from evaluations of similar projects, your own evaluations or academic research) that supports or challenges the causal links on your Theory of Change?
6. Are you using a named evaluation design?
7. Are you able to get pre and post data from participants?
8. Have you stated the specific tools you are using to gather your data? (e.g. it s not enough to just say Questionnaire . Tell us which one you re using!)
9. Have you planned for a reasonable sample size?
10.Have you included how participants will be selected to participate in the evaluation? 11.Do you have procedures in place for informed consent and data protection? 12.Have you taken any ethical considerations into account?
13.Do you have a clear timeline for your evaluation?
14.Is your evaluation plan realistic with the resources that you have available? 15.Are you using any validated or widely used impact tools?
16.Do your tools actually measure what you want to measure? (e.g. you should not be using a resilience tool to measure wellbeing)
17.Can you assure that any homemade tools have been developed to a high standard? 18.Are the tools age-appropriate for your participants?
19.Do questionnaires use language that can be easily understood by your participants? 20.If you re using a questionnaire with scales, have you labelled what the points on the scale
mean?
21.Are the tools appropriate for the context of your intervention?
22.Does your organisation have the capacity to manage and analyse the data gathered from these tools?
2 We have seen there is a change
1. Do you have pre and post data from a reasonable sample of participants? A reasonable sample is considered 60% or more of the total number of participants and at least 30 individuals.
2. Have you included participation data, including how many people participated in the intervention, how many dropped out before the project finished, and how many participated in the evaluation.
3. Have you described your evaluation s ethical procedures and how informed consent was gained from participants?
4. Have you included relevant background information, including your organisation s overall aims and evidence from relevant desk research?
5. Have you reported change appropriately? (e.g. You cannot say that participants achieved a 50% increase in confidence.)
6. Do your results indicate a positive change in at least one of the project s main outcomes? 7. Have you tested your results for statistical significance?
8. Have you provided the details of all relevant data analysis?
9. Have you described any weaknesses or limitations of your design, and what their effect on results might be?
3 We believe the change is caused by us
1. Have you included participation data for the comparison group? 2. Have you described how the comparison group was selected?
3. Have you described how any differences between the groups could influence your results?
4. Were the same tools used to measure results in both the intervention and comparison group?
5. Were measurements from the intervention group and the comparison group taken over the same period of time?
6. Do project manuals, monitoring and quality procedures and staff training materials etc. ensure that the project can be replicated with fidelity?
4 We know how and why it works - it works elsewhere
1. Has your project been replicated at least once with statistically independent groups? 2. Have you carried out at least two evaluations using a comparison group?
3. Do both evaluations show positive effect in at least one of your project s key outcomes? 4. Has one of your evaluations been carried out independently?
5. Have you provided evidence on dosage? This means considering how different levels of engagement with your service lead to different outcomes.
6. If relevant, do you have evidence of impact on sub-groups of participants? 7. Have you completed a cost benefit analysis?
8. Does your monitoring and quality assurance evidence demonstrate that your project has been replicated with fidelity?
5 We know how and why it works - it works everywhere
1. Has your project been replicated in at least five UK locations?
2. Do you have at least three independent evaluations which meet the requirements for Standard 4 validations?
3. Do all the evaluations show positive effect in at least one of your project s key outcomes across all locations?
4. Does your monitoring and quality assurance evidence demonstrate that your project has been replicated with fidelity across all sites?
【出典】
https://project-oracle.com/uploads/files/Validation_Guidebook.pdf
3.11
Scottish Intercollegiate Guidelines Network
表
15: Scottish Intercollegiate Guidelines Network
Level1++ High-quality meta-analyses, systematic reviews of RCTs, or RCTs with a very low risk of bias 1+ Well-conducted meta-analysis, systematic reviews, or RCTs with a low risk of bias
1- Meta-analyses, systematic reviews, or RCTs with a high risk of bias 2++ High-quality systematic reviews of case-control or cohort studies
High-quality case-control or cohort studies with a very low risk of confounding or bias and a high probability that the relationship is causal
2+ Well-conducted case-control or cohort studies with a low risk of confounding or bias and a moderate probability that the relationship is causal
2- Case-control or cohort studies with a high risk of confounding or bias and a significant risk that the relationship is not causal
3 Non-analytic studies, eg case reports, case series
4 Expert opinion
3.12
What Works Clearinghouse
表
16: What Works Clearinghouse standards
LevelStrong In general, characterization of the evidence for a recommendation as strong requires both studies with high internal validity (i.e., studies whose designs can support causal conclusions) and studies with high external validity (i.e., studies that in total include enough of the range of participants and settings on which the recommendation is focused to support the conclusion that the results can be generalized to those participants and settings). Strong evidence for this practice guide is operationalized as:
• A systematic review of research that generally meets the standards of the What Works Clearinghouse (WWC) (see http://ies.ed.gov/ncee/wwc/) and supports the effectiveness of a program, practice, or approach with no contradictory evidence of similar quality; OR • Several well-designed, randomized controlled trials or well-designed quasiexperiments that
generally meet the WWC standards and support the effectiveness of a program, practice, or approach, with no contradictory evidence of similar quality; OR
• One large, well-designed, randomized controlled, multisite trial that meets the WWC standards and supports the effectiveness of a program, practice, or approach, with no contradictory evidence of similar quality; OR
• For assessments, evidence of reliability and validity that meets the Standards for Educational and Psychological Testing.
Moderate In general, characterization of the evidence for a recommendation as moderate requires studies with high internal validity but moderate external validity, or studies with high external validity but moderate internal validity. In other words, moderate evidence is derived from studies that support strong causal conclusions but where generalization is uncertain, or studies that support the generality of a relationship but where the causality is uncertain. Moderate evidence for this practice guide is operationalized as:
• Experiments or quasiexperiments generally meeting the WWC standards and supporting the effectiveness of a program, practice, or approach with small sample sizes and/or other conditions of implementation or analysis that limit generalizability and no contrary evidence; OR • Comparison group studies that do not demonstrate equivalence of groups at pretest and
therefore do not meet the WWC standards but that (a) consistently show enhanced outcomes for participants experiencing a particular program, practice, or approach and (b) have no major flaws related to internal validity other than lack of demonstrated equivalence at pretest (e.g., only one teacher or one class per condition, unequal amounts of instructional time, highly biased outcome measures); OR
• Correlational research with strong statistical controls for selection bias and for discerning influence of endogenous factors and no contrary evidence; OR
• For assessments, evidence of reliability that meets the Standards for Educational and
Psychological Testing but with evidence of validity from samples not adequately representative of the population on which the recommendation is focused.
Low In general, characterization of the evidence for a recommendation as low means that the recommendation is based on expert opinion derived from strong findings or theories in related areas and/or expert opinion buttressed by direct evidence that does not rise to the moderate or strong level. Low evidence is operationalized as evidence not meeting the standards for the moderate or high level.