Doctoral Dissertation
A STUDY ON THE APPLICATION OF WATER-FILM-FORMING-UNIT (WFFU)
IN ENHANCING CARBON DIOXIDE REMOVAL EFFECTIVENESS USING
WATER ABSORPTION METHOD
(
WFFU
)
NGUYEN KIM DIEM MAI
Division of Environmental Science and Engineering
Graduate School of Science and Engineering
Yamaguchi University, Japan
Doctoral Dissertation
A STUDY ON THE APPLICATION OF WATER-FILM-FORMING-UNIT (WFFU)
IN ENHANCING CARBON DIOXIDE REMOVAL EFFECTIVENESS USING
WATER ABSORPTION METHOD
(
WFFU
)
NGUYEN KIM DIEM MAI
A dissertation submitted to the Division of Environmental Science and Engineering of
Yamaguchi University in partial fulfillment of the requirements for the degree of Doctor of
Engineering (Dr. Eng.)
Advisor:
Professor Dr. Tsuyoshi IMAI
Division of Environmental Engineering,
Graduate School of Science and Technology for Innovation,
Yamaguchi University
Committee Members:
Professor Dr. Tsuyoshi IMAI
Professor Dr. Masahiko SEKINE
Professor Dr. Masakazu NIINAE
Professor Dr. Takashi SAEKI
Professor Dr. Takaya HIGUCHI
Division of Environmental Science and Engineering
Graduate School of Science and Engineering
ABSTRACT
With increased global attention on the greenhouse effect and climate change, identifying an
effective and economical solution to control the release of greenhouses gases, especially carbon
dioxide (CO
2), into the atmosphere has been the subject of much research. Because it does not
use chemicals or produce toxic byproducts, water scrubbing is an environmentally friendly
method of absorbing CO
2from exhaust gas and therefore provides a promising means of
controlling emissions of CO
2. However, the great limitation of this method is a low interaction
between CO
2and water, resulting in a low degree of removal and a high-pressure (1.0 to 2.0
MPa) operating requirement. In this study, I employed an apparatus outfitted with one or
several water-film-forming-units (WFFU) which can produce a large number of water-films
along with fine bubbles to promote the mass transfer and contact between the gas and liquid
phases and improve the effectiveness of water scrubbing.
The doctoral dissertation included 6 chapters and its content was presented as the following.
Chapter 1 introduced the background, the objectives of this study and the structure of the
doctoral dissertation.
The literature review related to this research and the summary of the previous study on the
CO
2removal technology were presented in Chapter 2.
In Chapter 3, the performance of an apparatus outfitted with a water-film generator in
removing CO
2from different concentrations of mixed gases (containing CO
2and N
2) while tap
water as a physical solvent to absorb CO
2was assessed through the obtained results of removal
efficiency and absorption rate under various conditions of key factors including internal
pressure, gas supplying pressure, temperature, gas-to-liquid ratio (G/L), and initial CO
2content. The internal pressure in the absorption tank and CO
2initial content, have a
significantly direct effect whereas temperature shows an inverse effect on the CO
2removal
efficiency and its absorption rate in water. The results also prove that the good performance of
CO
2removal process can be seen at the low gas supplying pressure of 0.30 MPa. The low value
of G/L can increase the removal efficiency but it prevents the economic aspect due to a decrease
of CO
2absorption rate. On varying the experimental conditions internal pressure (0.06 and
1.79), and initial CO
2content (10% 100%) the CO
2removal ability and absorption rate
varied from 22.9% to 90.0% and 4.5 × 10
-4to 44.5 × 10
-4mol s
-1L
-1, respectively. For instance,
the removal and absorption rates reached approximately 90.0% and 12.0 × 10
-4mol s
-1L
-1,
respectively, when the experiment was operated at 10 C and 0.30 MPa of gas supplying
pressure with 35% CO
2inlet gas content and 0.71 G/L.
Chapter 4 discussed about the application of statistical tools in assessing the performance
of CO
2removal process using the advanced water absorption apparatus. The influence of
various parameters pressure, initial CO
2concentration, G/L, and temperature on the CO
2removal efficiency and its absorption rate in water were investigated and estimated thoroughly
by statistical polynomial models obtained by the utilization of the response surface method
(RSM) with a central composite design (CCD). Based on the analysis of experimental matrix
containing 31 trials, a high efficiency of CO
2capture can be reached in conditions such as low
pressure, high CO
2concentration at the inlet, low gas/liquid ratio, and low temperature.
Furthermore, the coefficients of determination, R
2, were 0.996 for the removal rate and 0.982
for the absorption rate, implying that the predicted values computed by the constructed models
correlate strongly and fit well with the experimental values. It evidences that the models can
be used as useful tools to predict the CO
2removal efficiency and absorption rate accurately
without carrying out a large number of experiments. Therefore, the utilization of RSM-CCD
can provide several benefits such as time saving, reducing of experimental trials and
availability for observing the interactions among factors.
As discussed above, the advanced apparatus equipped with one WFFU support for the CO
2removal performance at low pressure but it still remains the limitation due to the low removal
rate under high load of feed gas (low absorption rate at high G/L). So as to assess
comprehensively the effect and the benefits of using WFFU in improving CO
2removal process,
I carried out the comparison of the values of CO
2removal and absorption rate which obtained
when conducting experiments in the apparatus equipped with non-, one- and two-WFFUs. The
results and discussions for this matter was shown in Chapter 5. Based on our results, the
WFFU significantly improves CO
2capture at 0.30 MPa in a water absorption system with two
WFFUs. The CO
2removal rate was 20% greater than for conventional systems without
number of WFFUs used in the absorption system has the greatest influence on CO
2removal
efficiency (contribution percentage = 50.65%) compared to gas supplying pressure, initial CO
2concentration, G/L, and liquid temperature. I also thoroughly investigated the effects of these
factors on CO
2removal performance in the apparatus linked with non- , one- and two-WFFUs.
The optimum conditions for CO
2removal efficiency in a system equipped with two WFFUs
are: low temperature, a G/L of 0.71, a gas supplying pressure of 0.30 MPa, and a high inlet
CO
2concentration. Therefore, our research improves on the physical absorption method for
removing CO
2from exhaust gas using tap water, thereby introducing a promising new
technology for controlling carbon dioxide emissions in a more environmentally friendly
manner.
Finally, Chapter 6 summarized the findings of this research including the CO
2removal
performance when using WFFU in enhancing the water absorption process, the optimum
removal conditions and the benefits of WFFU in the improvement of water absorption method.
In this chapter, the suggestions for the further work was revealed.
1 2MPa
1
0.3MPa
0.06 0.1MPa
0.30-0.70MPa
10-30
0.36-1.79
10-100
22.9-90.0
4.5 10
-444.5
10
-4mol s
-1L
-110
0.3MPa
35
0.71
90
12.4 10
-4mol s
-1L
-1Response Surface Method: RSM
Central Composite
Design: CCD
31
R
20.996
0.982
0.3MPa
CO
220%
TAGUCHI METHOD
50.65%
0.71
0.3MPa
ACKNOWLEDGEMENTS
First and foremost, I would like to express my sincere thanks to my supervisor Prof. Dr.
Tsuyoshi Imai for giving me an opportunity to be his doctoral student. Without his guidance
and persistent motivation in ups and down, this dissertation would not have been completed. I
extremely appreciate for his kindness, immense knowledge, valuable supervision, supports and
encouragement throughout three and a half year that I have studied in Japan.
This dissertation would not have been finished without the supports of the Ministry of
Education, Culture, Sports and Technology, Japan (MEXT) (Monbukagakusho Scholarship).
I would like to express my gratitude to the members of my graduate committee, Professor
Dr. Tsuyoshi Imai, Professor Dr. Masahiko Sekine, Professor Dr. Masakazu Niinae, Professor
Dr. Takashi Saeki, and Professor Dr. Takaya Higuchi, for their expert, constructive and helpful
suggestions for improving my dissertation.
It is a great honor for me to express my sincere gratitude to academic staffs in Graduate
School of Sciences and Technology for Innovation, Yamaguchi University: Prof. Dr. Masahiko
Sekine, Prof. Dr. Takaya Higuchi, Prof. Dr. Koichi Yamamoto, Prof. Dr. Ariyo Kanno and Ms.
Toshimi Yamamoto for their expert suggestions and constructive criticism which can improve
my research.
Sincere thanks and appreciation are also expressed to members of EISEI laboratory for their
helps and warm friendship. Special thanks to Shahira Aly, F. Mella, Y.P. Devia, A. Rivai,
D.T.T. Loc, D.T.T. Uyen, J. Wang, G. Yudha, S. Riza, T. Dyah, S. Nishihara, K. Tsukihara,
W. Yoshida, Y. Torigoe and other friends for their helps, encouragement and great friendship.
Last, but certainly not least, I would like to express my deepest, sincere and heartfelt
gratitude to my beloved parents, brother and sister for their great love, utmost support and
encouragement. Their love would always be my great motivation, inspiration and spiritual
support throughout of my life.
CONTENT
ABSTRACT ... i
... iv
ACKNOWLEDGEMENTS ... vii
CONTENT... viii
LIST OF FIGURES ... xii
LIST OF TABLES ... xv
LIST OF ABBREVIATIONS ... xvi
CHAPTER 1 INTRODUCTION ... 1
1.1 Background and problem statement ... 1
1.2 Dissertation objectives ... 4
1.3 Structure of dissertation ... 5
1.4 References ... 6
CHAPTER 2 LITERATURE REVIEW ... 9
2.1 Environmental issues of greenhouse gases and carbon dioxide ... 9
2.1.1 Global emissions of greenhouse gases and carbon dioxide ... 9
2.2 Carbon dioxide capture and storage (CCS) ... 14
2.2.1 Overview of Carbon capture and Storage ... 14
2.2.2 Capture technologies ... 16
2.2.3 CO
2separation techniques ... 18
2.2.3.1 Absorption ... 18
2.2.3.2 Water scrubbing ... 20
2.2.3.3 Adsorption ... 21
2.2.3.4 Cryogenic distillation ... 23
2.2.3.5 Membrane ... 24
2.2.4 CO
2transport ... 24
2.2.5 CO
2storage ... 25
2.2.6 CO
2utilization ... 26
2.2.6.1 Direct utilization of CO
... 27
2.2.6.2 Conversion of CO
2into chemicals and fuels ...27
2.2.6.3 Mineral carbonation ... 27
2.2.6.4 Enhanced oil and coal-bed methane recovery ... 28
2.2.6.5 Microalgae... 28
2.3 Potential application of microbubble and liquid/water-film in the removal of
carbon dioxide using water scrubbing... 29
2.3.1 Characteristics of microbubble ... 29
2.3.2 Characteristics of liquid-film ... 32
2.3.3 Water scrubbing advanced with the generation of microbubble and
liquid-film/water-film in the removal of carbon dioxide ... 34
2.4 References ... 35
CHAPTER 3 PERFORMANCE OF A CARBON DIOXIDE REMOVAL PROCESS
USING A WATER SCRUBBER WITH THE AID OF A
WATER-FILM-FORMING-UNIT ... 45
3.1 Introduction ... 45
3.2 Materials and Methods ... 48
3.3 Results and Discussion ... 51
3.3.1 Effect of internal pressure in the absorption tank ... 51
3.3.2 Effect of inlet gas supplying pressure ... 52
3.3.3 Effect of gas-to-liquid ratio ... 54
3.3.4 Effect of CO
2partial pressure and initial CO
2concentration ... 55
3.3.5 Effect of temperature ... 57
3.4 Conclusions ... 59
3.5 References ... 60
CHAPTER 4 RESPONSE SURFACE METHOD FOR MODELING THE REMOVAL
OF CARBON DIOXIDE FROM A SIMULATED GAS USING WATER
ABSORPTION ENHANCED WITH A WATER-FILM-FORMING-UNIT ... 63
4.1 Introduction ... 63
4.2 Materials, experimental apparatus and methods ... 65
4.2.2 Plackett Burman design ...66
4.2.3 Response surface method (RSM) ... 68
4.3 Results and discussion ... 69
4.3.1 Screening key factors affecting the removal of CO
2using tap water as the
absorbent ... 69
4.3.2 Effect of operating factors on the removal of CO
2using tap water as the
absorbent ... 73
4.3.3 Evaluation of the models and experiment ... 79
4.4 Conclusions ... 85
4.5 References ... 86
CHAPTER 5 INFLUENCE OF WATER-FILM-FORMING-UNIT ON THE
ENHANCED REMOVAL OF CARBON DIOXIDE FROM MIXED GAS USING
WATER ABSORPTION APPARATUS ... 89
5.1 Introduction ... 89
5.2 Materials and Methods ... 91
5.2.1 Experimental setup and methods ... 91
5.2.2 Taguchi analysis method ... 93
5.3 Results and Discussion ... 96
5.3.1 Effect of water-film-forming-unit (WFFU) ... 96
5.3.2 Effect of inlet gas supplying pressure ... 98
5.3.3 Effect of CO
2initial concentration ... 99
5.3.4 Effect of gas-to-liquid ratio ... 101
5.3.5 Effect of temperature ... 102
5.3.6 Taguchi method results ... 103
5.4 Conclusions ... 108
5.5 References ... 108
CHAPTER 6 CONCLUSIONS AND FUTURE WORKS ... 111
6.1 Conclusions ... 111
6.1.1 Performance of CO
2removal process using a water scrubber enhanced with
a WFFU ... 111
6.1.2 Response surface method (RSM) with central composite design (CCD) for
modeling the removal of carbon dioxide using water absorption enhanced
with a WFFU ... 112
6.1.3 Influence of WFFU on the enhanced removal of carbon dioxide from mixed
gas using water absorption apparatus ... 113
6.2 Future works ... 114
LIST OF PUBLICATIONS AND PRESENTATIONS ... 115
LIST OF FIGURES
Figure 2.1 Radiative forcing estimates in 2011 relative to 1750 and aggregated
uncertainties for the main drivers of climate change. ... 10
Figure 2.2 Global greenhouse gas emissions, per country and region ... 11
Figure 2.3 Total anthropogenic GHG emissions (GtCO
2eq/yr) by economic sectors and
country income groups ... 13
Figure 2.4 Contribution to 2016 greenhouse gas emissions per emission category ... 14
Figure 2.5 Various carbon capture, storage and utilization selections ... 15
Figure 2.6 Carbon capture options ... 17
Figure 2.7 Technology options for CO
2separation ... 18
Figure 2.8 Options for storing CO
2in deep underground geological formation... 26
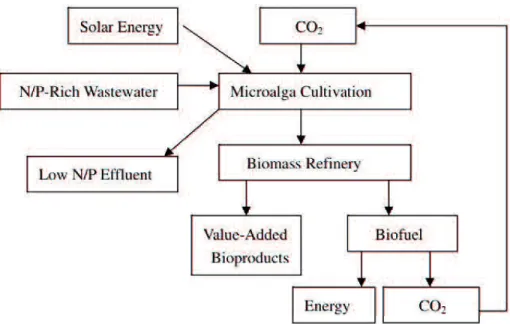
Figure 2.9 A flow-chart of microalgae system for combined biofuels production, CO
2bio-mitigation, and N/P removal from wastewater ... 29
Figure 2.10 Schematic structure of microbubble ... 30
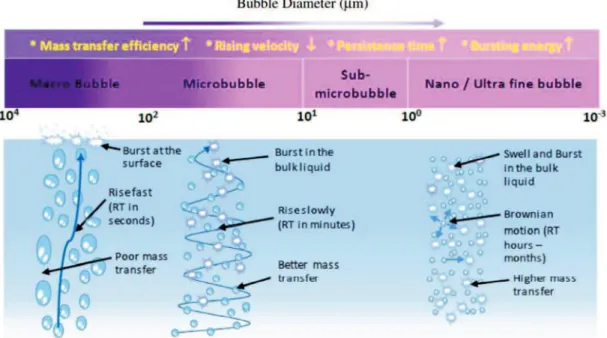
Figure 2.11 The behaviors of macro, micro and nanobubbles in water ... 31
Figure 2.12 The major properties of bubbles according to bubble sizes ... 32
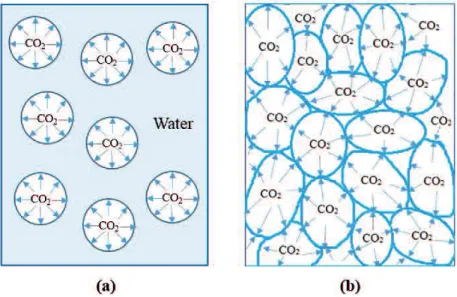
Figure 2.13 Schematic diagram of (a) conventional bubbles and (b) liquid-films. ... 33
Figure 3.1 Experimental apparatus used for CO
2absorption... 48
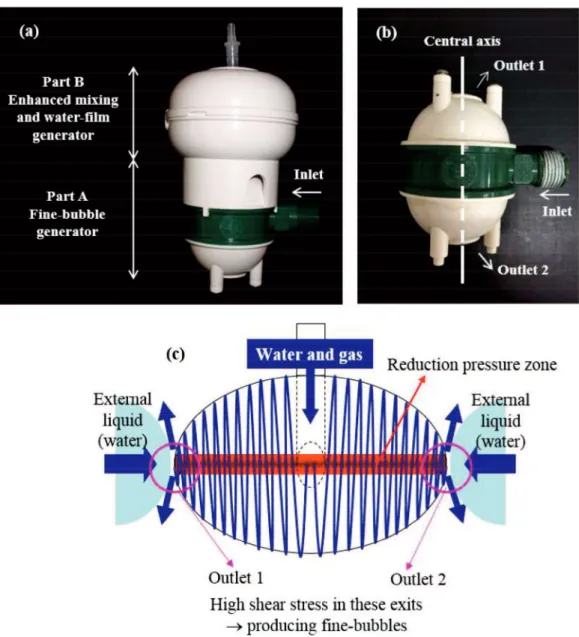
Figure 3.2 (a) Structure of WFFU, (b) a fine-bubble generator (Part A) and (c) theory of
making fine-bubbles. ... 50
Figure 3.3 CO
2removal efficiency and absorption rate at different CO
2concentrations
of inlet gas (G
1, G
2, and G
3) under internal pressure conditions of 0.06 and
0.10 MPa. Water flow rate: 14 L min
-1; total gas flow rate: 20 L min
-1; total
inlet gas supplying pressure: 0.50 MPa; and temperature: 20 C... 52
Figure 3.4 Removal efficiency and absorption rate of CO
2at different compositions of
inlet gas under various total inlet gas supplying pressures. Water flow rate:
14 L min
-1; internal pressure: 0.06 MPa; and temperature: 20 C. (a) Total gas
flow rate: 10 L min
-1; (b) Total gas flow rate: 20 L min
-1. ... 53
Figure 3.5
(a) Removal efficiency of CO
2at different compositions of inlet gas with a
changing G/L ratio. (b) Absorption rate of CO
2and pH of outlet water at
different compositions of inlet gas with a changing G/L ratio. Water flow rate:
14 L min
-1; internal device pressure: 0.06 MPa; total inlet gas supplying
pressure: 0.50 MPa; and temperature: 20 C. ... 55
Figure 3.6 Removal efficiency of CO
2, (b) absorption rate of CO
2, and (c) pH of the
absorbed water at different initial CO
2partial pressures with a total gas flow
rate of 15 L min
-1and 20 L min
-1;
Water flow rate: 14 L min
-1; internal device
pressure: 0.06 MPa; total inlet gas supplying pressure: 0.50 MPa; and
temperature: 20 C. ... 57
Figure 3.7 Removal efficiency and absorption rate of CO
2in water at different gas
compositions: (a) 15% CO
285% N
2, (b) 25% CO
275% N
2, and (c) 35%
CO
265% N
2. Total gas flow rate: 20 L min
-1; water flow rate: 14 L min
-1;
internal device pressure: 0.06 MPa; total inlet gas supplying pressure: 0.50
MPa. ... 58
Figure 4.1 Experimental apparatus used for CO
2absorption: (1) CO
2and N
2cylinders;
(2) mass flow controllers; (3) water tank; (4) pump; (5) reactor; (6)
liquid-film-forming device; (7) exhaust gas valve; and (8) blowdown valve. ... 66
Figure 4.2 Correlation between observed and predicted values for (a) removal efficiency
and (b) absorption rate. ... 75
Figure 4.3 Three-dimensional response surface plots and contour plots of removal
efficiency interactions between: (a) gas supplying pressure and G/L ratio; (b)
CO
2initial concentration and G/L ratio; (c) gas supplying pressure and
temperature. ... 77
Figure 4.4 Three-dimensional response surface plots and contour plots of absorption rate
interaction between: (a) gas supplying pressure and G/L ratio; (b) CO
2initial
concentration and G/L ratio; (c) gas supplying pressure and temperature. .. 78
Figure 4.5 CO
2Concentration dissolving into 60 L of water and the change of pH during
(WFFU). Inlet gas supplying pressure: 0.50 MPa; inlet gas composition: 15%
CO
285% N
2; G/L ratio: 1.43; and temperature: 20 °C. ... 85
Figure 5.1 Schematic diagram of the apparatus used for the removal of carbon dioxide
in this study. ... 92
Figure 5.2 Snapshots of the production of water-films and fine bubbles in the absorption
tank. ... 92
Figure 5.3 Effect of the water-film-forming-unit (WFFU) on (a) CO
2removal efficiency
and (b) absorption rate. Operating conditions: gas supplying pressure = 0.30
MPa; G/L ratio = 1.07; total gas flow rate = 15 L min
-1; water flow rate = 14
L min
-1; and temperature = 15°C. ... 97
Figure 5.4 Effect of gas supplying pressure on (a) CO
2removal efficiency and (b)
absorption rate. Operating conditions: G/L ratio = 1.07; total gas flow rate =
15 L min
-1; water flow rate = 14 L min
-1; feed gas composition = 25% CO
2
and 75% N
2; and temperature = 15 °C. ... 99
Figure 5.5 Effect of CO
2initial concentration on (a) CO
2removal efficiency and (b)
absorption rate. Operating conditions: gas supplying pressure = 0.50 MPa;
G/L ratio = 1.07; total gas flow rate = 15 L min
-1; water flow rate = 14 L min
-1; and temperature = 15 °C. ... 100
Figure 5.6 Effect of G/L ratio on CO
2removal efficiency and absorption rate with a feed
gas composition of (a) 15% CO
2and 85% N
2and (b) 35% CO
2and 65% N
2.
Operating conditions: gas supplying pressure = 0.50 MPa; water flow rate =
14 L min
-1; and temperature = 15 °C. ... 102
Figure 5.7 Effect of liquid temperature on CO
2removal efficiency and absorption rate.
Operating conditions: gas supplying pressure = 0.30 MPa; G/L ratio = 1.07;
total gas flow rate = 15 L min
-1; water flow rate = 14 L min
-1; and feed gas
composition = 15% CO
2and 85% N
2. ... 103
Figure 5.8 S/N ratios and delta values for each factor influencing the (a) removal
efficiency and (b) absorption rate. ... 105
Figure 5.9 Contribution percentages and ranking of five controlling factors on the (a)
LIST OF TABLES
Table 1.1 Comparison of different carbon dioxide removal technologies ... 1
Table 3.1 Typical CO
2content in exhausted gas ... 46
Table 4.1 Levels of the experimental variables, estimated effects, and P-value studied in
the Plackett-Burman design ... 67
Table 4.2 Plackett-Burman design matrix for evaluating influent factors with removal
efficiency and absorption rate as responses ... 70
Table 4.3 Central composite design matrix for the experimental design and predicted
responses for removal efficiency E (%) and absorption rate R (mol s
-1L
-1) ... 71
Table 4.4 Significance of regression coefficients for removal efficiency E (%) and
absorption rate R (mol s
-1L
-1) ... 73
Table 4.5 Analysis of variance (ANOVA) for the parameters of central composite design
(CCD) for removal efficiency E (%) and absorption rate R (mol s
-1L
-1) ... 74
Table 4.6 Experimental confirmation for removal efficiency E (%) and absorption rate R
(mol s
-1L
-1) ... 82
Table 4.7 Comparison of different CO
2removal technologies ... 83
Table 5.1 Controlling factors and their levels ... 94
Table 5.2
L
18orthogonal design and CO
2removal efficiency, absorption rate
and S/N ratio results ... 95
Table 5.3 S/N response table for CO
2removal efficiency and absorption rate ... 104
LIST OF ABBREVIATIONS
ANOVA: Analysis of variance
Adj- R
2: Adjusted determination coefficient
AFOLU: Agriculture, forestry and other land use
CCD: Central composite design
CCS: Carbon capture and storage
CO
2: Carbon dioxide
Conc.: Concentration
E: Removal efficiency
Eq: Equivalent
EOR: Enhanced oil recovery
GC: Gas chromatography
G/L: Gas-to-liquid ratio
G
1: Mixture gas of 15% CO
2and 85% N
2G
2: Mixture gas of 25% CO
2and 75% N
2G
3: Mixture gas of 35% CO
2and 65% N
2GHG: Greenhouse gas
GSP: Gas supplying pressure
Gt: Gigatonne
L min
-1: Liter per minute
N
2: Nitrogen
P-value: Probability unit
R: Absorption rate
RF: Radiative forcing
R
2: Determination coefficient
RSM: Response surface method
Temp.: Temperature
WFFU: Water-film-forming-unit
X
1: Symbol for the factor of gas supplying pressure
X
2: Symbol for the factor of CO
2initial concentration
X
3: Symbol for the factor of G/L ratio
CHAPTER 1
INTRODUCTION
1.1
Background and problem statement
Global warming and climate change have recently resulted in several negative influences on
the environment, living creatures and human health. Therefore, finding out the solutions so as
to mitigate the greenhouse effects, which are related to the high amount of greenhouse gases
in the atmosphere, is currently global concerns (Nguyen et al., 2018). In the comparison among
numerous greenhouse gases including CO
2, CH
4, N
2O, CFCs and F-gases, CO
2alone
contributes a major percentage of more than 80% to the total greenhouse gas emissions (Lee et
al., 2012). As a result, only does CO
2occupy over 60% of the total greenhouse effect (Mondal
et al., 2012, Yu et al., 2012,
et al., 2007). As a consequence, the development of a
method which can capture CO
2from flue gas effectively and availably is essential and urgent.
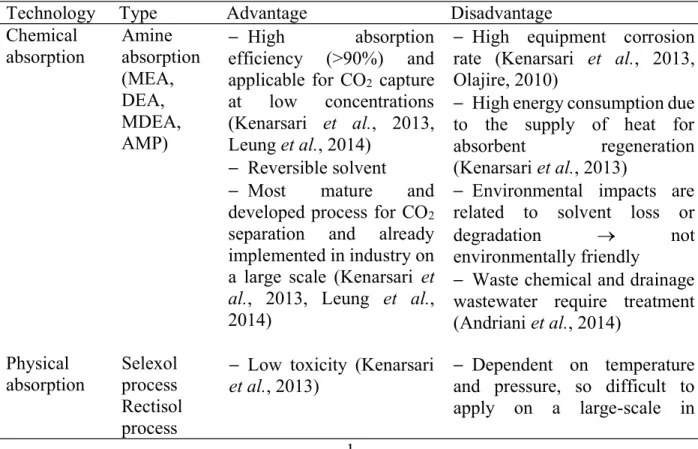
Table 1.1 presents various popular technologies using to reduce the emission of CO
2from gas
streams.
Table 1.1 Comparison of different carbon dioxide removal technologies
Technology Type
Advantage
Disadvantage
Chemical
absorption
Amine
absorption
(MEA,
DEA,
MDEA,
AMP)
High
absorption
efficiency (>90%) and
applicable for CO
2capture
at
low
concentrations
(Kenarsari et al., 2013,
Leung et al., 2014)
Reversible solvent
Most
mature
and
developed process for CO
2separation and already
implemented in industry on
a large scale (Kenarsari et
al., 2013, Leung et al.,
2014)
High equipment corrosion
rate (Kenarsari et al., 2013,
Olajire, 2010)
High energy consumption due
to the supply of heat for
absorbent
regeneration
(Kenarsari et al., 2013)
Environmental impacts are
related to solvent loss or
degradation
not
environmentally friendly
Waste chemical and drainage
wastewater require treatment
(Andriani et al., 2014)
Physical
absorption
Selexol
process
Rectisol
process
Low toxicity (Kenarsari
et al., 2013)
and pressure, so difficult to
Dependent on temperature
apply on a large-scale in
Purisol
process
Water
absorption
Low
corrosion
(Kenarsari et al., 2013)
Low
energy
consumption
and
low
energy required for sorbent
regeneration (Kenarsari et
al., 2013, Songolzadeh et
al., 2014)
No special chemicals
required if water is used as
solvent (Andriani et al.,
2014)
industrial plants (Songolzadeh
et al., 2014)
High pressure is required and
low efficiency for CO
2removal
(Kenarsari et al., 2013, Olajire,
2010)
Adsorption
Pressure
swing
adsorption
(PSA)
Process is reversible and
the absorbent can be
recycled (Leung et al.,
2014)
High
adsorption
efficiency
achievable
(>85%) (Leung et al., 2014)
No by products such as
wastewater because of
using solids to adsorb CO
2(Mondal et al., 2012)
Requires high temperature
adsorbent, high energy for CO
2desorption, and has high
operation costs (Leung et al.,
2014)
Low selectivity and capacity
of available adsorbent CO
2.
Rarely applied to large-scale
separation of CO
2(Kenarsari et
al., 2013, Mondal et al., 2012)
Membrane
separation
Gas/Gas
Gas/Liquid
applied to separation of
Process
has
been
other gases (Leung et al.,
2014)
More
than
80%
separation
efficiency
(Leung et al., 2014)
No waste stream and no
regeneration
process
(Kenarsari et al., 2013)
Operational problems include
low fluxes and fouling (Leung et
al., 2014)
High cost of membrane. The
membrane
is
easily
contaminated and plugged by
impurities in the feed gas
(Kenarsari et al., 2013)
Membrane
often
suffers
thermal shock and chemical
corrosion (Xiao et al., 2014)
No large-scale operation
experience (Leung et al., 2014)
Taken together, each of technologies mentioned above has their benefits and drawbacks
with reference to evaluating factors consisting of removal capacity, operation, cost, energy,
equipment, and environmental influence. Upon these methods, due to the fact that absorption
is the most mature method that has been in practical application for 60 years, it is the most
popular and commercial method for separating CO
2from the exhausted gases (Babu, 2014,
Rao & Rubin, 2002). The basic fundamental of this technique is to absorb one or more
substances from a mixture of gas into a liquid phase through the boundary of vapor liquid
phase (Nguyen et al., 2018). Physical absorption and chemical absorption are generally
concerned as two major kinds of absorption method. The difference between these two methods
is whether a chemical reaction happens after the substances dissolving into an aqueous phase
or not (Aresta, 2013). Due to the high removal performance, chemical absorption especially,
amine absorption is broadly applied for the capture of CO
2from industrial emitted gases.
Nevertheless, this method remains several restrictions. Firstly, because of the use of organic
amine absorbent, this method demands high energy consumption for the amine regeneration
process. Next, this process leads to a high rate of oxidization and produces toxic volatile
degradation substances (Nguyen et al., 2018). Additionally, the emitted amine is possible to
degrade to nitrosamines and nitramines which jeopardize human health and the environment
(Leung et al., 2014). As a consequence, this method is not environmentally friendly. These
negative issues can be solved by using the method of physical absorption water absorption
(Nguyen et al., 2018).
Water absorption is the technique that is the most cost-effective and friendly to the
environment since comparing to other methods such as chemical absorption, cryogenics or
membrane. Herein, water is used as a solvent so the drainage effluent which is CO
2-rich water
can directly or indirectly use for other industrial- or lab-scale application and for storing CO
2.
For instance, the CO
2-rich water after absorption can use for cultivating microalga to produce
biofuels and biomass and mineral carbonating. The interaction between CO
2and water also is
weak so CO
2can be recovered in the manner of saving cost and energy.
However, the most important drawback of water scrubbing is that in order to achieve high
absorption performance, the high working pressure is required over 1.0 MPa (Ryckebosch et
al., 2011) which means that high energy and cost requirement. Water scrubbing was used to
remove CO
2and upgrade a landfill gas consisting of 53.2% CH
4, 40.8% CO
2, 0.4% O
2and
4.9% N
2in the pilot-scale packed column (Rasi et al., 2008). The results depicted that CO
2removal ability was about 90.0% as the operational conditions are that the pressure is 3.0 MPa,
water flow rate is 10 Lmin
-1and gas flow rate is 50 L min
-1(Rasi et al., 2008). Another research
removal rates at water flow rate of 11 L min
-1, gas flow rate of 7.41 Nm
3h
-1and water
temperature of 10 15 °C were 85.8% at pressure of 2.0 MPa, 87.0% at pressure of 2.3 MPa
and 88.9% at pressure of 2.5 MPa (Läntelä et al., 2012). Xiao and his group also conducted
research of CO
2removal using water scrubbing (Xiao et al., 2014). The obtained data presented
that the removal of CO
2can fluctuate between 24.4 94.2% at the range of pressure (0.8 1.2
MPa), inlet CO
2content (25 45 %), water flow rate/gas flow rate ratio (0.15 0.5) and
temperature (10 40 °C) (Xiao et al., 2014).
The restrict requirement for pressure when using water absorption is not limited for
absorption pressure, it also requires high gas partial pressure. Water scrubbing method has just
applied for the feed gas containing high CO
2partial pressure. Hence, water scrubbing is limited
to use in pre-combustion or oxy-fuel combustion system and in upgrading fuel gas such as
biogas, natural gas or landfill gas. The utilization of microbubble- and liquid-film-forming
apparatus can remedy this issue. Both types of gas bubbles prove that they are innovated
technologies to not only produce numerous boundary and interfacial contact area but also
stimulate mass transfer between two phases of gas and water (Bredwell & Worden, 1998, Imai
& Zhu, 2011, Jamnongwong et al., 2016, Zhu et al., 2007a, Sadatomi et al., 2012). With these
properties, the produce of a large number of microbubbles and liquid-films in the liquid bulk
can improve a gas dissolution rate which results in the circumstance that gas saturation
concentration can reach in short time with the saving of energy consumption and the low
pressure for compressing gas phase (Sadatomi et al., 2012, Jamnongwong et al., 2016,
Temesgen et al., 2017, Zhu et al., 2007b, Zhu et al., 2007a). Generally, it is expected that with
the utility of microbubbles and liquid-film generator, the advanced water scrubbing can capture
CO
2effectually for every type of feed gas even though feed gas containing low CO
2partial
pressure since low mode pressure is applied
1.2
Dissertation objectives
The goal of this study is to explore an innovated water scrubbing which can improve the
effectivity through the support of water-film-forming-unit (WFFU) for capturing CO
2from the
mixed gas with N
2. So as to accomplish the study target, the research was carried out to achieve
To investigate the effect of key factors such as internal pressure, gas supplying pressure,
gas-to-liquid flow rate ratio, initial CO
2content and liquid temperature on the CO
2removal
efficiency and absorption rate when using the water absorption advanced with WFFU.
To evaluate the effects and benefits of WFFU in improving the performance of water
absorption process through comparing the obtained results of the CO
2removal efficiency and
absorption rate in three cases of experiments consisting of using non-WFFU, 1-WFFU and
2-WFFUs.
To assess intensively the effect of gas supplying pressure on the absorption process which
is the primary advantage of the conventional water scrubber. Therefore, it can be concluded
that the presence of WFFU can improve the absorption capacity at low pressure as well as
reduce the effect of pressure when applying water absorption for CO
2capture.
To apply statistic tools such as Taguchi method, Plackett-Burman and Response Surface
Method for evaluating thoroughly the effect of key factors on responses and the interaction
among factors, determining the contribution percentage of each factor on responses and
exploring the optimal conditions.
1.3
Structure of the dissertation
Chapter 1 Introduction
Chapter 2 Literature review
Chapter 3 Performance of a carbon dioxide removal process using a water scrubber with
the aid of a water-film-forming-unit
Chapter 4 Response surface method for modeling the removal of carbon dioxide from a
simulated gas using water absorption enhanced with a water-film-forming-unit
Chapter 5 Influence of water-film-forming-unit on the enhanced removal of carbon
dioxide from mixed gas using water absorption apparatus
Chapter 6 Conclusions and future works
1.4
References
Andriani, D., Wresta, A., Atmaja, T. D. & Saepudin, A. 2014. A review on optimization
production and upgrading biogas through CO
2removal using various techniques. Applied
biochemistry and biotechnology, 172 (4), 1909-1928.
Aresta, M. 2013. Carbon dioxide recovery and utilization, Springer Science & Business Media.
Germany.
Babu, P. V. 2014. Hydrate based gas separation (HBGS) technology for precombustion capture
of carbon dioxide. PhD thesis. National University of Singapore, Singapore.
Bredwell, M. D. & Worden, R. M. 1998. Mass transfer properties of microbubbles. 1.
Experimental studies. Biotechnology Progress, 14 (1), 31-38.
Imai, T. & Zhu, H., 2011. Improvement of oxygen transfer efficiency in diffused aeration
systems using liquid-film-forming apparatus, Mass Transfer-Advanced Aspects. InTech.
Jamnongwong, M., Charoenpittaya, T., Hongprasith, N., Imai, T. & Painmanakul, P. 2016.
Study of Liquid Film Forming Apparatus (LFFA) mechanisms in terms of oxygen transfer
and bubble hydrodynamic parameters. Engineering Journal (Eng. J.), 20 (3), 77-90.
Kenarsari, S. D., Yang, D., Jiang, G., Zhang, S., Wang, J., Russell, A. G., Wei, Q. & Fan, M.
2013. Review of recent advances in carbon dioxide separation and capture. Rsc Advances,
3 (45), 22739-22773.
Läntelä, J., Rasi, S., Lehtinen, J. & Rintala, J. 2012. Landfill gas upgrading with pilot-scale
water scrubber: performance assessment with absorption water recycling. Applied energy,
92, 307-314.
Lee, Z. H., Lee, K. T., Bhatia, S. & Mohamed, A. R. 2012. Post-combustion carbon dioxide
capture: Evolution towards utilization of nanomaterials. Renewable and Sustainable
Energy Reviews, 16 (5), 2599-2609.
Leung, D. Y., Caramanna, G. & Maroto-Valer, M. M. 2014. An overview of current status of
carbon dioxide capture and storage technologies. Renewable and Sustainable Energy
Reviews, 39, 426-443.
for carbon dioxide capture. Energy Conversion and Management, 48 (1), 251-258.
Mondal, M. K., Balsora, H. K. & Varshney, P. 2012. Progress and trends in CO
2Nguyen, D.-M. K., Imai, T., Dang, T.-L. T., Kanno, A., Higuchi, T., Yamamoto, K. & Sekine,
M. 2018. Response surface method for modeling the removal of carbon dioxide from a
simulated gas using water absorption enhanced with a liquid-film-forming device.
Journal of Environmental Sciences, 65, 116-126.
Olajire, A. A. 2010. CO
2capture and separation technologies for end-of-pipe applications A
review. Energy, 35 (6), 2610-2628.
Rao, A. B. & Rubin, E. S. 2002. A technical, economic, and environmental assessment of
amine-based CO
2capture technology for power plant greenhouse gas control.
Environmental science & technology, 36 (20), 4467-4475.
Rasi, S., Läntelä, J., Veijanen, A. & Rintala, J. 2008. Landfill gas upgrading with
countercurrent water wash. Waste Management, 28 (9), 1528-1534.
Ryckebosch, E., Drouillon, M. & Vervaeren, H. 2011. Techniques for transformation of biogas
to biomethane. Biomass and bioenergy, 35 (5), 1633-1645.
Sadatomi, M., Kawahara, A., Matsuura, H. & Shikatani, S. 2012. Micro-bubble generation rate
and bubble dissolution rate into water by a simple multi-fluid mixer with orifice and porous
tube. Experimental Thermal and Fluid Science, 41, 23-30.
Songolzadeh, M., Soleimani, M., Takht Ravanchi, M. & Songolzadeh, R. 2014. Carbon dioxide
separation from flue gases: a technological review emphasizing reduction in greenhouse
gas emissions. The Scientific World Journal, 2014, 1-34.
Temesgen, T., Bui, T. T., Han, M., Kim, T.-i. & Park, H. 2017. Micro and nanobubble
technologies as a new horizon for water-treatment techniques: A review. Advances in
colloid and interface science, 246, 40-51.
Xiao, Y., Yuan, H., Pang, Y., Chen, S., Zhu, B., Zou, D., Ma, J., Yu, L. & Li, X. 2014. CO
2removal from biogas by water washing system. Chinese Journal of Chemical Engineering,
22 (8), 950-953.
Yu, C.-H., Huang, C.-H. & Tan, C.-S. 2012. A review of CO
2capture by absorption and
adsorption. Aerosol and Air Quality Research, 12 (5), 745-769.
Zhu, H., Imai, T., Tani, K., Ukita, M., Sekine, M., Higuchi, T. & Zhang, Z. 2007a.
Enhancement of oxygen transfer efficiency in diffused aeration systems using
liquid-film-forming apparatus. Environmental technology, 28 (5), 511-519.
Zhu, H., Imai, T., Tani, K., Ukita, M., Sekine, M., Higuchi, T. & Zhang, Z. 2007b.
Development of high efficient oxygen supply method by using contacting water-liquid film
with air. Journal of Water and Environment Technology, 5 (2), 57-69.
CHAPTER 2
LITERATURE REVIEW
2.1
Environmental issues of greenhouse gases and carbon dioxide
2.1.1 Global emissions of greenhouse gases and carbon dioxide
Climate change or global warming recently becomes the most global concern due to several
world spread drawbacks. It refers to the rise in average surface temperature on the Earth with
various pieces of physical evidence related to (1) the alterations in temperature, (2) the
alterations in energy budget and heat content, (3) the alterations in circulation and modes of
variability, (4) the alterations in the water cycle and cryosphere, (5) the alterations in sea level,
(6) the alterations in extremes, and finally, (7) the alterations in carbon and other
biogeochemical cycles (Stocker et al., 2013). According to the calculation by a linear trend,
the worldwide averaged temperature which is combined between land temperature and oceanic
temperature reveal an increasing temperature of 0.85 °C in the period of 1880 2012.
Excepting for glaciers on the periphery of the ice sheets, the global average rate of ice loss from
glaciers from 1971 to 2009 was 226 Gt yr
-1compared to 275 Gt yr
-1over the period 1993 to
2009 (Stocker et al., 2013). Due to the ice loss, the mean rate of global averaged sea level rise
was 2.0 mm yr
-1in the time of 1971 2010 and 3.2 mm yr
-1in the time of 1993 2010 (Stocker
et al., 2013). Climate change also influences carbon cycle processes in the manner that
increases CO
2in the atmosphere which is able to increase ocean acidification. The reality is
that 0.1 unit of the oceanic surface pH has reduced since the start of the industrialized era
(Stocker et al., 2013).
It cannot be denied that over a half of detected growth in global average surface temperature
from 1951 to 2010 was resulted by the upward trend in anthropogenic greenhouse gases
(GHGs) emission and another anthropogenic forcing together (Stocker et al., 2013). Only did
GHGs contribute to the global mean surface warming in the range of 0.5 °C to 1.3 °C (Stocker
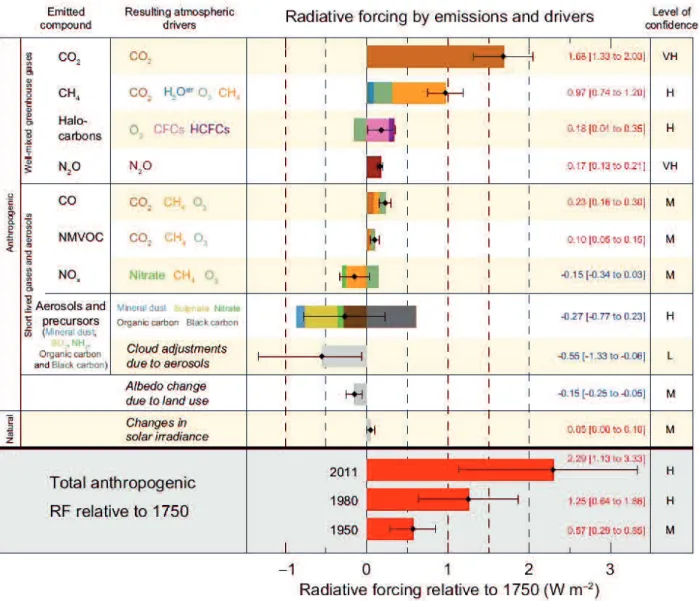
et al., 2013). Alternatively, the total radiative forcing (RF) is vital and essential to evaluate the
drivers of climate change due to the fact that positive RF is the cause for the surface warming
while negative RF is the cause for the surface cooling. Based on the statistics, since 1750, the
highest involvement to total RF originated from the increases of CO
2concentration in the
atmosphere. Owing to a conjunction of the positive RF resulted by the majority of greenhouse
gas concentrations and the negative RF resulted by NO
x, aerosols and precursors, the total
anthropogenic RF for 2011 relative to 1750 is 2.29 W m
2(Figure 2.1) (Stocker et al., 2013).
Figure 2.1 Radiative forcing estimates in 2011 relative to 1750 and aggregated uncertainties
for the main drivers of climate change (Stocker et al., 2013)
.
Specifically, the RF from emissions of well-mixed greenhouse gases (the first group in
Figure 2.1 which consisting of CO
2, CH
4, N
2O, and Halocarbons) for 2011 relative to 1750 is
3.00 W m
2. The RF value for CO
2
emission alone of 1.68 W m
2, for CH
4emission alone of
0.97 W m
2, for stratospheric ozone-depleting halocarbons of 0.18 W m
2and for N
2
O emission
The most abundant and noticeable greenhouse gases are carbon dioxide (CO
2), methane
(CH
4), nitrous oxide (N
2O), chlorofluorocarbons (CFCs) and fluorinated gases (F-gases).
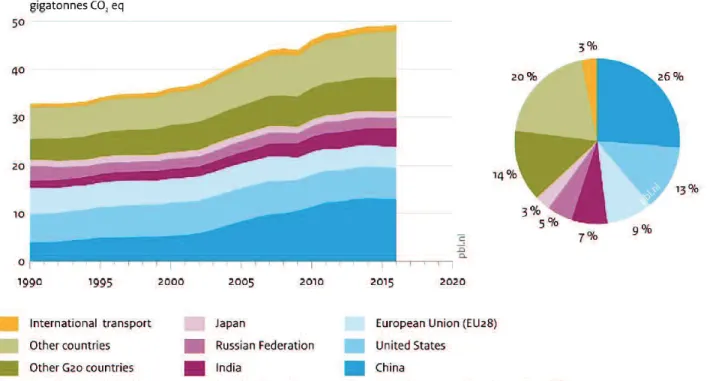
Based on the report in 2016, total greenhouse gas emissions remains a slight upward trend by
about 0.5% ( 0.1%), to about 49.3 Gt in CO
2equivalent (Gt CO
2eq) (Olivier et al., 2017). As
presented in Figure 2.2, within 49.3 Gt in CO
2CO
2emission and about 63%
of total global GHG emissions (Olivier et al., 2017).
Figure 2.2 Global greenhouse gas emissions, per country and region (Olivier et al., 2017).
Total anthropogenic GHG emissions follow a significant increasing trend year by year
and reveal different values depending on economic sectors and country income groups (see
Figure 2.3). In Figure 2.3(a), the pie chart shows direct GHG emission shares (in % of total
anthropogenic GHG emissions) of five major economic sectors in 2010 (Edenhofer et al.,
2014). Herein, the five major economic sectors and their percentages are electricity and heat
production (25%), agriculture, forestry and other land use (AFOLU) (24%), industry (21%),
transport (14%), buildings (6.4%) and other energy (9.6%) (Edenhofer et al., 2014).
The bar chart in Figure 2.3(b) illustrates the total anthropogenic GHG emissions by five
main economic sectors and country income groups in three typical years of 1970, 1990 and
2010 (Edenhofer et al., 2014). There are five types of country income groups consisting of
bunkers, low income, lower mid income, upper mid income, and high income (Edenhofer et
al., 2014). It is clear to notice that the huge number of GHG emissions derive from high income
and developed countries. In these countries, most emissions originate from the supply of energy
and electricity. In contrast, the total emissions of low-income countries are dominated by
AFOLU (Edenhofer et al., 2014, Ausubel et al., 2013).
Globally, CO
2, CH
4, N
2O and F-gases are the crucial anthropogenic greenhouse gases. The
emitted majority source for CO
2is the combustion of fossil fuel. CO
2can also be released from
direct anthropogenic impacts on forestry and other land use, for example, deforestation, land
clearing for agriculture, and soil degradation (EPA, 2018). Similarly, the reforestation,
improvement of soils, and other activities can extract CO
2from the land to the environment
(EPA, 2018). Meanwhile, the emission of CH
4can be completed under the agricultural
activities, waste management, energy use, and biomass burning (EPA, 2018). For the emission
of N
2O, it has been concerned by agricultural activities, the use of fertilizer and fossil fuel
combustion. Finally, fluorinated gases (F-gases) containing hydrofluorocarbons (HFCs),
perfluorocarbons (PFCs), and sulfur hexafluoride (SF
6) originated from manufacturing
Figure 2.3 Total anthropogenic GHG emissions (GtCO
2eq/yr) by economic sectors and
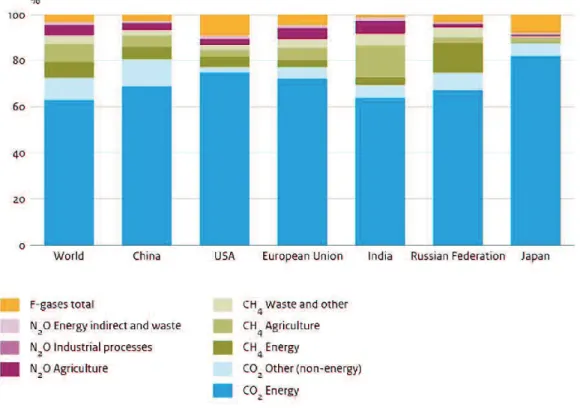
Based on the report of PBL Netherlands Environmental Assessment Agency 2017, in 2016,
among greenhouse gases, CO
2is a major and primary component with the contribution
percentage of 72%. Next percentage is attributed from CH
4(19%), N
2O (6%) and F-gases (3%).
These numbers have been changed for each country but with the highest contribution
percentage, CO
2is always the key factor in the total GHG emissions (Olivier et al., 2017). The
detailed data have been introduced in Figure 2.4.
Figure 2.4 Contribution to 2016 greenhouse gas emissions per emission category (Olivier et
al., 2017).
2.2
Carbon dioxide capture and storage (CCS)
2.2.1 Overview of Carbon capture and Storage
To address problems of climate change and reduce CO
2emissions, solutions are completed
based on three basic options: decreasing energy intensity, decreasing carbon intensity, and
increasing the capture of CO
2(Olajire, 2010). Specifically, various approaches have been
utilization of low carbon fuels; (3) deploy renewable energy; (4) apply geoengineering
approaches; and (5) CO
2capture and storage (Leung et al., 2014).
Figure 2.5 Various carbon capture, storage and utilization selections (Cuéllar-Franca &
Azapagic, 2015).
It can be seen that although the use of energy alternatives such as wind, solar, and nuclear
energy or clean fuels can be considered as green energy, the application of these energies
remain levels of risks and cost and they also cannot satisfy our need of energy. Therefore,
carbon dioxide capture and storage has recently considered as the promising remedy, at least
as the effective short-term solution, to deal with climate change. CCS includes a group of
technologies consisting of CO
2capture, separation, transport, storage, and monitoring (Figure
2.5). In term of CCS, there are two ways to reach the purpose of reducing CO
2emissions. The
first one is accomplished upon the procedure of capturing of CO
2from the industrial sources,
transforming to CO
2pure form and finally pumping to the deep ocean for the long-term storage.
The second approach is to capture CO
2from the environment by improving natural biological
2008). According to technical and economic estimations, CCS could contribute 20% of CO
2emission reduction (Benson & Orr, 2008) and CCS open an optimistic prospect for reducing
CO
2.
2.2.2 Capture technologies
The CO
2capture can be sorted into three options: post conversation capture, pre
conversation capture, and oxy fuel combustion (shown in Figure 2.6). Post combustion
capture is the method in which CO
2was captured from the waste gas stream after the fossil
fuel is burnt. Post combustion technologies is preferred as the most mature and potential
scheme for retrofitting to existing power plants (Leung et al., 2014, Kenarsari et al., 2013,
Romeo et al., 2008, Thiruvenkatachari et al., 2009). Since a CO
2content in the combustion
flue gas is low (i.e. 7 14% for coal-fired and 4% for gas-fired) (Leung et al., 2014) and partial
pressure of CO
2separation, it requires a huge amount of energy and high cost for capturing,
compressing, and enriching concentration of CO
2(>95.5%) to transport and storage. And also,
because the concentration of CO
2in the flue gases emitting from the power plants is low, a
large size equipment and high capital cost are required (Olajire, 2010).
Pre combustion capture applied new gasification technique to produce the easily burnable
gas and then sequester CO
2before burning (Kenarsari et al., 2013). For coal, the gasification
process is carried out in a gasifier with sub-stoichiometric amounts of oxygen at the elevated
pressure of 30
2(Gibbins &
Chalmers, 2008, Leung et al., 2014):
The sync gas after producing is introduced to a catalytic reactor named shift converter , in
which CO creates with water to make CO
2and H
2(Olajire, 2010, Leung et al., 2014):
After that, the produced hydrogen is separated from CO
2and used as fuel. This procedure
can be utilized for Integrated Gasification Combined Cycle (IGCC) power plants using coal
(Leung et al., 2014). With the high concentration of CO
2(20 40%) and high CO
2partial
pressure (about 10 bar) promote the separation easier and more cost-effective (Kenarsari et al.,
2013, Rubin et al., 2012).
For biomass and natural gas, since they contain lots of CH
4, can be reformed to the sync gas
as follow (Leung et al., 2014):
However, the most drawbacks of pre combustion capture are high capital costs (Olajire,
2010) and high costs for the shift reaction (Gibbins & Chalmers, 2008).
Figure 2.6 Carbon capture options (Cuéllar-Franca & Azapagic, 2015).
Oxygen-fuel combustion process actually modified post combustion method which uses
pure O
2, instead of air, to burn fossil fuel. The combustion with O
2will produce the flue gas
with high content of CO
2(80 98% depend on used fuel) (Leung et al., 2014) and free-form
nitrogen, NO and NO
2(Cuéllar-Franca & Azapagic, 2015). The high CO
2concentration of over
high consumption of oxygen, it is expensive or needs to improve the advanced oxygen
separation to reduce the energy and cost requirements.
2.2.3 CO
2separation techniques
Several technologies are existing for separation from the flue gas, including absorption,
adsorption, cryogenics, and membrane as depicted in Figure 2.7. The choice of the appropriate
technology relies strongly on the characteristics or properties of the exhausted gas and plant
(Olajire, 2010).
Figure 2.7 Technology options for CO
2separation (modified from (Olajire, 2010)).
2.2.3.1 Absorption
Absorption has well-established process in use of CO
2capture for at least 60 years. The
selected solvents have to satisfy conditions: a high capacity of CO
2absorption, high absorption
kinetics, negligible vapor pressure, high chemical and thermal stability, and non-hazard
(Ma'mun, 2005). There is two types of absorption: chemical and physical absorption.
Chemical absorption is recommended in use with the low to moderate CO
2partial pressure
(Olajire, 2010). This technique relies on the acid-base neutralization reactions between acidic
CO
2and alkaline solvents (Olajire, 2010). Normally, the flue gas containing CO
2is firstly
absorbent entering from the top of absorber (Mondal et al., 2012, Leung et al., 2014). Next, the
CO
2-rich solvent is fed to regenerator to recover solvent and CO
2through a stripping or
regenerative process by heating and/or depressurization (Mondal et al., 2012, Leung et al.,
2014)
140 °C (Yu et al., 2012). Some of typical chemical absorbents
are monoethanol amine (MEA), diethanol amine (DEA), N-methyldiethanolamine (MDEA),
2-amino 2-methyl 1-propanol (AMP), piperazine (PZ), NaOH, NH
3, K
2CO
3, KOH, Na
2CO
3.
Among these solvents, alkanolamines are extensively applied for CO
2capture. The advantages
include high removal efficiency (more than 90%), quick reaction, and possibly commercialized
application. In contrast, many negatives low CO
2loading capacity, high corrosion rate for
the equipment, the degradation of amine by the presence of SO
2, NO
2, HCl/HF, and O
2in the
flue gas, creation of volatile compounds, and high energy consumption for regenerating exist
when using amine solvent (Leung et al., 2014, Mondal et al., 2012, Olajire, 2010, Nik et al.,
2011). The alternative solvent for amine is ammonia. The aqueous ammonia scrubbing
technology can prevent the capacity, degradation, and corrosion problem. The energy
requirement for regeneration in this method is also lower than amine absorption. Furthermore,
the by-products of this technique are ammonium bicarbonate, ammonium nitrate, ammonium
sulfate which are used as fertilizer (Olajire, 2010).
For physical absorption, CO
2is absorbed in an absorbent under a high pressure and a low
reducing pressure
and enhancing temperature (Yu et al., 2012). Solvents in physical absorption are organic
solvents which can physically absorb CO
2without chemical reactions. In physical absorption
process, CO
2is removed from the inlet gas by the difference between the solubility of CO
2and
partial pressure and the temperature. Therefore, higher CO
2partial pressure and lower
temperature are, higher amount of CO
2molecules absorb in the solvents. Noticeably, because
in physical absorption, it does not happen chemical reaction and the absorption is only physical
interaction between gas and liquid, the interaction between CO
2and the absorbent is weak
which provide circumstances to decrease the energy requirement for regeneration (Olajire,
2010). Selexol process is one of physical absorption technique. The Selexol process uses
dimethylether of polyethylene glycol as absorption solvent at 0 5 °C for selective or
simultaneous removal of CO
2and H
2S (Olajire, 2010). Methanol is a solvent of Rectisol
process. This process is normally carry out at 30 to 100°F and deal with the flue gas
containing sulfur and low quantities of ethane and heavier component (Yu et al., 2012, Weiss,
1988). Fluor process which uses propylen carbonate is favored for the feed gas with CO
2partial
pressure of over 60 psi (Yu et al., 2012). Based on physical absorption, CO
2can be captured
in the system with low energy requirement for regeneration (20% lower than chemical
absorption), low vapor pressure, low toxicity, and low corrosive rate (Songolzadeh et al.,
2014).
2.2.3.2 Water scrubbing
Water scrubbing is classified into physical absorption group where water is used as an
absorbent for dissolving CO
2. This method generally applies in upgrading biogas, landfill, and
natural gas. Biogas, landfill gas and natural gas typically contains CH
4, CO
2, and the trace
amount of H
2S, N
2, H
2O, NH
3and O
2(Andriani et al., 2014, Petersson & Wellinger, 2009).
Upgrading is the process to improve the fuel standard which is in direct proportion to methane
content in such gases when removing unwanted components, especially CO2 and H
2S. Because
H
2S is poisonous and causes corrosion, it needs to pre-separate (Sun et al., 2015). The principle
of water scrubbing process is based on the approximately 25 times lower solubility of methane
in the comparison of CO
2(Bauer et al., 2013).
The biogas containing mostly CH
4and CO
2are compressed and fed into the bottom of a
water scrubber column at high pressure of 1.0 2.0 MPa while high pressure water is added
from the top of the scrubber to attain a gas liquid counter flow (Ryckebosch et al., 2011).
Due to much higher solubility, CO
2dissolves into water while CH
4still remain in gas phase.
However, since CO
2has a low solubility in water, the high pressure of 1.0 2.0 MPa has to
remain in the water scrubbing process to enhance CO
2dissolving rate. Besides, the scrubber
column needs to be equipped with random packing to enlarge the specific surface for gas-liquid
contact (Ryckebosch et al., 2011). Furthermore, the small value of CO
2diffusivity in water
(0.138 cm
2/s) reveals the CO
2