Doctoral Dissertation
Research towards a Principle for the Statistics Curriculum in Japan from the Perspective of Context
HIROTO FUKUDA
Graduate School for International Development and Cooperation Hiroshima University
March 2020
Research towards a Principle for the Statistics Curriculum in Japan from the Perspective of Context
D146383 HIROTO FUKUDA
A Dissertation Submitted to
the Graduate School for International Development and Cooperation of Hiroshima University in Partial Fulfillment
of the Requirement for the Degree of Doctor of Philosophy in Education
March 2020
We hereby recommend that the dissertation by Mr. HIROTO FUKUDA entitled
"Research towards a Principle for the Statistics Cu1Ticulum in Japan from the Perspective of Context" be accepted in partial fulfillment of the requirements for the degree of DOCTOR OF PHILOSOPHY IN EDUCATION.
Committee on Final Examination:
し―
M:!
Hiroshima University和 _
、ク炉~
Maxine Jeanette Pfannkuch, Associate Professor Department of Statistics, Faculty of Science, The University of Auckland, New Zealand
Date: 恥心:1 2tJ I 2._只 0
Approved: '
Baba Tak
▽り
Dean
- --, '
....
虐 界厨戸 `ロ r:· ニ i __ , I I e 笠立—� f. < o .1..0
国桔闘 旦;I
Graduate School for International Development and Cooperation
Hiroshima University
i
Dedication
I extend my humble gratitude to my parents, Hiroaki and Teruyo, for their unconditional love and for always supporting me,
and dedicate this dissertation to them.
ii
Abstract
The world around us is rapidly transforming from determinism to indeterminism (Popper, 1982).
‘Information’ and ‘data’ symbolise the present and future of this society. Thus, the acquisition of statistical literacy is indispensable for students to discern and use essential information and data from the large amounts of information and data that they will encounter in day-to-day life. Under this situation, several studies on method knowledge, which refers to learning how to handle information and data, have been accumulated in statistics education research (e.g., Wild & Pfannkuch, 1999). Nevertheless, some issues remain unresolved in this research field, and highlight two features (‘the purpose is problem solving’ and
‘data are used in inquiry’) related to method knowledge.
Regarding the former (‘the purpose is problem solving’), the current society presents a complexity of information that extends far beyond the simplification or idealisation of problems in the real world (Hirabayashi, 2001). Therefore, it is important to clarify the problem to be solved before undertaking problem solving. A deeper study of the problem is still required, although research has been conducted for the Problem stage in the PPDAC cycle. PPDAC stands for the steps of Problem, Plan, Data, Analysis, and Conclusion (Wild & Pfannkuch, 1999). Regarding the latter (‘data are used in inquiry’), data are certainly necessary in inquiry process. Thus, determining the kind of data to be collected for inquiries has important educational significance. This is the Plan part of the PPDAC cycle. Based on the above, the issues of what is a problem and what kind of data must be collected via statistical inquiry have not been adequately clarified yet. This is the problem statement in this research.
Statistics education deals with this statistical inquiry and thus problem and data. However, statistics education in Japan is currently being planned to shift from content knowledge to method knowledge, but there are no consistent and common principles from elementary education to upper secondary education regarding the problem and data in statistical inquiry. Today, everyone can use the
iii
Internet and obtain a variety of information and data by searching to find out solutions to the problems which they encounter in day-to-day life. Since the problems are always embedded in a certain ‘context’, it is essential to discuss the context to be treated even in statistics education. From these considerations, the objective of this research is to develop a principle for the statistics curriculum in Japan, paying attention to context. To attain the objective, the author formulates the following five research questions (RQs):
RQ1:What is context in statistics education? What is the current status of statistics education research on context?
RQ2:What are the characteristics and issues pertaining to context in current Japanese statistics education?
RQ3:What is the framework to conduct statistical inquiry that takes the context into account?
RQ4:Is the framework developed in RQ3 valid?
RQ5:What is a principle for the statistics curriculum in Japan focusing on context?
For RQ1, context in this research means the concrete situations of problems existing in the real world and is referred as the data-context: the real-world situation from which the problem arose (Pfannkuch, 2011, p. 28). The literature review revealed that statistics education research on context is insufficient and still needs to be studied.
For RQ2, the author conducted the textbook comparison between Japan and New Zealand. This is because the intention of statistics education in New Zealand is to teach and learn method knowledge for statistical inquiry, and this is consistent with the direction required for future statistics education in Japan. The comparison results revealed the characteristic of how context is treated in Japanese statistics education, namely, efforts are made to incorporate context in the problem itself. However, it cannot be said that context is included in the inquiry and answer when posing the problem. Moreover, there is a bias
iv
into types of contexts in Japanese statistics education: sports, weather, and tests. Comparatively, the observation of educational practices in New Zealand revealed that statistics education handles not only data but also contextual thinking. Contextual thinking here refers to emergence of another context when thinking about a specific context. To broaden an idea of contexts and acquire contextual thinking, students must acquire knowledge on various disciplines and use an interdisciplinary approach. This is one of the current issues in statistics education worldwide.
For RQ3, in order to handle these issues, this research established emergent hypothesis modelling as the framework to conduct statistical inquiry that takes the context into account. Emergent hypothesis modelling shows a series of processes, which requires two models: the hypothesis model-for (a hypothetical answer based on students’ anticipation of the question) and the hypothesis model-of (a concrete premise of the problem-solving process based on search). In this modelling, the hypothesis model concretely emerges at the first stage of the statistical inquiry process. The core of emergent hypothesis modelling is the formation of hypotheses through contextual thinking. Therefore, emergent hypothesis modelling constructs the statistical inquiry cycle in the context world.
For RQ4, based on the above considerations, the author developed a teaching unit ‘The Ecology of the Environment and Causal Relationships’. The author then conducted the teaching experiment based on this teaching unit and analysed it from the viewpoint of case study method. The causal inquiry resulted in both the beginnings of statistical literacy at the critical/mathematical level and the refinement of the hypothesis model-of based on the hypothesis model-for by emergent hypothesis modelling. Thus, the author could show empirically that emergent hypothesis modelling is valid.
For RQ5, the author developed a principle in order to not only pay attention to the PP stage but also conduct a survey of that stage within the PPDAC cycle based on the two theories, integrated modelling approach (IMA) (Manor Braham & Ben-Zvi, 2017) and the reasoning with informal statistical models and modelling (RISM) (Dvir & Ben-Zvi, 2018). The shuttling model among the five worlds is
v
Figure. Cyclic shuttling between five worlds in statistical inquiry
proposed as shown in the figure. This model involves the emergent hypothesis modelling cycle, integrates IMA and RISM, and represents the whole statistical inquiry process. This model is common to all types of schools and can function as a normative model for the whole statistical inquiry process. Therefore, this model can serve as a principle for the statistics curriculum in Japan from the viewpoint of context. Finally, the author summarises the principle as the conclusion of this research: Statistical inquiry requires attention to the five worlds (phenomenon, context, data, model, and conjecture worlds) and the interconnections among them.
This research targeted at developing a principle for the statistics curriculum in Japan. The findings are relevant to statistics education in Japan since it seeks to convert the teaching and learning of content knowledge into that of method knowledge. However, this is not only a concern specific to Japan.
Competency-based statistics education is required in all countries (cf. Wild, Pfannkuch, Regan, & Horton, 2011). Thus, the findings are also applicable to some extent to statistics education worldwide. This research can contribute to the positioning and treatment of context in competency-based statistics education as the international standard. These are the significances of this research and its implications for statistics education.
One of the potential research limitations is that although it considered method knowledge in statistics education in detail, the author was unable to take content knowledge into consideration to any
vi
great extent. This requires that the inquiry be conducted using technology based on big data. Since Japanese statistics education in the future will place greater emphasis on inferential statistics, a future statistical inquiry should use big data and technology in an integrated way. Thus, future research can explore how to realise statistical inquiry using big data and ICT (Information and Communication Technology) and thus how to equip teachers with such usage of technology.
vii
Acknowledgements
My doctoral dissertation journey started when I had set foot in Hiroshima in 2008. Back then, I had planned for a four-year stint, but by the time I realised, I had already embarked on a 12-year long journey. Not to exaggerate, I assert that this dissertation is a condensed representation of these 12 years.
Moreover, it is going to be the life and soul of my career as a researcher in the future. The story of an unskilled and inexperienced me eventually becoming a 30-year-old established Hiroto Fukuda after many metamorphoses remains incomplete without remembering the many people to whom I owe so much.
At the centre of these 12 years is my supervisor at Hiroshima University, Dr. Takuya Baba. He welcomed me with open arms as a research student after I completed the master’s program and provided guidance for six years including the time I spent as a research student. Even after I became employed, he always looked after me, advising me not only on the contents of my dissertation but also on the next 40 years of my life as a researcher from various perspectives. In particular, as you may have guessed from the title of my dissertation ‘in Japan’, Dr. Baba taught me the importance of viewing Japan as one country among many others in the world and having the international perspective to be able to look at Japan objectively as a Japanese researcher. I truly appreciate this from the bottom of my heart. Although I still lack in many aspects as a disciple, I hope that I may continue to receive his guidance and encouragement.
Both Dr. Kinya Shimizu and Dr. Takayoshi Maki at Hiroshima University provided invaluable guidance as my deputy supervisors. Dr. Shimizu’s critical teachings from the viewpoint of science education encouraged me to consider deeply the similarities and differences between statistics education, mathematics education, and science education. I have yet to provide a satisfactory result; however, I would like to apply what I have pondered to my future research. Regarding New Zealand as a comparative case in my dissertation, Dr. Maki offered me guidance from the perspective of comparative education and posed the simple, yet crucial question of ‘Why New Zealand?’ Moreover, as a senior researcher, he taught
viii
me about the portrait of a researcher that will be indispensable for our society in the years to come. I express my deepest gratitude.
Even though Dr. Baba remains the focal point of my 12 years, tracing back to the time when Dr.
Baba was not introduced in my life reminds me of a Professor Emeritus at Hiroshima University, Dr.
Hideki Iwasaki, who served as the external examiner. Dr. Iwasaki was my supervisor during my master’s program and an irreplaceable benefactor who provided me with the wonderful opportunity to meet Dr.
Baba. He is my second mentor. I, a mathematics education novice who slows to grow, was guided by him to be able to get a glimpse of the depths of mathematics education as a discipline and become passionate about it. Now, I plan to make mathematics education research my profession. If I recall correctly, Dr.
Iwasaki encouraged me on many occasions to ‘conduct research that is daring and will take roots’, so I hope that this dissertation can be counted as a move towards this challenge. However, I think there is still much to be done, and several challenges still remain. Dr. Iwasaki once told me that ‘a researcher becomes mature on the way towards his or her first work’. This dissertation, therefore, is my first work of a long- term series, and I will orient the remainder of my life towards maturing in this direction. I sincerely thank Dr. Iwasaki for his tutelage.
After Dr. Baba came into my life, it is Dr. Maxine Jeanette Pfannkuch from the University of Auckland in New Zealand, an external examiner, that appeared in my life. While attending the statistics education session at the ICME 13 held in Hamburg, Germany in 2016, I met Dr. Stephanie Clare Budgett from the University of Auckland and Dr. Pip Arnold from the Cognition Education Group, who then introduced Dr. Pfannkuch to me. Furthermore, Dr. Pfannkuch introduced other teachers at a school in New Zealand to me, creating an opportunity that directly influenced this dissertation. Moreover, every time I visited New Zealand, Dr. Pfannkuch provided me with indispensable guidance based on cutting- edge findings in statistics education research. I cannot thank her enough.
Next, if we radially take a look at my past and future with reference to Dr. Baba’s timeline, it is
ix
filled with numerous seniors, juniors, and same cohort colleagues with Hiroshima University at the centre as well as those from across Japan and abroad. Naming all the individuals who have supported me might be time consuming; nevertheless, I extend my gratitude to all who shared their wonderful time with me during my four years at the School of Science, two years at the Graduate School of Education, and six years at the Graduate School for International Development and Cooperation. Your support has been vital in the completion of my dissertation. Thank you very much. I would also like to express my deepest gratitude towards Mr. Yuichi Kamimoto, Mr. Hiroki Otani, Mr. Daiki Urayama, and Mr. Masaaki Ishikawa who reviewed this dissertation in detail and gave me numerous valuable comments despite their busy schedule.
I would also like to take this opportunity to thank my parents and grandparents who have always supported me. I sincerely thank you and look forward to your continuous support.
Last but not least, including my intent to cautioning myself, I would like to close this acknowledgement with the words of Dr. Chikara Sasaki, a historian of science who earned his degree with the study of Descartes’s mathematical thought, uttered to Mr. Tatsuo Yamauchi, a painter, as a reaction to his work ‘Cloud - Aloofness’: “Dear Yamauchi, I suggest you stop creating paintings that sell. I suggest you determine that sympathising with merchants is a corruption. I suggest you continue to stick only to the combination of shapes and colours that express the intrinsic beauty that satisfies you. I suggest you continue to maintain time of serenity to paint extraordinary work. I suggest you continue to reject words of appraisal with poor standards. While you are alive, I suggest you believe in only the high quality words of understanding from a few people. I suggest you believe in your high standards of beauty, keep practicing to elevate this standard even more, show only the paintings that make sense to you, and only to those who can understand. Then, … I suggest you continue to paint high standard works that exceed the standard like ‘Cloud – Aloofness’. I suggest you aim for heights without compromise. I suggest you continue to create unapproachable beauty” (Sasaki, 2018, p. 294; translated by the author).
xi
Table of Contents
Dedication ··· i
Abstract ··· ii
Acknowledgements ··· vii
Table of Contents ··· xi
List of Figures ··· xiv
List of Tables ··· xvii
Chapter 1. Introduction ··· 1
1.1 Background ··· 1
1.2 Historical transition of statistics education in Japan ··· 2
1.3 From determinism to indeterminism ··· 7
1.4 Problem statement ··· 9
1.5 Research objective ··· 15
1.6 Rationales for the research ··· 16
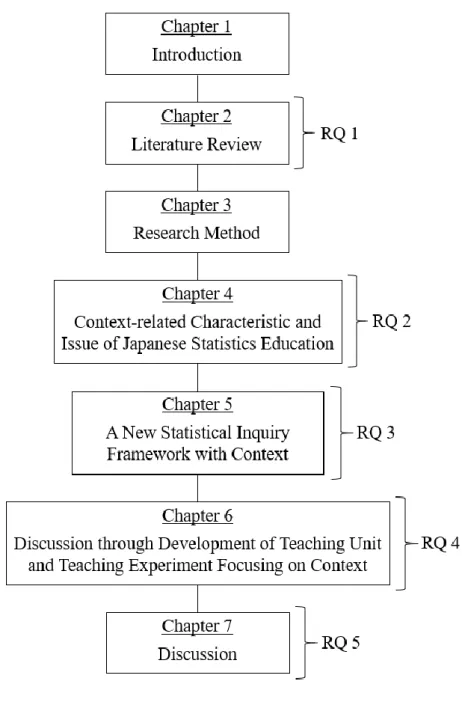
1.7 Structure of the research ··· 19
Chapter 2. Literature Review ··· 26
2.1 The meaning of the term ‘context’ ··· 26
2.2 Statistics education research on context ··· 29
Chapter 3. Research Method ··· 39
3.1 Comparative study with statistics education in New Zealand ··· 39
3.2 Reflection of previous studies on statistical inquiry with context ··· 44
3.3 Teaching unit and teaching experiment focusing on context ··· 44
3.4 Summary of the research method ··· 50
xii
Chapter 4. Context-related Characteristic and Issue
of Japanese Statistics Education ··· 51
4.1 Textbook comparison between Japan and New Zealand from the perspective of context ··· 51
4.1.1 Method ··· 51
4.1.2 Quantitative analysis ··· 53
4.1.3 Case analysis ··· 58
4.2 Educational practices in New Zealand ··· 64
4.2.1 Basic information ··· 64
4.2.2 Lesson analysis through episodes ··· 65
4.3 Chapter summary ··· 68
Chapter 5. A New Statistical Inquiry Framework with Context ··· 70
5.1 Backwards emergent modelling ··· 70
5.2 Emergent hypothesis modelling ··· 78
Chapter 6. Discussion through Development of Teaching Unit and Teaching Experiment Focusing on Context ··· 87
6.1 Development of teaching unit ··· 87
6.1.1 Focus on causal inquiry ··· 87
6.1.2 Focus on environmental problems ··· 92
6.1.3 Teaching Unit ‘The Ecology of the Environment and Causal Relationships’ ··· 95
6.2 Teaching experiment of the developed unit ··· 99
6.2.1 Basic information ··· 99
6.2.2 Perspectives of analysis ··· 102
6.2.3 Analysis of teaching experiment from the perspective of ‘causal inquiry’ ··· 103 6.2.4 Analysis of teaching experiment from the perspective of
xiii
‘emergent hypothesis modelling’ ··· 106
6.2.5 Analysis of teaching experiment from the perspective of ‘the renewal of one’s own Umwelt through the dialogue with others’ Umwelts’ ··· 108
6.3 Findings of the teaching experiment to improve the teaching unit ··· 109
6.4 Chapter summary ··· 117
Chapter 7. Discussion ··· 120
7.1 A Principle for the statistics curriculum in Japan from the perspective of context··· 120
7.2 Significance of the research and implications for statistics education ··· 127
7.3 Limitations of the research ··· 129
7.4 Future directions of research ··· 130
Publications associated with this research ··· 135
Appendix A: The New Zealand Curriculum and the Teaching Content of ‘Mathematics and Statistics’ ··· 137
Appendix B: Lesson Plan for 6 Hours of Teaching Experiment ··· 148
Appendix C: Transcript of Teaching Experiment ··· 162
References ··· 193
xiv
List of Figures
Figure 1-1. Organization of the school system in Japan ··· 2
Figure 1-2. The mathematisation cycle ··· 10
Figure 1-3. The investigative cycle ··· 11
Figure 1-4. Components of data modelling ··· 12
Figure 1-5. Bidirectional modelling diagram of model-based informal inference ··· 12
Figure 1-6. The core and the areas related to mathematics education, their links to the related disciplines and the fields of application ··· 17
Figure 1-7. Structure of this study ··· 20
Figure 1-8. Progressive mathematisation ··· 21
Figure 1-9. A framework for thinking about statistical inference ··· 22
Figure 2-1. A 4-dimensional framework for statistical thinking in empirical enquiry ··· 32
Figure 2-2. Interplay between context and statistics ··· 33
Figure 2-3. Distillation and encapsulation ··· 36
Figure 3-1. Years and curriculum levels ··· 40
Figure 3-2. The change in the teaching weight of areas in ‘Mathematics and Statistics’ ··· 41
Figure 3-3. Teaching unit on ‘Arithmogons’ ··· 47
Figure 3-4. Shuttling between theory and practice ··· 49
Figure 4-1. A screen shot of time series graph Student A made ··· 66
Figure 4-2. A screen shot of Student A’s search 1 ··· 67
Figure 4-3. A screen shot of Student A’s search 2 ··· 67
Figure 5-1. Levels of the activity ··· 73
xv
Figure 5-2. Application of formal mathematics ··· 76
Figure 5-3. Realistic problem solving ··· 76
Figure 5-4. Vertical mathematisation ··· 77
Figure 5-5. Reinvention ··· 78
Figure 5-6. The rationale of the integrated modeling approach (IMA) ··· 79
Figure 5-7. The integrated modeling approach (IMA) learning process ··· 81
Figure 5-8. The model comparisons framework description of the informal statistical modeling process ··· 81
Figure 5-9. RISM framework··· 83
Figure 5-10. Statistical inquiry cycle through emergent hypothesis modelling ··· 85
Figure 5-11. The RISM snapshot of an informal statistical modeling process ··· 86
Figure 6-1. An example of a cause and effect diagram ··· 91
Figure 6-2. Dynamics of ecological crisis ··· 94
Figure 6-3. The graph used in Group A’s presentation in the 3rd lesson ··· 104
Figure 6-4. The graph used in Group D’s presentation in the 3rd lesson ··· 107
Figure 6-5. The cause and effect diagram finally created by student Sachi ··· 108
Figure 6-6. Galton board ··· 111
Figure 6-7. Pinball board ··· 113
Figure 6-8. Probability for dropping balls in each divider after falling from the centre of the pinball board ··· 114
Figure 6-9. The situation of Problem ④ in the Teaching Unit ‘Pinball Board’ ··· 115
Figure 6-10. The situation of Problem ⑤ in the Teaching Unit ‘Pinball Board’ ··· 116
Figure 6-11. The situation of Problem ⑥ in the Teaching Unit ‘Pinball Board’ ··· 117
Figure 7-1. Statistical inquiry cycle through emergent hypothesis modelling (Reprint) ··· 121
xvi
Figure 7-2. RISM framework (Reprint) ··· 122
Figure 7-3. The rationale of the integrated modeling approach (IMA) (Reprint) ··· 123
Figure 7-4. Cyclic shuttling between five worlds in statistical inquiry ··· 124
Figure 7-5. The graph used in Group D’s presentation in the 3rd lesson (Reprint) ··· 126
Figure 7-6. Interrelated big ideas underlying statistics in the classroom ··· 131
Figure 7-7. The core and the areas related to mathematics education, their links to the related disciplines and the fields of application (Reprint) ··· 132
Figure A-1. The school system chart in New Zealand ··· 137
Figure A-2. Overview of a schematic view of curriculum in New Zealand ··· 138
xvii
List of Tables
Table 1-1. Educational content of statistics education in the Japanese courses of study ··· 4-5
Table 1-2. The differences between statistics and mathematics ··· 23
Table 3-1. Statistical literacy construct ··· 48
Table 4-1. The result of classification of problems by context ··· 57
Table 4-2. The result of classification of the contexts within the problems ··· 58 Table 6-1. Outline of development of the teaching experiment ··· 101-102
1
Chapter 1. Introduction
1.1 Background
Recently, the system of the world has been rapidly transformed from determinism to indeterminism (Popper, 1982). This is a paradigm shift in human history, and if there were a book called
‘human history’, the historical impact of this change would be such as to form a main part of the tale.
Such a critical situation does not only affect a particular area, but unavoidably affects a wide swath of our world. The field of education is no exception. Thus, the main issue of this research is to implement this paradigm shift in education and to examine how education will be pursued from now on.
Every person in this world without exception passes through a period as a student. Even at this one point, the importance of education can never be reduced; it can only be increased. Moreover, character development is the greatest mission of education, so teaching literacy to enable students to survive in their society, become capable of transforming the society, and move with the times is also a task which only education can fulfil. Therefore, education can be said to be a fundamental factor which is indispensable for guiding students to adulthood.
In addition, people around the world have benefitted from innovations in information communication technologies such as personal computers. In our current society, a second world consisting of information, the Internet, has been born. The world of the Internet is completely different from the physical world. There are various physical limitations in the real world that are not present in this second world, which is growing without limit. As we live in the 21st century, we have to know how to survive in such an information-rich society. It can also be easily imagined that when our present students become adults they will be even more information-oriented. Therefore, ‘information’ and ‘data’ symbolise this society, including its future, and statistical literacy is indispensable because through it they can judge and
2
use essential information and data correctly from the large amounts of information and data that they will encounter throughout their lives.
1.2 Historical transition of statistics education in Japan
Here, the author briefly summarises the history of statistics education in Japan and clarifies its features. At first, the current education system in Japan is briefly described. Japan has a 6-3-3 system, with 6 years for elementary education, 3 years for lower secondary education, and 3 years for upper secondary education; compulsory education includes elementary education and lower secondary education, nine years in total. More details are shown in Figure 1-1
Figure 1-1. Organization of the school system in Japan
(Ministry of Education, Culture, Sports, Science and Technology (MEXT), n.d.)
3
Education in Japan aims to fully develop the individuals as defined in the Basic Act on Education. This entails the acquisition of many kinds of skills necessary to survive in society, which is in line with the global trend, such as literacy concepts whose origins are the liberal arts (e.g., Higuchi, 2010;
Sato, 2001, 2003) and competency concepts as current literacy (e.g., Ishii, 2015; Matsushita, 2010;
Organisation for Economic Co-operation and Development (OECD), 2000, 2019; Rychen & Salganik, 2001, 2003). These are also intended to inculcate the skills essential for people to participate fully in society. The Japanese enrolment rate in compulsory and upper secondary education has been almost 100%
in recent years. Since almost all students receive education for 12 years from elementary school to upper secondary school, the Education for All has already been implemented. Thus, the educational content and teaching method implemented by each school should not differ, and standard education should be conducted at any school in Japan. This is why education is carried out based on a course of study wherein the educational content and teaching method in each school type and grade are specified. The preparation for the course of study was carried out only after the war. After the defeat of Japan in World War II, the United States Education Mission to Japan and the Civil Information and Educational Section (CI & E) of the General Headquarters of the Supreme Commander for the Allied Powers (GHQ / SCAP), conducted teaching for introducing educational reform in Japan (Ohya, 2002). After that, the Constitution of Japan was promulgated and the Basic Act on Education and the School Education Act, which constitute the basis of modern education in Japan, were enacted, and the course of study was based on the ‘Course of Study’ in the United States (Shinno, 2010; Ueda, 2010).
In Japan, statistics education is positioned as one area of mathematics education. It has also been conducted mostly based on the contents in the course of study. There is a detailed explanation that clarifies statistics education as a part of mathematics education. Table 1-1 summarises the educational content of statistics education for each grade, starting from elementary to upper secondary, in the past courses of study and those that are to be implemented, henceforth. Table 1-1 covers nine periods of time
4 when the course of study changed.
Table 1-1. Educational content of statistics education in the Japanese courses of study (This is in addition to Ninomiya (2004) and Otani (2018). Translated by the author)
5
Lower secondary school
Lower secondary school
Lower secondary school
Upper secondary school
Upper secondary school
Upper secondary school
6
No major differences appeared from the 1st period to 6th period. Descriptive statistics, such as data shown in graphs and tables, is mainly taught from elementary education to the first half of lower secondary education, and inferential statistics, such as inferences from sample surveys, is mainly taught from the second half of lower secondary education to upper secondary education. A major change in statistics education in Japan occurred in the 7th period. In lower secondary education, statistics education was not a part of the curriculum. It appears that statistics education was implemented in upper secondary education in the 7th period. However, in upper secondary education before the 7th period, statistics education was positioned as a course of study, but in fact, was hardly put into practice. Therefore, it is only in elementary years that statistics education was implemented in the 7th period. In the course of study in the 8th period, another major change occurred. First, there was a return of statistics education, which was left out of lower secondary education in the 7th period; however, this was restored in the 6th period. Second, statistics education was positioned in ‘Mathematics I’, which is compulsory for upper secondary education. As a result, statistics education in upper secondary education, which thus far has been positioned only in the intended curriculum (courses of study) and has hardly been implemented, also functioned as the implemented curriculum. Further reforms are made in the course of study to be carried out in the 9th period. The key educational contents in statistics education in the course of study up to the 8th period are the different concepts (content knowledge) involved in inquiring statistically. On the other hand, the key educational content in the course of study in the 9th period does not only include content knowledge. For example, ‘to consider the process and conclusion of problem solving (multidirectionally / critically)’ in elementary education, ‘to consider the method and result of sample survey critically’ in lower secondary education, and ‘to collect and analyse multiple types of data according to the purpose’
in upper secondary education are also positioned as educational contents. In other words, statistical methods (method knowledge) such as utilising formed statistical concepts (content knowledge) and judging what kinds of statistical concepts (content knowledge) should be utilised in a certain statistical
7
inquiry activity are also included as educational contents. In the 9th period, statistics education is included in all grades from elementary education to upper secondary education, which recognises as the increasing importance of statistics education within mathematics education.
As described above, there had been almost no major changes in the teaching contents even if the course of study had been revised. However, there were changes in the educational contents and their sequence in the very recent revision of the courses of study. It may also be seen that the importance of statistics education within mathematics education is increasing.
1.3 From determinism to indeterminism
In the previous section, the author mentioned that statistics education in Japan now takes a high position in mathematics education, but the reason was not clarified. The author thus considers this reason while providing an overview of changes from the perspective of statistics based on the studies of Ian Hacking, a Canadian philosopher of science.
After studying mathematics and physics, Hacking earned a Ph.D. in philosophy and wrote on the question, ‘Why have language and mathematics become the problem in philosophy?’ (Hacking, 1975, 2014) and ‘How are statistics and probability related to the society for development?’ (Hacking, 1990, 2006). While the former is a fully philosophical study of linguistics and mathematics, the latter is a study of probability and statistics, with respect to society. In other words, it can be said that his interest lay in exploring the connection between philosophy and society from both directions. More precisely, it would be better to regard the society mentioned here as humans, because it is only human beings who have developed society thus far, and he shows how probability and statistics were born and related to society in certain aspects as it developed. It is may be speculated that he focuses on probability and statistics because they emerge from society, and at the same time they influence the society and have brought about a paradigm shift in the view of science.
8
The following is a detailed explanation of what must be described here to summarise the contents of Hacking (1990). As a conventional view of science, it was thought that the proposition that all phenomena and events could be explained by some law was indisputable. Kant, Descartes, and Laplace also believed that this proposition was true. Laplace in particular, the founder of classical probability theory, made a clear reference to that point at the beginning of Laplace (1902): “All events, even those which on account of their insignificance do not seem to follow the great laws of nature, are a result of it just as necessarily as the revolutions of the sun” (p. 3). When stated this way, no famous scholars had any doubt of its validity, and this idea took root as a kind of common sense within society. Under such circumstances, it was Charles Sanders Peirce who denied this proposition forthrightly and all alone. Peirce, the famous scholar of semiotics, was the pioneer of indeterminism. Peirce (1892) stated that “I propose here to examine the common belief that every single fact in the universe is precisely determined by law”
(p. 321), which he called ‘the doctrine of necessity’. At this moment, indeterminism was born, which takes ‘the doctrine of necessity’ as false as the result of his critique of the determinism based on this proposition.
The rule of Napoleon from 1820 to 1840 relates to the background of the replacement of determinism by indeterminism (Hacking called this ‘erosion of determinism’). Napoleon established institutions to collect data to provide information precisely describing the state of national power in several respects, including the Statistics Bureau as a national institution to support the compilation of data.
It was considered that from the large amount of data compiled by the Statistics Bureau, it would be possible to infer rules which could not be possible from single data points. Therefore, the Statistics Bureau became an organisation which not only collected but also analysed data. Then, after Napoleon’s downfall, a large amount of data made by the Statistical Bureau and probabilistic inferences from them were spread all over the world, including more importantly the concomitant statistical know-how (Hacking called this
‘an avalanche of printed numbers’). Poisson’s publication of the law of large numbers in 1837 may not
9
be irrelevant. In the analysis of the copious data compiled by the Statistics Bureau, including the law of large numbers, a single data point cannot be an object of statistical analysis, rather a large amount of data is assumed. One cannot make a definite inference from a single data but can make a probabilistic inference using a large amount of data. Therefore, it can be said that at this stage, the ‘erosion of determinism’ was progressing, and determinism was being implicitly replaced by indeterminism (Hacking called this ‘the taming of chance’) until it was finally announced in Peirce (1892).
For the last 130 years since Peirce suggested a clear position within epistemology for chance, probability, and contingency, research on indeterminism has been conducted. For example, Monod (1972) (the French edition was written in 1970) discusses chance and necessity from the viewpoint of biology and the theory of evolution, Popper (1982) explains the protection of indeterminism and the lack of indeterminism, and Sober (2008) reports the relationship between three kinds of statistical philosophies, Bayesianism, likelihoodism, and frequentism, based on the theory of evolution. Research on indeterminism has recently gotten underway in Japan. For example, Miyakawa (2017) and Takeuchi (2018) considered the process of the acceptance of disciplinary statistics into Japan and the social and historical thought of disciplinary statistics.
As mentioned above, it can be said that statistics education has gained a high position in Japanese mathematics education because of the sea changes in the view of statistics and the immense social influence of statistics. In the next section, issues in this research will be clarified in view of this background.
1.4 Problem statement
The paradigm shift from determinism, which has dominated the society for a long time, to indeterminism has a great impact on the real world. Thus, today we see one personal computer per family and one mobile phone per person. Everyone carries around a large amount of information and data on his
10
or her shoulder. Therefore, it is important to consider how education addresses the needs of the current age, particularly how statistics education handles information and data.
Methods of handling information and data are strongly related to mathematical modelling.
According to OECD (2003), the mathematisation cycle is shown as Figure 1-2. This mathematisation cycle is based on Freudenthal’s view of mathematics as an activity (cf. Freudenthal, 1968, 1973, 1991;
Gravemeijer, 1997; van den Heuvel-Panhuizen, 2003) and progressive mathematisation consisting of horizontal mathematisation and vertical mathematisation (cf. Treffers, 1978).1 The important point in this mathematisation cycle is that it starts from problems and situations in the real world, and problem solving is then conducted after formularisation into the world of mathematics, but these processes can be
Figure 1-2. The mathematisation cycle (OECD, 2003, p. 38)
11
summarised as the modelling of reality. Thus, the mathematisation cycle can be a process of mathematical modelling. In particular, statistics education contains many elements of modelling. An example of this is the statistical investigative cycle (PPDAC cycle) (Figure 1-3), consisting of the steps of Problem, Plan, Data, Analysis, and Conclusion, as shown by Wild and Pfannkuch (1999).
Figure 1-3. The investigative cycle (Wild & Pfannkuch, 1999, p. 226)
This model of statistical investigation is the result of an examination of the inquiry process of statisticians through interviews and the modelling of aspects in the complex inquiry. It is the repetition of a process of clarifying what the problem is, planning to solve the problem, collecting and analysing data, drawing a conclusion to the problem, and clarifying a new problem to improve the conclusion. Therefore, this PPDAC cycle can also be considered as the statistical modelling of the real world.
Since the beginning of the 21st century, a large number of studies has accumulated findings on data modelling, model-based statistical inference focusing on modelling, and Informal Inferential Reasoning (IIR). For example, components of data modelling in Lehrer and Schauble (2004), such as
12
posing questions, sampling data, and making inferences, are shown as Figure 1-4 from Lehrer and English (2018), and model-based statistical inference by the interaction between data and models in statistical inquiry process is sketched out as in Prodromou (2017) in Figure 1-5.
Figure 1-4. Components of data modelling (Lehrer & English, 2018, p. 232)
Figure 1-5. Bidirectional modelling diagram of model-based informal inference (Prodromou, 2017, p. 142)
13
In current statistics education research, the teaching is intended to focus more on the methods than on the contents of statistics by making students reason informally about statistics instead of teaching formal statistics in a formal way. Informal Statistical Inference (ISI) and Informal Inferential Reasoning (IIR) are proposed based on Tukey’s (1977) Exploratory Data Analysis (EDA), which regarded statistics not as mathematics but as data analysis.2 Makar and Rubin (2018) reviewed ISI and IIR, as defined by researchers in various ways, and found five points of commonality: Claim beyond the data, expressed with uncertainty, use of data as evidence, consideration of the aggregate, and integration of context knowledge (pp. 273–275).
In this way, many studies whose intention is to acquire method knowledge to learn how to handle information and data have been accumulated in statistics education research. For example, statistics is described as a methodological discipline and science dealing with data and uncertainty in Moore (1990) and Cobb and Moore (1997). What is common to varied method knowledge in statistics education (statistical inquiry cycle, data modelling, model-based statistical inference, ISI, IIR, and so on) is that ‘the purpose is problem solving’ and that ‘data are used in inquiry’. As for ‘the purpose is problem solving’, for example, in data modelling and model-based statistical inference, the goal is to refine the model by repeating the modelling cycle. The model refinement here implies refining the solution for the original problem, so that the purpose of solving the problem is fulfilled. Regarding the point that a new problem is clarified by interpreting and evaluating the results and conclusions of the analysis, it is a problem whose solution still requires them to solve the original problem. Thus, it is a problem posing within the problem-solving process. As for the point that ‘data are used in inquiry’, this is characterised by inferring population characteristics from sample data and using statistical values or probabilities as evidence for inferences about the population. Therefore, data with numbers are always used in this inquiry.
In summary, this is may be interpreted as indicating that statistics education research so far continues to discuss the ‘method knowledge of inquiry using data for problem solving’.
14
The statistics curriculum in Japan will also be carried out in this direction in the future as the author explained in Section 1.2. As mentioned above, a salient characteristic of the statistics curriculum in the 9th period is the teaching and learning of statistical method knowledge to apply the formed statistical content knowledge and to judge what kind of statistical content knowledge should be used in a certain statistical inquiry activity. For example, in elementary education it is intended to introduce the PPDAC cycle explicitly, and in secondary education it is intended to treat the methods of the problem- solving process. In statistics education in Japan henceforth, the results of statistics education research thus far are to be reflected in the curriculum and incorporated into educational practices.
Nevertheless, there are issues that must be addressed in statistics education research. They underlie two features (‘the purpose is problem solving’ and ‘data are used in inquiry’) related to the method knowledge that are claimed and implemented in statistics education. It is closely related to the indeterminism mentioned above. Regarding the former, current society comprises a complex network of knowledge and information, and it presents a complexity of knowledge and information far beyond the simplification or idealisation of problems in the real world (Hirabayashi, 2001). Therefore, it is important to clarify the problem to be solved before undertaking problem solving. That is, although the research has been conducted for the Posing Question stage in data modelling or model-based statistical inference and the Problem stage in the PPDAC cycle, the accumulation of research is not sufficient.
For the latter, it is needless to say that inquiries based on data are necessary, but as with the former, there are too many variables in current society, which is too complicated for such an approach.
Thus, inquiries into the kind of data to be collected itself has educational significance. In other words, inquiring at this stage does not necessarily require data. This is the Plan part of the PPDAC cycle. Thus, research focusing on the part where students do not use data in their inquiries is necessary.
From the above, we may see that the issues of what is a problem and what kind of data is necessary in statistical inquiry or statistical inference are not as sufficiently targeted for research as they
15
are for the subsequent problem-solving situation. This is the problem statement in this research.
1.5 Research objective
In our excessively complex society that is facing an indeterministic world, defining problems and determining necessary data are important processes in which students do not necessarily use data.
Instead, the investigator’s own experience or common sense are used. Today, we are in an age when everyone can use the Internet, so we can obtain a variety of information by searching, and such information can also be a tool of inquiry. In such a situation, it is ‘context’ that is the key word for the problem statement. Since statistics has always developed within a context, it can be said that statistical inquiry also changes if the context changes. Therefore, it is essential to discuss the context to be treated even in statistics education.
According to Moore (1990), “data are not merely numbers, but numbers with a context” (p. 96), but this suggests that statistics education, which is a part of mathematics education in Japan, has different characteristics from mathematics education. Moore means that the object of mathematics is numbers, while the object of statistics is data. In this regard, Shaughnessy (2007) stated that “statistics is fraught with contextual issues, which is the nature of the discipline, whereas often mathematics strips off the context in order to abstract and generalize” (p. 1002). While mathematics aims at de-contextualisation, statistics cannot be separated from context and is context-dependent. From the above, the nature of mathematics education is different from statistics education. In statistics education, context is not data itself but an important element existing in the background of the data.
Additionally, statistics education in Japan is being planned to shift from content knowledge to method knowledge, but there are no consistent and common principles from elementary education to upper secondary education for what is a problem and what data are necessary in statistical inquiry.
Therefore, principles about context are indispensable for the statistics curriculum. In this research, the
16
objective is to develop a principle for the statistics curriculum in Japan, paying attention to context. To attain the objective, the author sets up the following five research questions (RQ):
RQ1:What is context in statistics education? What is the current status of statistics education research on context?
RQ2:What are the characteristics and issues pertaining to context in current Japanese statistics education?
RQ3:What is the framework to conduct statistical inquiry that takes the context into account?
RQ4:Is the framework developed in RQ3 valid?
RQ5:What is a principle for the statistics curriculum in Japan focusing on context?
1.6 Rationales for the research
The position of this research is explained by mathematics education as design science by Wittmann (1995). His view of mathematics is summarised as MATHEMATICS, regarding which he stated,
“I suggest a use of capital letters to describe MATHEMATICS as mathematical work in the broadest sense; this includes mathematics developed and used in science, engineering, economics, computer science, statistics, industry, commerce, crafts, art, daily life, and so forth according to the customs and requirements specific to these contexts” (ibid., p. 359). Regarding mathematics education based on this view of mathematics, his statement that “they must see school mathematics as an extension of pre- mathematical human capabilities which develop within the broader societal context provided by MATHEMATICS” (ibid., p. 359) suggests that mathematics education is established in relation to the human activities that have created mathematics and the social infrastructure upon which mathematics has been constructed. In addition, he also referred to mathematics education as a discipline as follows:
“mathematics educators need a lively interaction with MATHEMATICS and they must devote an essential part of their professional life to stimulating, observing and analysing genuine MATHEMATICAL
17
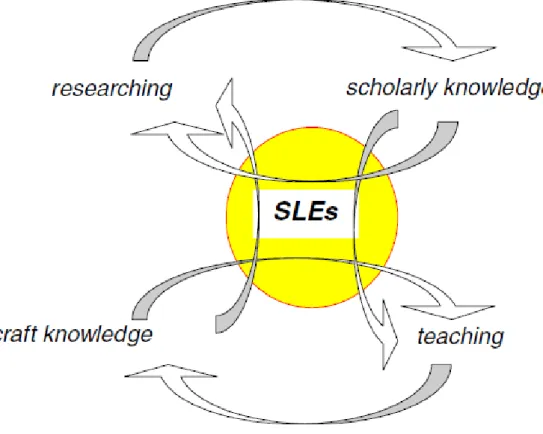
activities of children, students and student teachers” (ibid., p. 359). Figure 1-6 shows the related areas of mathematics education and the core of mathematics education, that is, the identity of mathematics education.
Figure 1-6. The core and the areas related to mathematics education, their links to the related disciplines and the fields of application (Wittmann, 1995, p. 357) 3
It can be seen from the relationships with various related areas and related disciplines that the emphasis is placed in the end on the suggestions of the need for ‘teacher education’ and ‘practice’. The core of mathematics education as design science consists of the following eight components (ibid., pp.
356-357).
1. analysis of mathematical activity and of mathematical ways of thinking, 2. development of local theories,
3. exploration of possible contents that focus on making them accessible to learners,
4. critical examination and justification of contents in view of the general goals of mathematics teaching,
18
5. research into the pre-requisites of learning and into the teaching/learning processes,
6. development and evaluation of substantial teaching units4, classes of teaching units and curricula, 7. development of methods for planning, teaching, observing, and analysing lessons, and
8. inclusion of the history of mathematics education.
This means that mathematics education researchers must take this core as the object of their research. That is, the rationale of research must be discussed in relation to these cores.
The author considers this research in terms of these points. As mentioned above, mathematics is oriented toward de-contextualisation, while statistics is context-dependent, so they have different properties (Shaughnessy, 2007). However, mathematics education has to take current society into consideration, and the current trend is a transformation from determinism to indeterminism as described in Section 1.3 because mathematics education is a social-cultural practice (cf. Abe, 2010; Iwasaki, 2007).
When we entered a highly information-oriented society and put data into a previously deterministic world, the role of chance appeared and determinism was eroded, so indeterminism can be said a fusion of determinism and chance. The ‘reading, writing, and arithmetic’ as literacy which has been required so far are equivalent to ‘input, output, and processing’ of information from the viewpoint of the highly information-oriented society (Iwasaki, 2007; Iwasaki, Nakamura, & Baba, 1999; Otani, 2018).
‘Arithmetic’ as the role of mathematics is replaced with ‘processing’, which means that statistics plays a significant role in ‘processing.’ Otani (2018) states “we cannot simply think that statistics is mathematics, and we cannot conclude that statistics is not mathematics at all” (p. 74; translated by the author)5. However, given these changes with the era, such as from determinism to indeterminism, from arithmetic to processing, or from traditional mathematics to MATHEMATICS, statistics in statistics education is clearly located in MATHEMATICS as a form of mathematical work in the broadest sense. In other words, statistics education is positioned in mathematics education whose view of mathematics is
19
MATHEMATICS, which is a position that this research takes.
In addition, with regard to the eight components forming the core of mathematics education, the objective of this research is to develop a principle for the Japanese statistics curriculum from the perspective of context. Therefore, this research deals predominantly with Component 6. At the same time, this research considers statistical inquiry and statistical inference (Component 1), aims to develop a local theory of the context for which sufficient accumulation has not been made in statistics education research (Component 2), and considers the types of context when referring to concrete teaching and learning processes (Components 3 and 5). However, this research does not deal with Component 4, 7, and 8. Finally, this research conducts educational practices in such a way that all the previous discussions are reflected.
From the above, this research can serve as the core of mathematics education in Figure 1-6. Furthermore, mathematics education research in Japan based on the core of mathematics education has been accumulating (e.g., Iwasaki, 2007; Otaki, 2014; Otani, 2018; Suginomoto, 2015). In this way, the rationale of this research is also shown as a discipline of mathematics education.
1.7 Structure of the research
This section presents the overall structure of this study. In Chapter 2, the author analyses the term ‘context’, which is key to this research, through a literature review, then investigates quantitatively or through literature review how much context-related research exists in statistics education research thus far and what research has been conducted. Therefore, this chapter seeks to answer Research Question 1.
Next, Chapter 3 focuses on Japan and presents a method for analysing the role of context in current statistics education and identifying issues in statistics education related to context, then shows the methodology necessary for developing the principle for the statistics curriculum. That is, the research method is explained. These involve a literature review, and then Chapter 4 and Chapter 6 apply the method.
In Chapter 4, quantitative comparative research and qualitative analytical research are conducted to
20
answer Research Question 2. Based on these results, a new framework of statistical inquiry with context is established in Chapter 5 (Research Question 3), and in Chapter 6, the statistics curriculum is developed based on the methodology designed in Chapter 3 and the teaching experiment is conducted to validate the framework (Research Question 4). This is conducted through a literature review and qualitative research.
This result is interpreted in Chapter 7, whereupon the author aims to propose a principle for a future statistics curriculum in Japan from the perspective of context, and answers Research Question 5.
In summary, the structure of this research is shown in Figure 1-7.
Figure 1-7. Structure of this study
21
Notes
1. Freudenthal suggests the significance of mathematisation: “What humans have to learn is not mathematics as a closed system, but rather as an activity, the process of mathematizing reality and if possible, even that of mathematizing mathematics” (Freudenthal, 1968, p. 7). In addition, Treffers describes the method of mathematisation based on the view of mathematisation of Freudenthal as follows: “The attempt to schematise the problem mathematically is indicated by the term ‘horizontal’
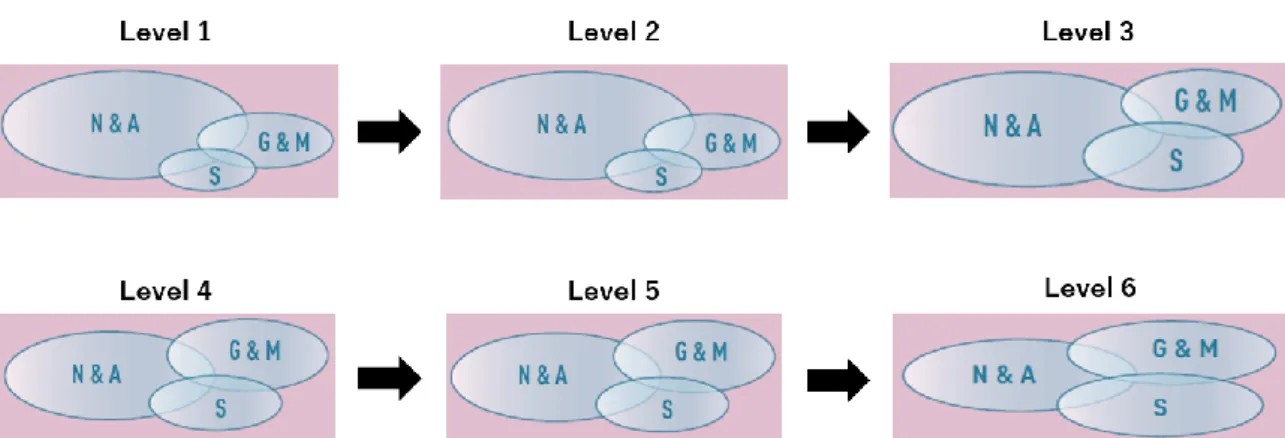
mathematisation. … The activities that follow and that are related to the mathematical process, the solution of the problem, the generalisation of the solution and the further formalisation, can be described as ‘vertical’ mathematisation.” (Treffers, 1978, p. 71). It may be seen in Figure 1-8 that these two types of mathematisation are not independent but interact with each other, and the way of progress of mathematisation and the way the level rises are by steps and not linear.
Figure 1-8. Progressive mathematisation (Treffers, 1978, p. 248)
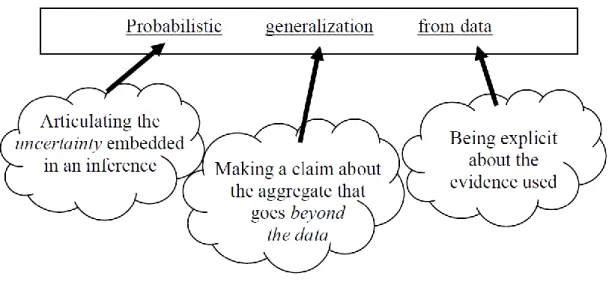
2. Three key principles of ISI are defined, for example, by Makar and Rubin (2009) as follows: (1) generalization, including predictions, parameter estimates, and conclusions, that extend beyond describing the given data; (2) the use of data as evidence for those generalizations; and (3) employment of probabilistic language in describing the generalization, including informal reference
22
to levels of certainty about the conclusions drawn (p. 85). Additionally, ISI is defined as probabilistic generalisation from data as shown in Figure 1-9.
Figure 1-9. A framework for thinking about statistical inference (Makar & Rubin, 2009, p. 85)
Moreover, Pfannkuch (2007) defines informal reasoning as “the drawing of conclusions from data that is based mainly on looking at, comparing, and reasoning from distributions of data”
(p. 149). Similarly, in Zieffler, Garfield, delMas, and Reading (2008), IIR is used to refer to “the way in which students use their informal statistical knowledge to make arguments to support inferences about unknown populations based on observed samples” (p. 44) and in Ben-Zvi, Gil, and Apel (2007),
“the cognitive activities involved in informally drawing conclusions or making predictions about
‘some wider universe’ from patterns, representations, statistical measures and statistical models of random samples, while attending to the strength and limitations of the sampling and the drawn inferences” (p. 2). In addition, the difference between ISI and IIR is described such that ISI is not intended for formal statistical procedures, while IIR is intended to formalise ISI (Manor Braham &
Ben-Zvi, 2017).
3. Regarding the core and related areas of mathematics education, Dr. Wittmann was invited to give a
23
plenary lecture on ‘Mathematics Education as Systemic-evolutionary Design Science: Revisiting’ at the 45th Meeting of the Japan Academic Society of Mathematics Education on 29 January 2017 (Sun).
Here, the author would like to note that he used the related areas on the left side of Figure 1-6 with the addition of ‘semiotics’ in his plenary lecture. Please see the details in Wittmann (2019).
4. See Chapter 3 for more information on teaching unit.
5. Otani (2018) summarised the differences between statistics and mathematics based on the previous research as shown in Table 1-2:
Table 1-2. The differences between statistics and mathematics (Otani, 2018, p. 74; translated by the author)
Mathematics Statistics
Nature
Structure-oriented and Application-oriented
Application-oriented
Object
Object of Inquiry
Number & Quantity, Shape
& Space, Change &
Relationship, and Data &
Certainty
Data & Certainty
Phenomenon
Deterministic Events and Indeterministic Events
Indeterministic Events
Data
De-contextualised Numerical Values
Data with Context
Method
Problem Solving Mathematical Modelling Statistical Inquiry Cycle
Justification Demonstration Argumentation
24
Here, the difference between statistics and mathematics as a discipline is described, but several previous studies regarding mathematics education and statistics education has been referenced. Thus, it can be interpreted that Table 1-2 shows the difference between statistics education and mathematics education. Iwasaki (2007) proposed “ ‘Object – Method’ as the rule of didactical construction and
‘Practice – Theory’ as the law of didactical formation [in didactics of mathematics]” (p. 35; the parenthesis is by the author) with reference to Bigalke (1972, 1974). According to the rule ‘Object – Method’, both object and method in Table 1-2 are essential to construct mathematics education and statistics education. Thus, the similarity and difference between them can be confirmed. In particular, the major differences are data as object and the method of justification. About data as object, statistics education treats data with context while mathematics education treats de-contextualised numerical values. In addition, the method of justification in statistics education is argumentation to aim at persuasive claims while the method in mathematics education is demonstration following the deductive reasoning (Otani, 2018, pp. 73-74).
OECD (2016) defines and explains scientific literacy that is addressed in science education as the following (p. 20):
Scientific literacy is the ability to engage with science-related issues, and with the ideas of science, as a reflective citizen. A scientifically literate person is willing to engage in reasoned discourse about science and technology, which requires the competencies to:
・Explain phenomena scientifically - recognise, offer, and evaluate explanations for a range of natural and technological phenomena.
・Evaluate and design scientific enquiry - describe and appraise scientific investigations and propose ways of addressing questions scientifically.
・Interpret data and evidence scientifically - analyse and evaluate data, claims, and arguments in a variety of representations and draw appropriate scientific conclusions.
25
Additionally, there are three types of knowledge treated in scientific literacy as follows (p. 19):
・Content knowledge - knowledge of the content of science
・Procedural knowledge - knowledge of the procedures that scientists use to establish scientific knowledge
・Epistemic knowledge - an understanding of the role of specific constructs and defining features essential to the process of knowledge-building in science
Because statistics has a methodological nature, procedural knowledge and epistemic knowledge as the objects in science education are the objects in statistics education in a broad sense, and statistical inquiry cycle and argumentation as the methods in statistics education are the methods in science education (Otani, 2018, p. 81). In this way, there are many similarities between statistics education and science education. However, they are also different in terms of content knowledge which is the object in science education. Otani (2018) states the difference clearly: “In scientific literacy [science education], the inquiring object of natural science and knowledge peculiar to natural science are within content knowledge. Content knowledge is knowledge related to natural scientific phenomena such as chemical change or motion, so this viewpoint is treated as the variable for statistical literacy [statistics education]. In other words, content knowledge is related to natural science in the case that statistics is applied to the context of natural science, but needed knowledge is different in the case that statistics is applied to the context of social science.” (p. 81; translated by the author; the parentheses are by the author). While content knowledge in science education is related to natural science, content knowledge in statistics education is related to data and certainty with its context in indeterministic events (Table 1-2). Therefore, content knowledge as the object in statistics education and content knowledge as the object in science education are different.
26
Chapter 2. Literature Review
In this chapter, the author defines ‘context’, which is polysemous, and summarises the roles of context in statistics education through reviewing previous studies in this field. These form the foundations of this research.
2.1 The meaning of the term ‘context’
In this section, the meaning of ‘context’ was discussed as the key word in this study. For example, common meanings of context are “the situation within something exists or happens, and that can help explain it” or “the text of speech that comes immediately before and after a particular phrase or piece of text and helps to explain its meaning” (Cambridge Dictionary, n.d.-a). The latter has a linguistic meaning referring to the relationship between pieces of text or between text and a phrase, so the former is related to this research. The meaning of the former is in line with the view of context espoused by Ichiei Hirabayashi, who obtained the first Ph.D. in mathematics education in Japan. Kanemoto (2012) states as follows: “I [Dr. Hirabayashi] think that context is ... an oriented situation or a direction of thinking.
Furthermore, I can explain that the situation is a place where problems arise and a stage where their thinking begins when I am asked what the situation is” (p. 75; translated by the author; the parenthesis is by the author). With respect to this oriented situation, van den Heuvel-Panhuizen (2005) classifies it into two types (p. 2):
1. a characteristic of a task presented to the students
: referring either to the words and pictures that help the students to understand the task, or concerning the situation or event in which the task is situated. The description of a context comes close to the interpretation of a context as a task characteristic.