令和元年度博士学位論文
Studies on Geranylgeranoic Acid Biosynthesized in Mammals.
D3217003
Yuki Tabata 田端 佑規
2019 年 12 月
長崎県立大学大学院
人間健康科学研究科 栄養科学専攻
専攻分野 細胞生化学
指導教員 四童子 好廣 印
Chapter 1. General Introduction ... 1
1.1 Isoprenoids ... 2
1.2 Mevalonate pathway biosynthesizes isoprenoids ... 2
1.3 Acyclic retinoids ... 8
1.4 Geranylgeranoic acid (GGA) ... 9
Aims of the study ... 11
Chapter 2. Hepatic monoamine oxidase B is involved in endogenous geranylgeranoic acid synthesis in mammalian cells ... 12
Abstract ... 13
2-1. Introduction ... 14
2-2. Endogenous GGA in rat tissues ... 17
2-3. Endogenous 2,3-dihydroGGA in rat tissues. ... 18
2-4. Inhibition of biosynthesis of cellular GGA by tranylcypromine (TCP) ... 24
2-5. Downregulation of cellular GGA by MAOB siRNA ... 26
2-6. Catalytic activity of recombinant human MAOB in oxidation of GGOH to GGal ... 30
2-7. MAOB gene knockout by CRISPR-Cas9/HDR system and the resultant cellular endogenous GGA changes. ... 33
2-8. Back-transfection of the MAOB gene into MAOB knockout cells restores the MAOB dependence of intracellular GGA. ... 38
2-9. Discussion ... 40
Chapter 3. Supplementation with geranylgeranoic acid during mating, pregnancy and lactation improves reproduction index in C3H/HeN mice ... 45
Abstract ... 46
3-1. Introduction ... 47
3-2. GGA-induced improvement of RI in C3H/HeN mice ... 49
3-3. Timing effects of GGA supplementation on the RI ... 54
3-4. Discussion ... 55
Chapter 4. Unequivocal evidence for endogenous geranylgeranoic acid biosynthesized from mevalonate in mammalian cells ... 59
Abstract ... 60
4-1. Introduction ... 61
4-2. Changes in endogenous GGA levels when pravastatin and/or ZAA treatment of HuH-7 cells. .. 62
4-3. ZAA induced upregulation of GGA and cell death in HuH-7 cells ... 62
4-4. Metabolic labeling of GGA using 13C-MVL in human hepatoma HuH-7 cells ... 67
4-5. ISA with 13C-MVL in HuH-7 cells ... 69
4-6. 2,3-DihydroGGA as a metabolite of GGA ... 73
4-7. Discussion ... 76
Chapter 5. General Discussion ... 81
Chapter 6. Materials and Methods ... 88
Materials ... 89
Methods ... 91
7. Acknowledgments ... 105
8. References ... 106
List of abbreviations
ADH alcohol dehydrogenase
ARA arachidonic acid
CRIPR-Cas9 Clustered Regularly Interspaced Short Palindromic Repeats CRISPR-Associated proteins 9
CYP cytochromes P450
DMAPP dimethylallyl diphosphate
DMEM Dulbecco’s modified Eagle medium ESI electrospray ionization
FAD flavin adenine dinucleotide
FBS fetal bovine serum
FOH farnesol
FPP farnesyl diphosphate
Fal farnesal
GGA geranylgeranoic acid GGOH geranylgeraniol
GGPP geranylgeranyl diphosphate
Gal geranylgeranial
GGal geranylgeranial
GOH geraniol
GPP geranyl diphosphate
Gal geranial
HDR homology directed repair
HMG-CoA 3-hydroxy-3-methylglutaryl-CoA IPP isopentenyl diphosphate
ISA Isotopomer Spectral Analysis
LC/MS(/MS) liquid chromatography mass spectrometry
MAO monoamine oxidase
MRM multiple-reaction-monitoring
MVA mevalonate
MVL mevalonolactone
NAD+ nicotinamide adenine dinucleotide
PBS (-) Dulbecco’s Phosphate Buffered Saline, without calcium chloride and magnesium chloride PCYOX prenylcysteine oxidase
RAR retinoic acid receptor
RI reproduction index
ROR retinoic acid receptor-related orphan receptors RXR retinoid-X-receptor
SAM senescence-accelerated mouse TCP tranylcypromine hydrochloride
WR weanling rate
ZAA zaragozic acid A/squalestatin 1 siRNA small interfering RNA
1
Chapter 1. General Introduction
2 1.1 Isoprenoids
Isoprenoids form the most diverse and abundant group of organic compounds in nature (1). They are derived from branched C5 isoprene units. The number of repetitions of this motif, cyclization reactions, rearrangements and oxidation of the carbon skeleton are responsible for the enormous structural diversity.
Many types of isoprenoids are essential components of the cellular machinery that are found in all organisms.
The isoprenoids participate in a variety of biological processes: 1) as electron carriers, ubiquinone is essentially required for the mitochondrial respiratory chain (2); 2) as components of membranes, hopanoids and steroids are found in eubacteria and eukaryotes, respectively; 3) as a donor for prenylated proteins, farnesyl diphosphate (FPP: C15) and geranylgeranyl diphosphate (GGPP: C20) are involved in isoprenylation of small G-proteins such as Ras and Rho (3); 4) as oligosaccharide carriers, phosphorylated and diphosphorylated dolichols participate in N-linked protein glycosylation (4); 5) as fat-soluble vitamins, many plant-produced isoprenoids are essential nutrients in human diet; and 6) as chemotherapeutic agents, diterpenoid paclitaxel has been widely utilized for therapy of many clinical cancers (5).
1.2 Mevalonate pathway biosynthesizes isoprenoids
Isoprenoids vary greatly in size but are all synthesized ubiquitously among eubacteria, archaebacteria and eukaryotes through condensations of the five-carbon isopentenyl diphosphate (IPP: C5) and dimethylallyl diphosphate (DMAPP: C5). In mammals, IPP can be synthesized from the mevalonate (MVA) pathway. In 1958, Bloch’s group first described the mevalonate pathway in yeasts (6). This pathway starts with a production of acetoacetyl-CoA (C4) from two molecules of acetyl-CoA (C2) in a reaction catalyzed by thiolase. Next, 3- hydroxy-3-methylglutaryl-CoA (HMG-CoA: C6) is synthesized from acetyl-CoA and acetoacetyl-CoA by being condensed by the catalytic reaction of the HMG-CoA synthase. HMG-CoA produces mevalonate (MVA:
C6) by HMG-CoA reductase that is a rate-limiting enzyme in this pathway. MVA is sequentially phosphorylated by MVA kinase and MVA-5-phosphate (MVAP: C6) kinase to form MVA-5-diphosphate
3
(MVAPP: C6). This diphosphate is then decarboxylated by MVAPP decarboxylase to IPP, which is further converted to DMAPP by IPP isomerase. After this isomerization reaction, geranyl diphosphate (GPP: C10) and FPP are sequentially synthesized through a head-to-tail consecutive addition of IPP by FPP synthase (Fig.
1-1).
4 Figure 1-1: Mevalonate pathway: from Acetyl-CoA to FPP.
The details are described in the text.
H3C O
CH3 CH3
P O
OH
O
CH3 CH3
H3C CH3
O P O
OH OH
P O
OH O P
O OH OH
H3C O
CH3 CH3
P O
OH
O
CH3 CH3
H3C CH3
O P O
OH OH
P O
OH O P
O OH OH
GPP
FPP
H2C O P O
OH O
P OH
OH O CH3
HO OH
O H3C OH
HO O
O H3C OH
P O P OH
OH
O O
OH
HO O
O H3C OH
P OH
OH O
HO OH
O H3C OH
HO O
O H3C OH
P O P OH
OH
O O
OH
HO O
O H3C OH
P OH
OH O
Acetyl-CoA Acetoacetyl-CoA
MVA
MVAP
MVAPP
IPP DMAPP
H3C O P OH
OH O O H3C OH
H3C O P O
OH O O H3C OH
P OH
OH O
H3C O PH O
OH OH
PH OH OH OH CH3
H3C O P O
OH O
P OH
OH O CH3
HO OH
O H3C OH
HO O
O H3C OH
P O P OH
OH
O O
OH
HO O
O H3C OH
P OH
OH O
HMG-CoA
Figure 1-1: Mevalonate pathway: from Acetyl-CoA to FPP.
5
Metabolic pathway after FPP is divided into two major pathways, steroidogenesis and non-steroidogenesis pathways. The main metabolic pathway from FPP is steroidogenesis. At the first step of steroidogenesis pathway, squalene is synthesized through a tail-to-tail addition of 2 molecules of FPP by squalene synthase as shown below. Squalene is a vital material for the synthesis of cholesterol, steroid hormones, cell membrane maintenance, cell growth, differentiation, and vitamin D in the human body (Fig. 1-2). Another pathway is non-steroidogenesis. In this pathway, GGPP synthase produces GGPP by prenyl transfer reaction from IPP to FPP. From the bottom of Fig. 1-1, a metabolic fate of FPP in non-steroidogenesis is further branched into two major pathways. One is ubiquinone synthesis from all-trans GGPP, which is generated from FPP by trans- prenyltransferase interacting with FPP synthase (Fig. 1-3). In plants all-trans GGPP is a precursor of phytoene (C40), which is a founder of carotenoids (C40) and phytoene is synthesized by condensation of two all-trans GGPP molecules in a tail-to-tail manner (7). Another branching pathway is dolichol synthesis from 2-cis GGPP, which is generated from FPP by cis-prenyltransferase interacting with FPP synthase (Fig. 1-3). All of the above-mentioned metabolites from the MVA pathway are the substrates for biosynthesis of all isoprenoid metabolites including monoterpenes or di-isoprenoids, sesquiterpenes or tri-isoprenoids, diterpenes or tetra- isoprenoids, triterpenes or sterols, ubiquinones, dolichols or polyprenoids, and prenylated proteins. The enzymes of the MVA pathway have been studied from a great number of organisms including humans. It has been well known that inhibition of this pathway is already applied in the treatment of cardiovascular disease, hypercholesterolemia and metabolic bone disease and it could be a possible new therapy in cancer treatment (8–11). For example, HMG-CoA reductase, the best-characterized and rate-limiting enzyme in the pathway, is a target of the statin class of cholesterol-lowering drugs (12), the treatment of cardiovascular disease, and inflammatory processes (13). Several biologically active isoprenoids are found also in insects and plants (14, 15). As mentioned above, many plant-produced isoprenoids such as fat-soluble vitamins (retinoids, vitamin D, tocopherol, and vitamin K) are essential nutrients in human diets.
6 Figure 1-2: Biosynthetic pathway from FPP to Cholesterol.
The details are described in the text.
Cholesterol
H3C
CH3
CH3 CH3 CH3
CH3 CH3
CH3
H3C
CH3 CH3
CH3 CH3
H H
H H
HO
H3C O
CH3 CH3
P O
OH
O
CH3 CH3
H3C CH3
O P O
OH OH
P O
OH O P
O OH
FPP OH
H3C O
CH3 CH3
P O
OH
O
CH3 CH3
H3C CH3
O P O
OH OH
P O
OH O P
O OH
FPP OH
Squalene
H3C
CH3
CH3 CH3 CH3
CH3 CH3
CH3
H3C
CH3 CH3
CH3
CH3
H H
H H
HO
Vitamin D
Steroid hormone Cell membrane Bile acid
7 Figure 1-3: From FPP to GGPP and its metabolites.
The details are described in the text.
H3C O
CH3 CH3
P O
OH
O
CH3 CH3
H3C CH3
O P
O OH OH
P O
OH
O P
O OH OH H3C
O CH3
CH3
P O
OH
O CH3
CH3 H3C
CH3
O P
O
OH OH
P O
OH
O P
O
OH OH
3 H
C
O
3 CH
3 CH
P O
OH
O
3 CH
3 CH
3 H
C
3 CH
P O
O
OH OH
P O
OH
P O
O
OH OH
8 1.3 Acyclic retinoids
Retinoids including all-trans retinoic acid, 9-cis retinoic acid and other synthetic retinoic acid derivatives are clinically utilized as chemotherapeutic agents for acute promyelocytic leukemia, but their side effects are sometimes so serious that it becomes difficult to continue administration of the retinoids (16). To solve the problem, acyclic retinoid has been developed as analogues of retinoids in Japan. The clinical efficacy of a chemically synthesized 20-carbon acyclic retinoid (all-trans 3,7,11,15-tetramethyl-2,4,6,10,14- hexadecapentanoic acid, 4,5-didehydrogeranylgeranoic acid or a generic name of peretinoin, Fig. 1-4) on prevention of second primary hepatoma has been proven in a placebo-controlled, double-blinded and randomized phase III clinical trial with postoperative hepatoma patients with few side effects (17).
Figure 1-4 Chemical structure of 4,5-didehydrogeranygeranoic acid
And later it was revealed that peretinoin significantly increased a 5-year survival rate after a radical therapy of primary hepatoma in these patients, in comparison with placebo control (18, 19). It has been also shown that the acyclic retinoid binds to cellular retinoic acid binding protein (CRABP) as well as to nuclear retinoid receptors, exerts transcriptional activation of some hepatocyte-specific genes in hepatoma cells, and has preventive actions in chemical and spontaneous hepato-carcinogenesis (20–23). In this context, this group of compound was named "acyclic retinoid" (19). However, there was a big difference in cell death-inducing activity between acyclic retinoids and natural retinoids such as retinoic acid. In other words, acyclic retinoids efficiently induced cell death in HuH-7 cells, but 5-fold more all-trans retinoic acid did not (24). So, "acyclic retinoid" was thought to have non-retinoidal function besides the retinoidal function. Hence, I paid attention to a chemical structure of geranylgeranoic acid (GGA), which is a 4,5-dihydro derivative of peretinoin (Fig.
1-5).
H3C
CH3 CH3 CH3 CH3 O
OH
9 1.4 Geranylgeranoic acid (GGA)
Geranylgeranoic acid (all-trans 3,7,11,15-tetramethyl-2,6,10,14-hexadecatetraenoic acid or GGA) is a compound that is chemically categorized as isoprenoids, consisting of 4-isoprene units linked in a tail-to- head manner (Fig. 1-5). GGA has a carboxyl group at its tail terminus and has been developed as one of preventive agents against second primary hepatoma. As for the molecular and cellular mechanisms of GGA- induced cell death, several studies have so far been conducted.
Figure 1-5 Chemical structure of geranygeranoic acid
The following are descriptions of cellular and molecular events relating to GGA-induced human hepatoma cell death in chronological order. The earliest is cytoplasmic splicing of X-box binding protein 1 (XBP1) mRNA, a canonical marker for unfolded protein response (UPR), observed 5 min after adding GGA in culture medium (25), overproduction of superoxide in mitochondria and conversion from LC3-I to LC3-II, a marker for initial autophagic response, can be detected after 15 min (26), and after 30 min, GFP-LC3 granules, a marker for autophagosome, appear (26) and cyclin D1 protein, which is involved in the G1/S checkpoint, disappears (27). Two hours after adding GGA, the XBP1s protein is detected in the nucleus (25), the cellular level of phosphorylated p53 at Ser10 is increased (28) and the membrane potential of mitochondria (DYm) is lost (29). Nuclear translocation of the cytoplasmic p53 is induced with a 3-h treatment with GGA (28). The cell death is finally detectable 6–8 h after adding GGA (30). Recently, it has reported that GGA at micromolar concentrations upregulated the cellular protein levels of TP53-induced glycolysis and apoptosis regulator (TIGAR) and synthesis of cytochrome c oxidase 2 (SCO2) without their transcriptional upregulation and consequently induced a metabolic shift from aerobic glycolysis to mitochondrial respiration, as revealed by metabolomics analysis in 2 h(31). This metabolic shift from glycolysis to aerobic respiration is crucial for
10
cancer chemoprevention in terms of preventing the Warburg effect, a cancer-specific energy metabolism. In guinea pig fibroblast-derived cell lines, GGA induced a transient increase of mitochondrial superoxide production in 15 min and dissipation of DYm in 2 h, and cell death became evident in 6 h (32).
GGA has the same physiological activity and characteristics as peretinoin. However, GGA, unlike peretinoin, has been reported to be a natural compound present in some medicinal herbs used in traditional medicine, Kampo and Āyurveda, as well as ordinary herbs (turmeric, basil, rosehip, cinnamon, and so on), indicating that GGA is one of acyclic diterpenoids (33).
11 Aims of the study
A major aim of my thesis is to unequivocally prove that GGA, a hepatocarcinogenesis inhibitory compound, is biosynthesized in not only plants but also mammalian cells. Therefore, in Chapter 2, I investigated the enzyme involved in the oxidation of GGOH to GGal, the precursor metabolite of GGA, in human hepatoma-derived cells. In chapter 3, I examined biological activities other than the carcinogenesis- preventive effects of GGA, especially the improvement of mouse reproductive function. In chapter 4, I provide unequivocal evidence for endogenous geranylgeranoic acid biosynthesized from mevalonate in mammalian cells.
I sincerely hope that my doctoral dissertation will be the basis for cancer prevention strategies and other bioactivity studies using endogenous bioactive metabolites such as GGA.
12
Chapter 2. Hepatic monoamine oxidase B is involved in endogenous
geranylgeranoic acid synthesis in mammalian cells
13 Abstract
Geranylgeranoic acid (GGA) has been reported to induce autophagic cell death via upregulation of lipid-induced unfolded protein response in several human hepatoma-derived cell lines, and its 4,5-didehydro derivative has been developed as a preventive agent against second primary hepatoma in clinical trials.
Previously, it was reported that GGA is a natural diterpenoid synthesized in several medicinal herbs. On the other hand, it is not clear whether GGA is biosynthesized in mammalian cells. Several cell-free experiments have demonstrated that GGA is synthesized through GGal by oxidation of GGOH with concomitant molecular oxygen consumption. Here, first of all, I show with normal male Wistar rats, the endogenous GGA content in liver were found to be far greater than those in other organs analyzed. Next, in a culture-system of a couple of human hepatoma cell lines, I analyzed possible contribution of monoamine oxidase B (MAOB), which was previously shown to be involved in the oxidation of GGOH by using either HuH-7 cell lysates or recombinant human MAOB. Tranylcypromine, an MAO inhibitor, induced dose-dependent downregulation of endogenous GGA content in HuH-7 cells. Moreover, MAOB small interfering RNA (siRNA) treatment reduced the amount of intracellular GGA in HuH-7 and Hep3B cells. In addition, MAOB-knockout human hepatoma Hep3B cell (MAOB-KO) was established using the Clustered Regularly Interspaced Short Palindromic Repeats CRISPR- Associated proteins 9/homology directed repair (CRISPR-Cas9/HDR) system, but, unexpectedly, I failed to detect any difference in the cellular GGA content between MAOB-KO and MAOB wild-type cells. However, loss of MAOB-siRNA sensitivity of MAOB-KO cells was recovered by the transfection of the KO cells with the MAOB-expression plasmid, suggesting that some other latent metabolic pathways may be evoked to maintain the cellular endogenous GGA levels in MAOB-KO hepatoma cells.
Taken together with the previous findings, the results presented in this chapter strongly suggest that hepatic MAOB is involved in synthesis of endogenous GGA through oxidation of GGOH and I provide new insights into biological role(s) of hepatic MAOB.
14 2-1. Introduction
Geranylgeranoic acid (all-trans 3,7,11,15-tetramethyl-2,6,10,14-hexadecatetraenoic acid or GGA) GGA and its didehydro derivative were demonstrated to be potent ligands for nuclear retinoid receptors (21) so that these isoprenoid compounds have been developed as the preventive agents against second primary hepatoma (17, 18). In the past, it has been reported that GGA is a natural compound present in some medicinal herbs (33).
In mammalian cells, GGA is presumed to be biosynthesized from GGPP, a metabolite derived from the MVA pathway. A previous studies have reported that GGPP is converted to geranylgeraniol (GGOH) by geranylgeranyl pyrophosphatase (GGPPase), the most active at physiologic pH and highly specific for GGPP, in rat liver homogenates (34). GGOH produced by GGPPase had been thought to be oxidized to geranylgeranial (GGal) by cytosolic alcohol dehydrogenase (ADH) in the presence of nicotinamide adenine dinucleotide (NAD+
)
(35) and then GGal had been supposed to be further oxidized to GGA by non-specific aldehyde dehydrogenase (35). Indeed, it has confirmed that enzymatic conversion from GGal to GGA is highly dependent on the exogenous NAD+ in rat liver homogenates (36) and human hepatoma-derived HuH-7 cell lysates (37). However, it found that a putative enzyme in either rat liver or HuH-7 cells involved in the oxidation of GGOH to GGal did not require any exogenous NAD+ in the cell-free system (36, 37). Taking account that the mitochondrial enzyme was sensitive to tranylcypromine (TCP), an inhibitor against monoamine oxidases (37), I have reasonably speculated that a certain member of monoamine oxidase family might be involved in GGOH oxidation to GGal in the process of GGA biosynthesis (36, 37). There so far have been the following three lines of evidence for monoamine oxidase B (MAOB) as GGOH-oxidizing enzyme;1) HuH-7 cell lysate or rat liver homogenate enzyme does not require the exogenous NAD+ to produce GGal, 2) molecular oxygen solubilized in the reaction medium is consumed upon addition of GGOH into HuH-7 cell lysates as enzyme source, and 3) the recombinant human MAOB protein is active to oxidize GGOH to GGal (37).
15
MAOB, one of the flavin enzymes, located to the outer mitochondrial membrane, generally degrades phenylethylamine and dopamine in the central nervous system (38). When these substrates are oxidized by MAOB, molecular oxygen is consumed and reactive oxygen species such as hydrogen peroxide are generated.
Therefore, an increase in the expression level of MAOB in the brain is expected to damage the nervous system due to the reactive oxygen species produced (39). In fact, the expression of MAOB has increased in Alzheimer's disease and Parkinson's disease (40, 41), and MAOB inhibitors have been investigated as treatments for these diseases (42, 43). In contrast to the diverse MAOB studies in the nervous system, the physiological role of MAOB in the liver is hardly clearly defined despite the tissue levels of MAOB mRNA expression are not only higher than those in the central nervous system, but also highest among all human organs (44). At present, the liver MAOB enzyme is considered to contribute to the decomposition of xenobiotics, because the liver is one of the major organs that contribute to drug metabolism and MAOB shows relatively broad substrate specificity for aromatic amines (45). In this context, the physiological substrate of liver MAOB has not yet been clearly elucidated. Therefore, if I can show that GGOH is one of the endogenous substrates of hepatic MAOB, as mentioned earlier, I will add a new perspective on the physiological role of hepatic MAOB.
In the first part of this chapter, I demonstrate that endogenous GGA exists in several organs of male rats using liquid chromatography mass spectrometry (LC/MS/MS). The second part of this chapter, by using MAO inhibitors and siRNAs to inhibit and downregulate the cellular MAOB enzyme activity, I demonstrate hepatic MAOB is involved in the maintenance of intracellular GGA content in human hepatoma-derived cells. Then, to ensure that MAOB is involved in GGA biosynthesis more reliably, I performed knockout of the MAOB gene using the CRISPR-Cas9 plasmids in human hepatoma cells, but unexpectedly, the intracellular GGA content of MAOB-knockout (KO) cells was almost the same as that of wild type cells. However, when the MAOB-KO cells were back-transfected with MAOB expression plasmid, MAOB siRNA-mediated downregulation of endogenous GGA level was recovered. In other words, when MAOB is expressed normally in human
16
hepatocytes, the intracellular level of GGA is dependent on MAOB activity. The possibility that enzymes other than MAOB in MAOB-KO cells are involved in maintaining intracellular GGA content is also described.
17 2-2. Endogenous GGA in rat tissues
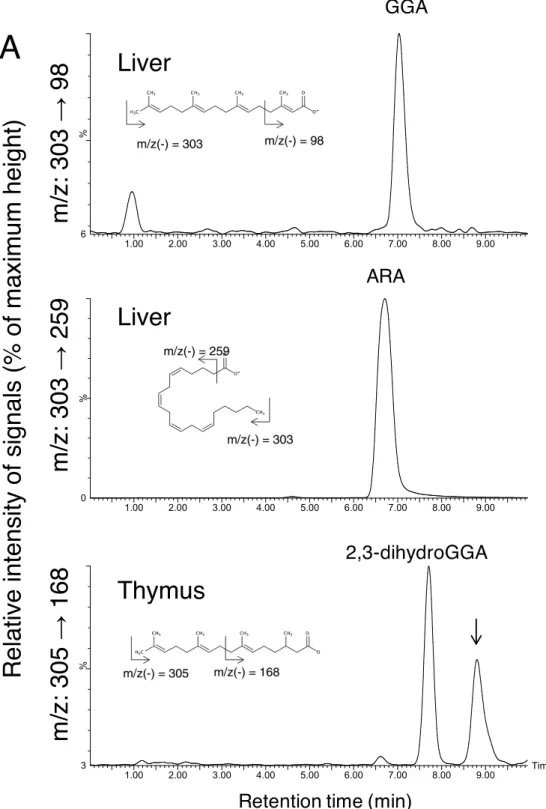
Because it has already reported that endogenous free GGA was identified in the human liver cancer- derived cell line, HuH-7, and blood serum of healthy volunteers using LC/MS, I attempted to detect and quantify endogenous free GGA in each tissue of male Wistar rats. First, I decided to demonstrate endogenous free GGA in livers as compared with free arachidonic acid (ARA), a structural isomer of GGA using LC/MS/MS, which allowed me to separately quantitate GGA and ARA in a single run. As a result, multiple- reaction-monitoring (MRM) tracings of each compound in the liver extract clearly indicated the natural existence of free GGA in the liver, as shown in Fig. 2-1A. Because the standard curves of GGA and ARA were linear (r2 = 0.99 for both), at least in the range shown in supplemental Fig. 2-2, GGA and ARA in each organ of the rat were quantified. Whereas all tissues tested contained endogenous free GGA measured using LC/MS/MS, the hepatic free GGA content was exceptionally high, followed by the reproductive organs, such as prostate and testis, and neuronal tissues of cerebrum and cerebellum (Fig. 2-1B, Table 2-1). Blood serum and epididymal adipose tissue contained only a few free GGA. A tissue distribution of free ARA was in the range of previous reports (46, 47), so the molar ratio of free GGA to free ARA was also highest in the liver (Fig. 2-3A).
Although the epididymis, another reproductive organ, was not listed in supplemental Table 2-1, the tissue concentrations of GGA in each part of the epididymis were calibrated as 28.82 ± 2.13 pmol/g in the caput (n
= 5), 8.75 ± 3.07 pmol/g in the cauda (n = 5), and 5.96 ± 1.13 pmol/g in the corpus (n = 5). The epididymal caput was, second to the liver, a tissue with a high GGA concentration.
18 2-3. Endogenous 2,3-dihydroGGA in rat tissues.
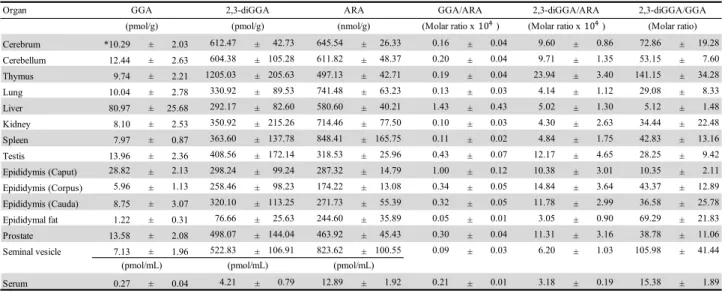
Because Sagami’s group (48) reported that rat thymocytes produce 2,3-dihydroGGA from GGal or GGOH through GGA and Dulaney’s group (49, 50) found 2,3-dihydroGGA with phytanic acid in the serum and urine of patients with Refsum disease, I also tried to detect and quantify endogenous 2,3-dihydroGGA in male Wistar rat tissues using an MRM mode of LC/MS/MS (Fig. 2-1C, Fig. 2-2). Unlike the tissue distribution of GGA, the 2,3-dihydroGGA content was highest in thymocytes. Furthermore, the hepatic 2,3-dihydroGGA content was the second lowest value after epididymal fat, excluding serum (Fig. 2-1C). When a molar ratio of 2,3-dihydroGGA to GGA in each organ was calculated, it was highest in the thymus (141.2 ± 34.3), second highest in the seminal vesicle (106.0 ± 41.4), and lowest in liver (5.1 ± 1.5); in other organs, it was in the range of 30-75, excluding serum (15.4 ± 1.9), as shown in Fig. 2-1D and Table 2-1.
19
Figure 2-1. Tissue distribution of endogenous free GGA, ARA, and 2,3-dihydroGGA in male Wistar rats measured using reverse phase LC/MS/MS analysis.
(A). Representative chromatograms of the rat hepatic lipid extract tracing GGA (m/z: 303 → 98) and arachidonic acid (m/z: 303 → 259), and of the rat thymus lipid extract tracing 2,3-dihydroGGA (m/z: 305 →168). Down arrow represents elution times of di-homo-g-linolenic acid. Tissue distribution of endogenous GGA (B) and 2,3-dihydroGGA (C) in male Wistar rat and a molar ratio of 2,3-dihydroGGA to GGA in each tissue (D) are shown in a bar graph. All bars represent the mean ± SE (n = 5). (B) ***: p<0.001 vs each other organs, (C) ***: p<0.001 vs serum and epididymal fat and, *:
p<0.05 vs each organ other than serum and epididymal fat, and (D) *: p<0.05 vs liver (ANOVA with Post HOC Scheffe).
GGA, geranylgeranoic acid; ARA, arachidonic acid; LC/MS/MS, liquid chromatography mass spectrometry.
A
25-May-201615:06:04
1.00 2.00 3.00 4.00 5.00 6.00 7.00 8.00 9.00 Time
%
3
1.00 2.00 3.00 4.00 5.00 6.00 7.00 8.00 9.00
%
0
1.00 2.00 3.00 4.00 5.00 6.00 7.00 8.00 9.00
%
6
25-May-201615:06:04
1.00 2.00 3.00 4.00 5.00 6.00 7.00 8.00 9.00 Time
%
3
1.00 2.00 3.00 4.00 5.00 6.00 7.00 8.00 9.00
%
0
1.00 2.00 3.00 4.00 5.00 6.00 7.00 8.00 9.00
%
6
25-May-201615:06:04
1.00 2.00 3.00 4.00 5.00 6.00 7.00 8.00 9.00 Time
%
3
1.00 2.00 3.00 4.00 5.00 6.00 7.00 8.00 9.00
%
0
1.00 2.00 3.00 4.00 5.00 6.00 7.00 8.00 9.00
%
6
Liver
Liver
Thymus
GGA
ARA
2,3-dihydroGGA
R e la ti ve i n te n si ty o f si g n a ls (% o f m a xi m u m h e ig h t) m /z: 3 0 3 → 98 m /z: 3 0 3 → 259 m /z: 3 0 5 → 168
Retention time (min)
582 Journal of Lipid Research Volume 60, 2019
Fig. 1. Tissue distribution of endogenous free GGA, ARA, and 2,3-dihydroGGA in male Wistar rats measured using reverse phase LC/MS/MS analysis. A: Representative chromatograms of the rat hepatic lipid extract tracing GGA (m/z 303 → 98) and ARA (m/z 303 → 259), and of the rat thymus lipid extract tracing 2,3-dihydroGGA (m/z 305 → 168). The down arrow represents elution times of di-homo-!-linolenic acid. The tissue distribution of endogenous GGA (B) and 2,3-dihydroGGA (C) in male Wistar rats and a molar ratio of 2,3-dihydroGGA to GGA in each tissue (D) are shown in bar graphs. All bars represent the mean ± SE (n = 5).
***P < 0.001 versus each other organ (B); *P < 0.05 and ***P < 0.001 versus thymus (C); and *P < 0.05 versus liver (D) (ANOVA with post hoc Scheffe).
at Nagasaki Siebold Daigaku, on August 18, 2019www.jlr.orgDownloaded from
.html
http://www.jlr.org/content/suppl/2019/01/08/jlr.M090548.DC1 Supplemental Material can be found at:
20 Fig. 2-1 Continued.
0 20 40 60 80 100 120
Cerebrum Cerebellum
Thymu s
Lung Liver Kidney
Spleen Testis
Caput Corpus
Cauda Epididymal fat
Prostate Sem
inal vesicle
Ser um
0 200 400 600 800 1,000 1,200 1,400 1,600
Cerebrum Cerebellum
Thymus Lung
Liver Kidney
Spleen Testis
Caput Corpus
Cauda Epididymal fat
Prostate Seminal vesicle
Serum
0 20 40 60 80 100 120 140 160 180 200
Cerebrum Cerebellum
Thymus Lung Liver
Kidney Spleen
Testis Caput
Corpus Cauda Epididymal fat
Prostate Seminal vesicle
Serum
Epididymis Epididymis Epididymis
B
C
D
GGA (pmol/g wet wt)2,3-dihydroGGA
(pmol /g w e t wt )
Molar ratio of 2,3-dihydroGGA toGGA***
*,***
*
21
Figure 2-2. Calibration curves of GGA, ARA and 2,3-dihydroGGA.
GGA, geranylgeranoic acid; ARA, arachidonic acid. y = 28.688x R² = 0.9936
0 10 20 30 40 50 60 70 80 90
0 1 2 3
Peak Area
GGA (pg/injection)
y = 5.829x R² = 0.9988
0 500 1000 1500 2000 2500 3000 3500
0 200 400 600
Peak Area
ARA (pg/injection)
y = 0.5687x R² = 0.9983
0 200 400 600 800 1000
0 600 1200 1800
Peak Area
2,3-diGGA (pg/injection)
B
Supplemental Figure S1. A: LC/MS/MS chromatograms of authentic
GGA, ARA and 2,3-dihydroGGA in multiple-reaction-monitoring (MRM)
mode. B: Calibration curves of GGA, ARA and 2,3-dihydroGGA.
22
Table 2-1 Distribution of GGA, 2,3-dihydroGGA, ARA and their molar ratios in several organs of male Wistar rats.
*: Data are mean ± SE of male Wistar rats (5-weeks old, n=5).
GGA, geranylgeranoic acid; ARA, arachidonic acid.
Organ
Cerebrum *10.29 ± 2.03 612.47 ± 42.73 645.54 ± 26.33 0.16 ± 0.04 9.60 ± 0.86 72.86 ± 19.28
Cerebellum 12.44 ± 2.63 604.38 ± 105.28 611.82 ± 48.37 0.20 ± 0.04 9.71 ± 1.35 53.15 ± 7.60
Thymus 9.74 ± 2.21 1205.03 ± 205.63 497.13 ± 42.71 0.19 ± 0.04 23.94 ± 3.40 141.15 ± 34.28
Lung 10.04 ± 2.78 330.92 ± 89.53 741.48 ± 63.23 0.13 ± 0.03 4.14 ± 1.12 29.08 ± 8.33
Liver 80.97 ± 25.68 292.17 ± 82.60 580.60 ± 40.21 1.43 ± 0.43 5.02 ± 1.30 5.12 ± 1.48
Kidney 8.10 ± 2.53 350.92 ± 215.26 714.46 ± 77.50 0.10 ± 0.03 4.30 ± 2.63 34.44 ± 22.48
Spleen 7.97 ± 0.87 363.60 ± 137.78 848.41 ± 165.75 0.11 ± 0.02 4.84 ± 1.75 42.83 ± 13.16
Testis 13.96 ± 2.36 408.56 ± 172.14 318.53 ± 25.96 0.43 ± 0.07 12.17 ± 4.65 28.25 ± 9.42
Epididymis (Caput) 28.82 ± 2.13 298.24 ± 99.24 287.32 ± 14.79 1.00 ± 0.12 10.38 ± 3.01 10.35 ± 2.11
Epididymis (Corpus) 5.96 ± 1.13 258.46 ± 98.23 174.22 ± 13.08 0.34 ± 0.05 14.84 ± 3.64 43.37 ± 12.89
Epididymis (Cauda) 8.75 ± 3.07 320.10 ± 113.25 271.73 ± 55.39 0.32 ± 0.05 11.78 ± 2.99 36.58 ± 25.78
Epididymal fat 1.22 ± 0.31 76.66 ± 25.63 244.60 ± 35.89 0.05 ± 0.01 3.05 ± 0.90 69.29 ± 21.83
Prostate 13.58 ± 2.08 498.07 ± 144.04 463.92 ± 45.43 0.30 ± 0.04 11.31 ± 3.16 38.78 ± 11.06
Seminal vesicle 7.13 ± 1.96 522.83 ± 106.91 823.62 ± 100.55 0.09 ± 0.03 6.20 ± 1.03 105.98 ± 41.44
Serum 0.27 ± 0.04 4.21 ± 0.79 12.89 ± 1.92 0.21 ± 0.01 3.18 ± 0.19 15.38 ± 1.89
(pmol/mL) (pmol/mL) (pmol/mL)
(Molar ratio)
GGA 2,3-diGGA ARA GGA/ARA 2,3-diGGA/ARA 2,3-diGGA/GGA
(pmol/g) (pmol/g) (nmol/g) (Molar ratio x )10# (Molar ratio x )10#
23
Figure 2-3. Molar ratio of each endogenous acyclic diterpenoid to ARA in each tissue.
(A) Molar ratio of endogenous GGA to ARA in each tissue.
**: p<0.01 vs testis and ***: p<0.001 vs all other organs except testis.
(ANOVA with post hoc Scheffe)
(B) Molar ratio of endogenous 2,3-dihydroGGA to ARA in each tissue.
**: p< 0.01 vs lung, liver, kidney, spleen. ***: p< 0.001 vs seminal vesicle and serum.
(ANOVA with post hoc Scheffe)
All bars represent the mean ± SE (n = 5).
GGA, geranylgeranoic acid; ARA, arachidonic acid.
0.00 5.00 10.00 15.00 20.00 25.00 30.00
Cerebrum Cerebellum
Thymus Lung
Liver Kidney
Spleen Testis
Caput Corpus
Cauda Epididymal fat
Prostate Seminal vesicle
Serum
Epididymis
0.0 0.2 0.4 0.6 0.8 1.0 1.2 1.4 1.6 1.8 2.0
Cerebrum Cerebellum
Thymus Lung
Liver Kidney
Spleen Testis
Caput Corpus
Cauda Epididymal fat
Prostate Seminal vesicle
Serum
Epididymis
Molar ratio of 2,3-dihydroGGA to ARAx104Molar ratio of GGA to ARAx104
A
B
**,***
**,***
24
2-4. Inhibition of biosynthesis of cellular GGA by tranylcypromine (TCP)
First of all, I confirmed whether TCP, an inhibitor of MAOs, worked as a micromolar inhibitor of biosynthesis of GGA in a cell culture system. Fig. 2-4A clearly shows that TCP added in the culture medium decreased the cellular level of endogenous GGA in HuH-7 cells in a dose-dependent manner with apparent IC50 of approximately 33 µM. Furthermore, 100 µM TCP not only decreased the endogenous GGA (Fig. 2- 4B and C), but also suppressed the conversion of exogenously added GGOH to GGA in cultured HuH-7 cells (Fig. 2-4D and E).
25
Figure 2-4. Tranylcypromine-induced downregulation of cellular GGA levels in HuH-7 cells.
(A) Dose-dependent changes of endogenous GGA in HuH-7 cells after treatment with 0-100 µM of TCP for 24 h. The amount of the intracellular GGA represents the mean ± SD of three measurements. IC50 of TCP was obtained using GraphPad Prism 7.0.
(B-E) LC/MS/MS chromatograms of GGA in the lipid extracts from the nontreated control HuH-7 cells (B), the cells treated for 48 h with 100 µM TCP (C), with 25 µM GGOH (D) or the cells treated for 24 h with 25 µM GGOH after 24- h pretreatment with 100 µM TCP (E).
The arrows indicate the elution position of authentic GGA. The vertical axes of chromatograms show signal intensity of 85 as 100% (B and C), and 2,210 as 100% (D and E).
TCP, tranylcypromine; GGA, geranylgeranoic acid; ARA, arachidonic acid; LC/MS/MS, liquid chromatography mass spectrometry; GGOH, geranylgeraniol.
TCP in culture medium (µM)
A
GGOH 25 µM TCP (−)
GGOH (−) TCP (−)
D B
GGOH 25 µM TCP 100 µM GGOH (−) TCP 100 µM
E C
Retention time (min) Retention time (min) Relative intensity of signals (% of maximum height) m/z: 303→98
0 50 100
0 50 100
tranylcypromine (µM) Cellular levels of GGA (% of Control)
26 2-5. Downregulation of cellular GGA by MAOB siRNA
Even though TCP decreased the cellular level of both endogenous GGA and exogenous GGOH- derived GGA in HuH-7 cells, I cannot exclude a possibility that some other TCP-sensitive enzymes such as monoamine oxidase A (MAOA) and CYPs may be involved in biosynthesis of GGA. Therefore, I performed knockdown of the MAOB gene in HuH-7 cells using MAOB siRNA. The MAOB mRNA levels in HuH-7 cells transfected with MAOB siRNA were significantly decreased 72 h after the transfection (Fig. 2-5A), followed by a significant decrease in endogenous GGA at 120 h (siCtrl 8.95 ± 0.74 pmol/g; siMAOB 2.22 ± 0.18 pmol/g, p < 0.05, their representative LC/MS/MS chromatograms are shown in Fig. 2-5B).
Furthermore, the dramatic increase in the intracellular GGA level induced by the exogenous GGOH was significantly suppressed by MAOB knockdown (siCtrl 205.14 ± 7.36 pmol/g; siMAOB 77.19 ± 3.36 pmol/g, p < 0.05, see Fig. 2-5C). In addition, MAOB knockdown significantly suppressed the squalene synthase inhibitor zaragozic acid A (ZAA)-induced accumulation of endogenous GGA (siCtrl 44.23 ± 1.36 pmol/g;
siMAOB 13.37 ± 2.14 pmol/g, p < 0.05, see Fig. 2-5D).
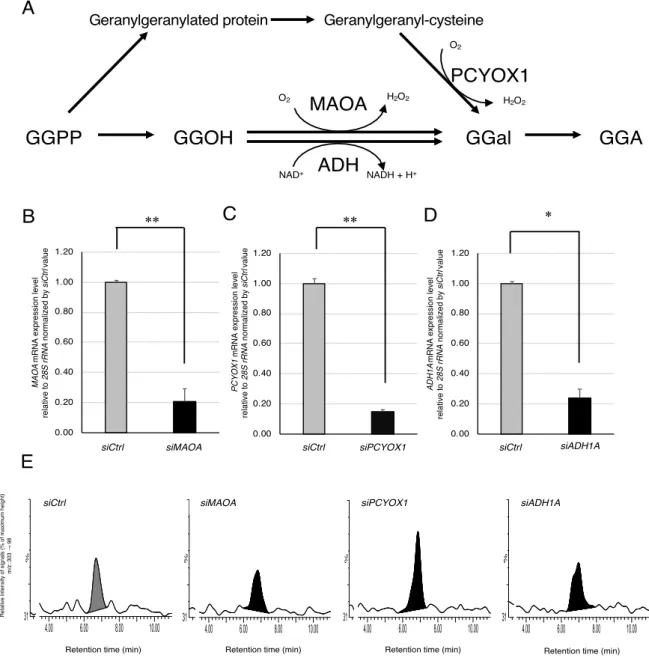
According to the literature, MAOA, prenylcysteine oxidase (PCYOX1) and ADH are potential enzymes that generate GGal, a direct precursor of GGA (Fig. 2-6A). Hence, here, I knocked down each gene encoding these enzymes and measured the amount of endogenous GGA. Although the transfection of MAOA siRNA, PCYOX1 siRNA, or ADH1A siRNA significantly reduced each gene mRNA level compared to negative control siRNA 72 h after transfection (Fig. 2-6B, C and D). In contrast to the case of the MAOB knockdown (Fig. 2-5B), the cellular levels of endogenous GGA in HuH-7 cells were not decreased and unexpectedly increased in the PCYOX1 siRNA-treated cells at 120 h (Fig. 2-6E). When the relative cellular level of MAOB mRNA in each siRNA-treated cell was examined, the MAOB expression level was
significantly increased by PCYOX1 siRNA treatment (Fig. 2-6F). When the intracellular levels of
endogenous GGA were plotted against MAOB mRNA levels in these cells, a strong correlation was detected between endogenous GGA and MAOB mRNA levels (r2 = 0.8465, Fig. 2-6G).